A Case Study in Business Market : Banks’ Profitability:
Evidence from Jordanian Commercial Banks (2002-2015 )
Mohammad Alalaya
Associate Professor in Econonmics Quantitative Method Faculty of Business Administration,
Department of Economics
Suleiman A. Al Khattab
Associate Professor in Marketing, Department of Business Administration ,AlHussein bin TalaL University - Maan , Jordan
Abstract
This paper investigates the determinant variables serving as macroeconomic and microeconomic indicators of commercial banks’ profitability in Jordan for the period 2002-2014. Three models are utilised. The first analyses cross-sectional data using ROA as the independent variable and ROE, CIRT, TD/TA and size of banks as regressors in the analysis. The second model takes ROA as the dependent variable and ROE, TL/TA, TD/TA, size of bank, stability and log (assets) as independent variables. The third model uses panel data, taking ROA as the dependent variable and log (GDP), log (per capita), log (lending interest), log of inflation and log (ROCE) as independent variables. Then we test a model with ROA as independent variable and with stability and vector of macroeconomic variables to assess the impact of stability on bank profitability.
Results:
R-squared in the first model was as high as 0.715, with 1% changes of explanatory variables (CIR, ROE, size of bank) leading to changes in ROA, and most of the impact variables had strong negative relationships with the predictor. In the pooled model, R2=64.2%, which is good enough to explain the changes of the variable with the
predictor.
Log of assets of banks had a significant negative relationship with ROA, whereas ROE had a positive and significant relationship, TD/TA had a positive effect, TL/TA had a positive relationship (0.267) and stability of political and economic conditions had a negative effect (-0.019).
The third model suggests that GDP had a negative impact, while the fixed effects model gave the same result. GDP and per capita inflation rate were found to be negatively signed, ROCE had a negative impact in the pooled model and in the fixed effects model. The results of the analysis emphasise the impact of the determinants which affected the ROA.
Key words: Commercial banks, Jordan, Profitability, Pooled data, Panel data. Jel Classification: G32, L11.
SECTION 1: INTRODUCTION 1-1 Aim and objectives
This paper aims to examine the relationship between the determinants and profitability in 13 commercial banks and their branches by using:
a- Cross-sectional time series data. b- Panel data analysis.
In order to meet this aim, the objectives of the study are :
1- To estimate whether there is a relationship between determinants of bank profitability and profitability such as total deposits, and total equity over banks profitability.
2- To check whether loans contribute to banking profitability.
3- To estimate whether the political disorders in Jordan, and the external surrounded has influence effect in banks profitability.
1-2 Hypotheses
The hypotheses to be tested are:
H1: There is a positive relationship between the size of a bank and its profitability.
H2: There is a positive relationship between capital adequacy and profitability.
H3: There is a positive relationship between liquidity and profitability.
H4: There is a positive relationship between interest rate and profitability.
H5: There is a positive relationship between inflation rate and profitability.
1-3: Recent papers and previous studies
Commercial banks have an important role in economic development and are one of the main indicators and intermediate causes of growth, as providers of financial services to the community, meeting its needs for money in the form of loans and debts. Buyinza (2010) investigated the profitability of a sample of 23 commercial banks in sub-Saharan Africa during the period from 1999 to 2006. He used panel data and applied a regression methodology, analysing many macro-variables, such as bank size, credit risk, bank efficiency, management size, the diversified earning ability of the banks, per capita GDP, GDP growth rate and inflation rate. All of these macro-variables were found to have a positive impact on banks’ profitability.
John and Oke (2013) examined the influence of capital adequacy on bank performance from 2003 to 2007 (EPS and PAT, 2009) and concluded that bank managers should concentrate on efficient and effective bank supervision and risk management. The results of a study of determinants of banks’ profitability in developing countries between 1980 and 2010, by Aremu et al. (2013), indicate that credit risk and liquidity capital adequacy are significant drivers of bank profitability. Credit quality is considered a proxy of operational performance and financial procedures of banks. The risk of debt in the banking industry is that borrowers will not repay on time or sometimes not repay at all. Aftriye and Akotey (2010) argue that sound credit risk management is critical for the survival and growth of commercial banks, while Oke et al. (2012) assert that the health of the financial sector depends chiefly on a sound banking system.
The most prominent issue in the corporate finance literature, according to Aqbada and Osuji (2013), concerns the depositing of money in banks, allowing them to grant loans, advances and overdrafts to their customers, because in the process they earn profits for their investment funds, creating profitability and liquidity. Thus, as banks strive to strike a balance between profitability and liquidity, their main goal is the provision of sufficient liquidity to customers at all times (Niresh, 2012). Therefore, banks must ensure that sufficient provision of cash and other semi-cash securities are made available to meet withdrawal obligations and new loan demands by customers in need of liquidity. If enough money is deposited, banks can provide an array of financial services to their customers, through which the deposits from the banking public are mobilized, while credits are granted for investment purposes. Creating value for shareholders is now also widely accepted as a corporate objective. A growing literature focuses on various factors that influence the performance of banks, but generally few studies have used shareholder value creation metrics as their performance indicators. These few include Fiordlisi and Moleynex (2007), Beccalli (2006) and Berk and DeMarzo (2011), who affirm that since equity holders are the last group to be paid, it suffices to indicate that a firm which creates wealth for its shareholders ultimately satisfies all other interest groups. Foong et al. (2007) educe that dividend policy influences the cost of capital. The nature of a bank’s ownership has also been argued to influence its profitability and hence shareholder value, which is a dominant factor in share ownership. Thus, there are strong differences between locally owned and foreign owned banks; for example, the latter are believed to have access to more capital, better technical know-how and greater expertise than the majority of locally owned banks. This factor was investigated by Adusei (2011), who found a significant correlation between ownership and profitability. Other authors state that monetary policy may affect as the value of bank assets, which affects the price and availability of non-deposit funds, without influencing the amount of deposits; therefore, monetary policy can affect a bank’s loan supply (Stein, 1998; Ahtik, 2010).
Basel ll (2004) requires banks to show categories for nonperforming loans according to days at risk and provisions used in analyzing NPL level. The other view is that it is the responsibility of banks to assess and vet effectively the creditworthiness of loan applicants and the effectiveness of their own lending policies, to minimize the risk of loan default. In extreme cases, banks in some countries failed or were forced into mergers. As a result, in the interests of broader financial stability, substantial amounts of liquidity were approved by the authorities in many countries, including Canada and the United States (Longworth, 2010; Kanle and Stalz, 2008). Bourke (1989) finds some evidence of a positive relationship between liquid assets and the profitability of 90 banks in Australia from 1972 to 1981, while Goddard et al. (2004) report mixed evidence of a negative relationship between the two variables for European banks in the late 1980s and mid-1990s. Liquid assets are generally included as a control variable in these studies.
Conceptually, Morris and Shin (2010) define the liquidity ratio as the ratio of realizable cash on the balance sheet to short-term liabilities, but in general, an increase in the relative liquid asset holdings of a bank reduces its probability of default, thereby having a negative effect on profitability, so the authors expect liquid assets to exhibit a nonlinear relationship to bank profitability.
The optimal level of a small country’s international reserves increases with the level of its short-term debt, according to Ramciere (2009). Tilmaz et al. (2013) analyzed profitability and its determinants for nine emerging countries including Turkey. Their results identify management’s operating expenses, capitalization, credit risk, bank size and inflation as important determinants of two dependent variables: return on assets and net interest margin.
square (OLS) method, found strong evidence that these variables had a strong influence on profitability and that having large total assets would not necessarily lead to higher profits. In an earlier study, Staikouras and Wood (2003) report that a higher loan ratio actually impacts profits negatively.
Goddard et al. (2004) used panel and cross-sectional regression to estimate growth and profit equations; Afana Sieff et al. (2002) used panel data techniques to identify the main determinants of bank interest spreads in Brazil; and Ho and Saunders (1981) used panel data to measure the relative impact of micro and macro factors. The results suggest that macroeconomic variables are the most relevant elements to explain interest spread in brazil.
Banks profitability factors affecting the profitability appeared in the following diagram. Diagram (1 ) : Banks profitability
.
SECTION 2: 1 – 2 :Brief notes on the Jordanian commercial banking sector
The effect of commercial banking on the Jordanian economy appears to be in boosting growth rates through the mobilization of national savings and utilizing them to finance productive economic activity.
In 2011 there were 695 bank branches spread across Jordan, an increase compared with 2006 and 2007, according to the Central Bank of Jordan (CBJ) Annual Report (2012). The report classifies banks into two categories: foreign banks, and national and Islamic banks. The CBJ has removed many constraints and enacted many policies to encourage more new banks, making serious efforts to nudge the existing banks into consideration of the entry of new banks. Therefore, one of the determinants of profitability is the operating environment of banks in Jordan, which enhances financial stability. Any study of banking efficiency and the impacts of determinants should consider this factor.
Table 1: Financial indicators of Commercial Banks in Jordan Year Total assets
(million JD)
Total credit (million JD)
Total deposits (million JD)
Total capital
(million JD) ROE (%) ROA (%)
CAR (%)
2002 16.092.5 1664.5 2756.1 365.1 19.6 1.65 15.73
2003 17.243.6 1710.3 2948.5 398.6 17.61 1.83 16.2
2004 19.798.3 1659.4 3476.4 413.3 18.72 1.78 16.4
2005 21.086.5 1865.4 3799.9 444.4 20.8 2.00 17.3
2006 24.237.6 2312.4 3877.2 477.8 15.1 1.73 21.1
2007 26.815.6 3077.4 4144.1 526.7 12.46 1.62 20.7
2008 29.796.7 4353.1 4732. 561.1 11.52 1.47 18.4
2009 31.0956.9 5203.4 5290 780.9 8.7 1.11 19.6
2010 34.973.8 5686.3 5992.2 565.8 8.63 1.12 20.3
2011 37.285.6 9030.8 6816 637.4 8.27 1.16 19.1
2012 40.767.3 10179.4 6216.4 587.9 10.61 1.21 19.4
2013 41.857.3 11365.5 7115.1 612.8 9.38 1.43 19.2
2014 42.695.3 11987.6 7436.2 698.7 10.12 1.09 18.6
2015 44.874.1 12673.4 7614.7 723.1 8.56 1.27 19.8
Sources: CBJ monthly reports and yearbooks (2003-2015).
ROE=Return on equity; ROA=Return on assets; CAR=Capital adequacy ratio, estimated as the average ratio of the sample.
Table 2: Descriptive statistics for the sample
Mean St. dev. Skewness Kurtosis
Total Assets 5799400 1036.5 3.2799 8.88
Total Credit 57632 4415.2 0.38 -1.405
Total Deposits 51248 1669.6 0.116 -1.367
Total capital 5539.3 1770.4 0.207 -0.966
ROE (%) 0.11087 0.0669 -0.241 -1.089
ROA (%) 1.545 0.2672 -0.033 -0.740
CAR (%) 0.1865 0.0172 -0.275 -0.911
The relationships between R.O.E and R.O.A, CAR declared in the following diagram ,which emphasis that the ratio increased in the first period of the study ,but drop down from the medial period of R.O.E, Were in R.O.A the same situation ,but differ in CAR it increased time to other.diagrm (2) shows this illustration.
Diagram 2 : relationships between R.O.E, R.O.A, and CAR of Jordanian commercial banks.
2-2 : Variables used in the study
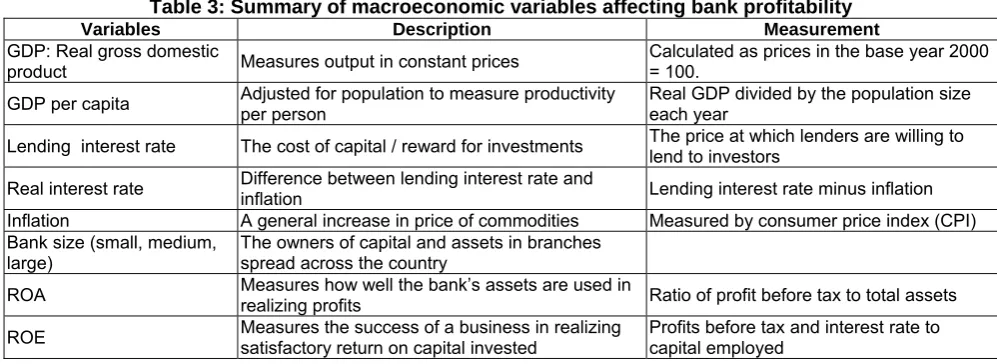
It is important to understand the macro-economic factors affecting an economy, to aid effective review of the effects of such variables on banks’ profitability. Table 3 lists these variables, which are then explained in turn.
Table 3: Summary of macroeconomic variables affecting bank profitability
Variables Description Measurement
GDP: Real gross domestic
product Measures output in constant prices
Calculated as prices in the base year 2000 = 100.
GDP per capita Adjusted for population to measure productivity per person Real GDP divided by the population size each year Lending interest rate The cost of capital / reward for investments The price at which lenders are willing to lend to investors Real interest rate Difference between lending interest rate and inflation Lending interest rate minus inflation Inflation A general increase in price of commodities Measured by consumer price index (CPI) Bank size (small, medium,
large) The owners of capital and assets in branches spread across the country
ROA Measures how well the bank’s assets are used in realizing profits Ratio of profit before tax to total assets ROE Measures the success of a business in realizing satisfactory return on capital invested Profits before tax and interest rate to capital employed
management to acquire deposits at a reasonable cost and invest them profitably. The higher the ROA, the more profitable is the bank. Table 4 lists the ROA of Jordanian commercial banks classified by size.
Table 4: ROA of Jordanian banks
Bank size 2004 2007 2011 2014
Small 0.00153 0.00193 0.00238 0.00246
Medium 0.00167 0.00265 0.00355 0.00398
Large 0.00197 0.00327 0.00654 0.00743
These results show that the larger banks operating in Jordan are more profitable, as measured by ROA, than small and medium-sized ones. They are able to control their expenses more effectively, reflected in higher net profit margins. Thus, large banks are able to make more efficient use of their assets, which results in a higher total asset turnover ratio.
Table 5: Net profit and asset utilisation of Jordanian banks by size and year
Bank size 2004 2007 2011 2014
Small 0.0965 0.1147 0.1245 0.14523
Medium 0.1032 0.1248 0.1439 0.1563
Large 0.1254 0.1542 0.1612 0.15987
The results in Table 5 show a sharp improvement in net profit and asset utilization, which indicates that profits rose throughout the period of the study. With respect to asset utilization, small banks lagged behind the medium and large banks.
Return on equity (ROE) is the ratio of total equity to total assets for the bank at a given time. It represents capital adequacy and should capture the safety and soundness of the financial institution. It also indicates the ability of a bank to absorb losses or handle the risk exposure of shareholders. It is expected to be a positive relationship because capitalized banks are less risky and more profitable. Table 6 show the ROE of the three categories of banks.
Table 6: ROE of Jordanian banks by size and year
Bank size 2004 2007 2011 2014
Small 0.0673 0.0698 0.07213 0.0795
Medium 0.0892 0.1123 0.12782 0.1326
Large 0.0987 0.12450 0.14332 0.15326
These results reveal that the ROE of the small banks remained relatively level over the study period, while at the same time there seem to have been significant improvements in the results for both medium and large banks. The steps taken by the CBJ reserves to mandate best practice for Jordanian commercial banks of all sizes, the deregulation of the banking sector and the reforms that have been undertaken seem to have had the effect of making Jordanian banks more competitive and in levelling the playing field, where some had enjoyed a significant lead in ROE for a long time.
Cost/income ratio (CIR) shows the income generated per JD of cost, in other words, how expensive it is for the bank to produce a unit of output. A lower CIR is better, and it can be used as a measure of bank performance.
Stability measures how stable the bank is in terms of the economic and political environment, whether it is affected by the financial system, by demand and supply, by the changing policies of the government from one period to another, and so on. In the case of Jordan, an important factor is the migration of Syrian and Iraqi refugees to Jordan, with the risk of political disorder in Jordan. This is treated as a dummy variable: if the bank is considered stable, it scores 1; if not, then 0.
Other variables in the study are mentioned in the text, which explains how they are measured. These include the inflation rate, interest rate, size of bank, total loans to total assets (TL/TA) and total debt to total assets (TD/TA).
SECTION 3:DATA AND METHODOLOGY 1-3 : Data sources
The dataset provides evidence of stability, due to use of the logarithm data for each sample, and indicates that the data responds to cyclical movements. The second model consist of two separate equations.
Other sources of data used in this empirical work were the IMF annual reports for 2011 and 2014, Department of Statistics reports and the Arab unified report of financial statements of banks for 2002, 2006, 2009, 2012 and 2014. The empirical tests were concerned with the determinants of the interest margin and profitability of Jordanian bank deposits. Capital ratio, liquidity ratio, inflation and economic stability were used as proxies for the indicators, while some macroeconomic variables were used as financial structure indicators.
2 – 3: Methodology
The methodology of the study involves two models: a cross-sectional time series and panel data analysis. In the first model, ROA is treated as an independent variable, while the dependent variables are ROE, CIR, bank size, TL/TA and TD/TA. The methods are explained below.
Table 7: Pearson's correlation matrix of Jordanian commercial banks’ indicators of profitability
Variable ROA ROE CIR TD/TA Size
ROA 1 -0.673 0.798 -0.15 -0.123
Sig (2-tailed) 0.00 0.0036 0.006 0.321 0.1072
ROE -0.673 1 0.342 -0.275 -0.1037
Sig (2-tailed) - 0.61 -0.64 0.827
CIR 1 -0.269 0.563
Sig (2-tailed) 0.00 0.001 0.722
Size of bank 1
Sig (2-tailed) 0.00
TD / TA Sig (2-tailed)
The correlation matrix in Table 7 shows that ROE is has a weak negative correlation with ROA and bank size, whereas CIR has a strongly negative and statistically significant (0.006) correlation with ROA.
SECTION 4: EMPIRICAL RESULTS : 1 - 4 : Regression analysis
The first model was tested by pooling the observations across the banks and applying regression analysis on the pooled panel, using the following equation:
it U 6it 6 5it 5 4it 4 3it 3 2it 2 1it 0
it
a
a
X
a
X
a
X
a
X
a
X
a
X
R
1
rate. Interest 6it commodity. the of level Price 5it t. at time i bank for assets of size by measured size Bank 4it t. at time i bank for assets by total divided loans Total 3it t. at time i bank for asset by total divided equity E/A total 2it t. at time i bank for assets total of Logarithm 1it ity profitabil as ROA presents which i, at time i bank for assets on Return it
X
X
X
X
X
X
.
X
Table 8 shows the result of OLS regression for the data.
Table 8: OLS results for series of profitability variables of Jordanian banks, 2002-2015. Independent variable: ROA.
Variables Coefficients t-test Prob. level
Constant 7.22634 5.123 0.001
ROE -0.162 -0.479 0.543
CIR -0.0174 -0.481 0.522
TD / TA -0.215 -0.267 0.498
Size -0.193 -0.267 0.369
R2 0.715
Adjusted R2 0.698
F-statistic 28.553
Prob. (F-stat) 0.012
According to the results in Table 8, the conservative coefficient of determination of multiple regression of R2 = 0.715, which shows that 71.5% of the variation of Jordanian banks’ profitability is explained by these independent variables. The R-2 value indicates that we can add more explanatory variables to the model. The F-statistic value is 28.0553, F-statistically significant at 0.012 (P<0.05), which indicates that we can accept the alternative hypothesis that the predictor affects profitability. The value of the Durbin-Watson statistics is 1.374 (P<2), meaning that the independent term errors are free of autocorrelations. Other results show that a 1% decrease in CIR, ROE or bank size would lead to changes of ROA. Most of the dependent variables have a strong reactive relationship with the predicator independent variable (ROA), while bank size has a weak negative relationship with ROA (-0.193), which means that size has a weak effect on the profitability of banks.
2 - 4 : Second model
We start the analysis of the second model as shown in Table 9.
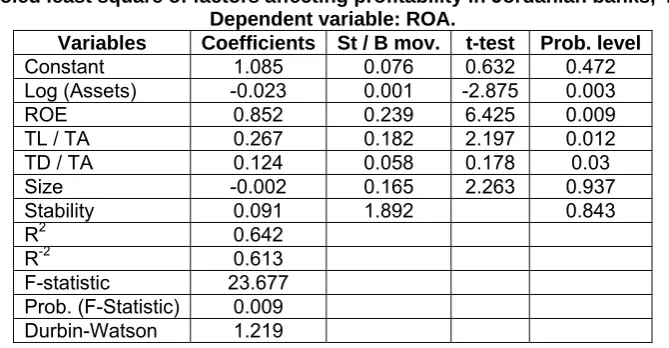
Table 9: Pooled least square of factors affecting profitability in Jordanian banks, 2001–2014. Dependent variable: ROA.
Variables Coefficients St / B mov. t-test Prob. level
Constant 1.085 0.076 0.632 0.472
Log (Assets) -0.023 0.001 -2.875 0.003
ROE 0.852 0.239 6.425 0.009
TL / TA 0.267 0.182 2.197 0.012
TD / TA 0.124 0.058 0.178 0.03
Size -0.002 0.165 2.263 0.937
Stability 0.091 1.892 0.843
R2 0.642
R-2 0.613
F-statistic 23.677 Prob. (F-Statistic) 0.009
Durbin-Watson 1.219
The results listed in Table 9 indicate that 64.2% of variation in ROA is explained by the independent variables of the model, while 35.8% of the variation in the predicator remains unexplained by them. Adjusted R-2 is 61.3%, which means that some other independent variables can be added to the model to explain the variation in the predicator. The value of the F-statistic is 23.677 and the validity and stability of the model are supported by the fact that the log (Assets) value has a significant but weak negative relationship with ROA (-0.023), while ROE has a positive and significant (at 5%) relationship with ROA (0.852), which means that well capitalized banks experience higher returns, and that total deposits have a positive and significant effect on the ROA of the bank. The ratio of total loans to total assets is 0.267 and this is a significant positive relationship, which indicates that more loans provide more profit for the bank, a result consistent with many reports in the literature (Athana solqou et al, 2006).
Lastly, the stability (environmental condition) of the country has a coefficient of -0.019, indicating a significant negative relationship, due to the effects of Iraqis and Syrians who have migrated to Jordan with their investments, then taken large amounts of money out of the country.
In order to support the pooled OLS data, we performed a multicollinearity test, shown in Table 10. Table 10: Multicollinearity test for series of variables
Variables Tolerance VIF
Log (Assets) 0.762 1.102
ROE 0.618 1.425
TD / TA 0.933 1.567
Size 0.235 1.936
Stability 0.152 2.134
The results in Table 10 suggest no multicollinearity, because the tolerance values are close to zero, and VIF is less than 10. These parameters are reasonably good and suggest the absence of multicollinearity among the variables of the model.
Table 11: Results of incremental regression, removing ROE
Model Results
R-squared 64.2 R-squared (after removal) 35.5
Results of the second model panel data
To establish the effects of macroeconomic variables on banks profitability the second model was run and results of pooled data with fixed effects are listed in Table 12.
Table 12: Results of macro-variables and ROA (pooled and fixed effects). Dependent variable: ROA
Variables Pooled Model Fixed Effects
Log (GDP) -1.036 (3.429)** -2.028 (- 4.163)** Log (per capital) - 0.027 (- 2.186)** -0.031 (- 5.633) ** Log (Lending interest) 0.662 (4.451)** 0.348 (1.1332) ** Log (inflation) - 0.512 (- 1.073) - 0.427 (- 2.832) ** Log (ROCE) - 0.093 (- 5.297)** 0.063 (- 3.277) **
R2 0.235 0.387
F-test 0.0005 ** Significant at 5%, 1% level * Significant at 5%, t-statistic in brackets.
The results in Table 12 show that the lending interest rate in Jordanian commercial banks was found to be positively and significantly related to ROA levels (0.662) in pooled OLS. This suggest that ROA is responsive to changes in lending interest rate. It was found that real GDP was negatively and significantly related to the ROA performance of the commercial banks under pooled analysis, while the fixed effects model depicts a similar significant and negative relationship with per capita GDP. Together, these two findings suggest that a negative growth in real or per capita GDP will not necessarily lead to increased ROA, due to being unsuited to the needs of the community. Inflation was also found to be negatively related to ROA level under fixed effects, which means that under both models, ROA is not responsive to inflation. It was found that in the pooled model, ROCE had a negative sign and was statistically significant, whereas in the fixed effects model the relationship was positive and statistically significant.
The F-test confirms the stability and reliability of the fixed effects model, hence validating the robustness of the study findings. The results in Table 10 offer further evidence that under the pooled model ROE and ROCE lead to an increase in banks’ profitability, as portrayed by the fixed effects model, where they were found to be negatively and significantly related to ROA. This further confirms that ROA, ROE and ROCE affect nonperforming loan levels, and confirms the mutual relationship of ROA to ROE and ROCE in determining the magnitude of the stability of the macroeconomic environment and bank size variables, as Table 13 shows.
Table 13: Results for selected model variables. Dependent variable: ROA. Method: GLS (cross-section weights). Total panel observation: 916.
Variables Coefficients St / error t-statistic Prob. level
C 5.67721 2.0364 2.534 0.0382
Stability 2.8834 2.655 6.796 0.001
Macro-sector 0.4361 0.1327 4.933 0.00
Selected model estimation: ROA=5.677 + 2.0883 stability + 0.4361 Macro.
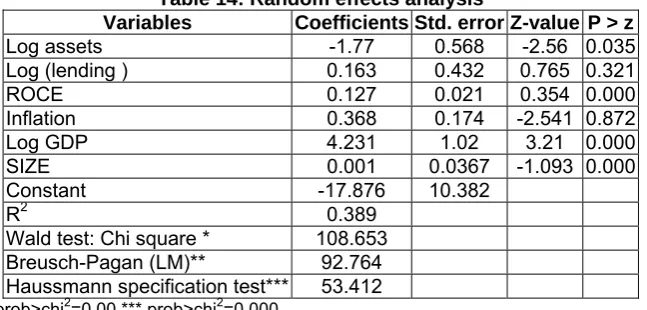
These results for stability in economic and political policies mean that any change leads to a corresponding increase by 0.436 in commercial banks’ profitability in Jordan. The Housman test was employed to estimate the probability of results being random effects. Table 14 shows the random effects analysis.
Table 14: Random effects analysis
Variables Coefficients Std. error Z-value P > z
Log assets -1.77 0.568 -2.56 0.035
Log (lending ) 0.163 0.432 0.765 0.321
ROCE 0.127 0.021 0.354 0.000
Inflation 0.368 0.174 -2.541 0.872
Log GDP 4.231 1.02 3.21 0.000
SIZE 0.001 0.0367 -1.093 0.000
Constant -17.876 10.382
R2 0.389
Wald test: Chi square * 108.653
Breusch-Pagan (LM)** 92.764
Haussmann specification test*** 53.412
Log lending, log assets and ROCE seem to suffer from managerial inefficiency and imperfectly designed incentives. The effects of technical and marginal advantages are due to foreign dealers and the procedures of the CBJ, i.e. the environment external to the commercial banks in Jordan, while limited exposure to risk defaults does not seem to significantly increase the returns of banks of all categories, to the extent that other variables included in the regression may partially account for credit risk. the Breusch-Pagan LM test result of 92.764 confirms the presence of individual effects in the data. The Haussmann specification test rejects the null hypotheses that coefficients of random and fixed effects are not systematic, providing evidence in favour of the fixed model.
SECTION 5:CONCLUDING REMARKS
This paper has investigated the effects on the profitability of 13 Jordanian commercial banks between 2001 and 2014 of macroeconomic variables and other factors such as stability and bank size, using econometric methods and three models. The first model used pooled OLS regression of a cross-sectional series and the other two models employed the pooled OLS and fixed effects methods, but with different factors. Rate of return on assets was used as the dependent variable in all models, with different independent variables in all models. The macroeconomic factors used in the whole study were total equity, total deposits/total assets, total loans/total assets, total deposits/total assets, log of total assets, return on assets, return on capital employed, GDP, lending interest rate stability and bank size. The findings can be summarised as follows.
1- We found a negative relationship between loans and the profitability of Jordanian banks.
2- Total deposits to total assets and total equity to total assets showed positive and significant relationships with profitability. We can depend on these factors as major internal determinants of profitability in Jordanian banks.
3- Higher total assets may not necessarily lead to higher profits.
4- The study found evidence that bank stability and bank size are external determinants of profitability in Jordanian commercial banks. These have a higher performance at a higher magnitude (P=2.8834) compared with macroeconomic factors (B=0.4361). However, some researchers report that the influx of Syrian and Iraqi immigrants increased the capital adequacy, the size of branches and the capital of Jordanian commercial banks, through transfers of money to Jordan.
REFERENCES :
1 Afanasieff T., P.Lhacer and M. Nakane. (2002). “The determinants of bank interest spread in Brazil ”, Working Papers. (Banco Central di Brazil).
2 Arellano, M. (1987): “Computing Robust Standard Errors for Within‐Groups Estimators” Oxford Bulletin of Economics and Statistics, Vol. 49, pp. 431‐34.
3 Aremu, A.M.; Ekpo, I. C. and Mustapha A. M. (2013). Determinants of Bank Profitability in a Developing Economy: Evidence from Nigeria Banking Industry. Interdisciplinary Journal of Contemporary Research in Business, Vol. 4 No 9, January 2013. Retrieved November 3, 2013,
4 A .yilmaz (2013): "profitability of banking system ,evidence from emerging markets ", international academic conference proceedings ,june, 14-16 ,2015, Antalya , Turkey.
5 Basel Committee on Banking Supervision, 1998, Risk Management for Electronic Banking and Electronic Money Activities.
6 Basel Committee on Banking Supervision, 2003, Risk Management Principles for Electronic
7 Bourke, P. 1989, "Concentration and Other Determinants of Bank Profitability in Europe, North America, and Australia",
Journal of Banking and Finance, vol. 13, No. 1, pp. 65-79.
8 Beccalli, E., B. Casu, and C. Girardone (2006): Efficiency and Stock Performance in European Banking. In: Journal of Business Finance & Accounting, Vol. 33, 2006, Issue 1/2, pp. 245-262 .
9 Buyinza, F. (2010). Determinants of Profitability of Commercial Banks in Sub-Sahara Africa Countries. Unpublished Work of the Department of Economics, Johanassen Keppler University, Linz – Austria. Retrieved June 24,2011, from www.econ.jku.at/.../ buyinza. pdf..
10 entral Bank of Jordan Annual Report, several issues : from 2002- to 2015 .
11 Dietrich A., Wanzenried G., 2010. Determinants of Bank Profitability Before and Duringthe Crisis: Evidence from Switzerland, available on-line at SSRN: http://ssrn.com/abstract=1370245.
12 Javaid S, Anwar J, Zaman K, Ghafoor A (2011). Determinants of Bank Profitability in Pakistan: Internal Factor Analysis, J. Yasar Univ. 23(6):3794-3804. Accessed 6/8/2013. Electronic copy available at: http://www.mcser.org/images/stories/2_journal/mjss02/saura%20javaid.pdf
13 Javaid, S., Anwar, J., Zaman, K and Gaffor, A. (2011). Determinants of Bank Profitability in Pakistan: Internal Factor Analysis, Mediterranean Journal of Social Sciences, 2(1): 59-78. Accessed 6/8/2013. Electronic copy available at: http://www.mcser.org/images/stories/2_journal/mjss02/saura%20javaid.pdf .
14 John E. E. and Oke M.O.(2013). Capital Adequacy Standards, Basle Accord and Bank Performance: The Nigerian Experience (A Case Study of Selected Banks in Nigeria). Asian Economic and Financial Review Journal, Vol.3, No2,
pp: 146-159.Retrieved November 3, 2013, from www.aessweb.com/download.php?id=1767
16 H.Afiriyie,D.O.Akotey (2013 ) : "credit risk management and profitability of rural banks in the brong Ahafa region of Ghana " ,European journal of business and management ,vol 5,No24,(2013).
17 Goddard, J., Molyneux, P. & J.O.S. Wilson (2004). "Dynamics of Growth and Profitability in Banking," Journal of Money, Credit and Banking 36, 1069-1090. ", Journal of Money, Credit and Banking, vol. 36, no. 6, pp. 1069-1090.
18 Goddard, J., Molyneux, P. & Wilson, J.O.S. 2004b, "The profitability of European banks: a cross-sectional and dynamic panel analysis", Manchester School, vol. 72, No. 3, pp. 363-381.
19 Kosmidou, K., F. Pasiouras, (2005), The Determinants of Profits and Margins in the Greek Commercial Banking Industry: evidence from the period 1990-2002, Working Paper (Financial Engineering Laboratory, Department of Production Engineering and Management, Technical University of Crete).
20 Kleibergen, F., and Schaffer, M.E. 2007 : “ranktest: Stata module for testing the rank of a matrix using the Kleibergen‐Paap rk statistic” http://ideas.repec.org/c/boc/bocode/s456865.html
21 Longworth, D. 2010 : “Bank of Canada Liquidity Facilities: Past, Present, and Future”, Remarks by David Longworth C.D. Howe Institute, 17 February 2010.
22 Morris, S., and Shin, H. Song. (2010): “ liquidity Component of Credit Risk”, Working Paper, Princeton University. 23 Omoniyi .B.Ajayi, C.F.Kekereowo, I .O (2013)" An explanation of the impact of corporate governance on bank
performance in Nigeria ,(2006 – 2010 ) " ,international journal of business and management innovation, vol 2, issue 71, Jully 2013, pp.12-16.
24 Pasiouras F., Kosmidou K., Ch. Gaganis, (2005), A Pooled Study of the Internal and External Determinants of Australian Banks Profits and Margins, Working Paper, Financial Engineering Laboratory, Department of Production Engineering and Management, Technical University of Crete. Business and management innovation, vol 2, issue 71 , july ,2013 pp. 12-16.
25 Stiglitz, J. 2006 : “Making Globalization Work”, W.W. Norton. Staikouras, C. & Wood G., (2003). The Determinants of Bank Profitability in Europe, Paper presented at the European Applied Business Research Conference. (1956). "The Interest-Elasticity of Transactions Demand For Cash," Review of Economics and Statistics, 38(3), pp. 241-247. Reprinted in Tobin, Essays in Economics, v. 1, Macroeconomics, pp. 229- 242.
26 Tom Fong , Jimmy Wang ,Erik Wang( 2007)determinants of the performance of banks in Hong Kong " future articles. Without NO, and date.
27 Trujillo-Ponce A., 2013. What determines the profitability of banks? Evidence from Spain. Accounting and Finance, Vol. 53, No. 2, pp. 561–586.