Research Article
Determination of
phenel-zine in human plasma
sample using SPE- UPLC–
MS/MS assay
Swetha Savakulaa*
, Madhusudhan Ka
, Mahesh Ka
, Nagasudheer Balusu a
, Manoj Kumar Ma
, S.Sai Satyanaraya Reddyb, Ravindra Reddy.Sb
a ClinSync clinical Research Pvt Ltd, Hyderabad,
Telangana, India.
b Vardhaman College of Engineering, Hyderabad,
Telan-gana, India.
Date Received: 30th July 2016; Date accepted: 11th
Aug 2016; Date Published: 14th August 2016
E-mail:[email protected]
Abstract
In this paper a fast and highly sensitive ultra-high performance liquid chromatography (UPLC) me-thod for the determination of phenelzine in human plasma have been developed using tandem mass spectrometry (MS/MS) detection. Hydroxyzine was used as an internal standard (IS). The extraction of the phenelzine from human plasma was performed using solid phase extraction. ACE-C18 (5µm, 100 x 4.6mm) reverse phase column was employed for chromatographic separation of analyte and internal standard for MS/MS detection at 0.9 ml/min flow. Detection was performed at transitions of m/z
137.258→ 106.906 for phenelzine and m/z 376.022→
202.006 for hydroxyzine by positive electro-spray ionization (ESI+) in multiple reaction monitoring (MRM) mode using tandem mass spectrometry. The developed method was compared in the terms of validation parameters including linearity, sensitivi-ty, precision and accuracy. The analysis was carried out in 3.0 min and the matrix matched calibration curves in the range of 0.508 ng/mL to 25.144 ng/mL were used for quantification with the correlation
coefficients demonstrating good linearity (0.994-0.999). The mean extraction recoveries for phenel-zine and IS from plasma were 96.5 % and 95.3% re-spectively. Matrix based samples were stable at room temperature for 12 hrs, processed samples were stable at least for 28 hrs and also stable at six freeze-thaw cycles. This method was successfully applied for determination of phenelzine in human plasma for pharmacokinetic study.
Keywords: Phenelzine, human plasma, UPLC, LC-MS/MS, solid Phase extraction, validation.
1.
Introduction
Phenelzine is a potent, long-term non-selective mo-noamine oxidase inhibitor (MAOI) [1-4]. Phenel-zine is a hydraPhenel-zine derivative and clinically used in the treatment of social phobia, panic disorder and depression, particularly depression associated with anxiety [5-8]. It has a molecular weight of 136.19 g/mol and is chemically described as C8 H12 N2 . Phenelzine increases brain levels of dopamine, no-repinephrine, and serotonin [1,2]. Interestingly, Phenelzine also produces large increases in brain levels of the amino acid GABA [2–4, 9, 10], an effect that appears to be related to the anxiolytic proper-ties of PLZ [11].
A mean peak plasma concentration (Cmax) of 19.8 ng/mL occurred at a time (Tmax) of 43 minutes post dose after a single 30 mg dose of phenelzine sul-fate(2 X 15 mg tablets) [12-13]. phenelzine sulfate is extensively metabolized, primarily by oxidation via monoamine oxidase. After oral administration of 13C6-phenelzine, 73% of the administered dose was recovered in urine as phenylacetic acid and parahy-droxyphenylacetic acid within 96 hours [12-13]. The mean elimination half-life after a single 30 mg dose is 11.6 hours. Multiple dose pharmacokinetics has not been studied in humans [12-13].
Urine[18], fluorescence detection for Brain tissue [19] and LC-MS/MS detection in Hair samples [20] . To the best of our knowledge, no LC-MS/MS me-thods have been reported for quantification of phe-nelzine in human plasma yet. To achieve the goal, the sensitive LC-MS/MS method was developed and validated for determination of phenelzine in human plasma. The method was successfully applied to analyze human plasma samples collected from a pharmacokinetic study.
This paper describes the development and valida-tion of selective and sensitive reverse-phased UPLC method with tandem mass spectrometry (MS/MS) detection for determination of phenelzine in human plasma after solid phase extraction by using hy-droxyzine dihydrochloride as internal standard. The applicability of this method for health human pharmacokinetic study was evaluated as well.
2.
Materials And Methods
2.1 Chemicals and reagents
Phenelzine sulphate, Hydroxyzine dihydrochloride and Ammonium Acetate were purchased from Sig-ma-Aldrich Chemicals. Methanol was obtained from JT Baker (LC-MS grade). Ortho Phosphoric Acid was obtained from Progressive Laboratories. Hydrochloric acid (35% Pure, AR grade) obtained from continental chemicals. Pentafluoro benzalde-hyde (HPLC grade) obtained from R&D chemicals. Strata-X SPE cartridges obtained from Phenomenex Inc.) and water (LC-MS grade) were purchased from Fisher Chemicals.
2.2 Data processing
A Waters Acquity UPLC system (Solvent manager, Degasser and Auto sampler) with a column oven was coupled with an API-4000 mass spectrometry (Applied Bio Systems) [20-25]. Chromatograms were acquired on a API-4000 tandem mass spectro-metry equipped with Electrospray ionization (ESI) and connected to a PC run with the standard Ana-lyst software. Mass spectroscopic detection [26-30] was performed on a Triple quadrapole instrument (API-4000, Applied Bio Systems). The calibration curve is constructed by weighted 1/x2 least-square
linear regression analysis of the peak area ratio (drug/ISTD) vs. the concentration of drug [31-32].
2.3. Standard solutions preparation 2.3.1. Stock solution preparation
Approximately 2 mg of Phenelzine / 2 mg of
hy-droxyzine (IS) working standard is weighed and transferred to 10.0 mL volumetric flask, to this 5.0 mL of methanol: water (5:5) is added and sonicated to aid dissolution and the final volume is made up with methanol: water (5:5).
2.3.2. Preparation of internal standard dilution
The Hydroxyzine internal standard (IS) dilution of about 25 ng/mL from the ISTD stock solution (IS stock) using (methanol: water (5:5)) as the diluent is prepared.
2.3.3. Preparation of calibration curve (CC) stan-dards and quality control (QC) samples
Appropriate dilutions of the stock solutions with diluent were made subsequently in order to prepare the working standard solution in the range of 25.185 ng/mL to 1257.246 ng/mL for phenelzine. All the solutions were stored in a refrigerator between 2°C and 8°C. Calibration standards and quality control samples, in the range of 0.508 ng/mL to 25.144 ng/mL were prepared for calibration. Accuracy and precision, quality control and stability assessment was done by spiking 0.5mL of drug free plasma with appropriate volume of working solution.
2.4. Solutions used for UPLC chromatographic separation
Pure methanol is used in pump A, 5 mM ammo-nium acetate buffer is used in pump B, and washing solution in the ratio of 80:20 Methanol: Water is employed in pump C.
2.5. Sample preparation
phase (A-methanol and B-5mM ammonium acetate (A:B=90:10)) and centrifuged at 4,000rpm for 5 min. Then, 10 µL aliquot was injected on to the LC-MS/MS system. For optimal stability, the auto-sampler temperature was set at 5 ˚C.
3. Results and discussion
3.1. Chromatographic and mass spectrometric con-ditions
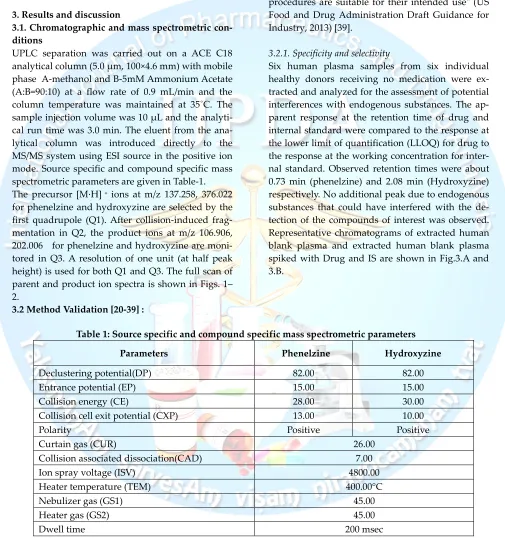
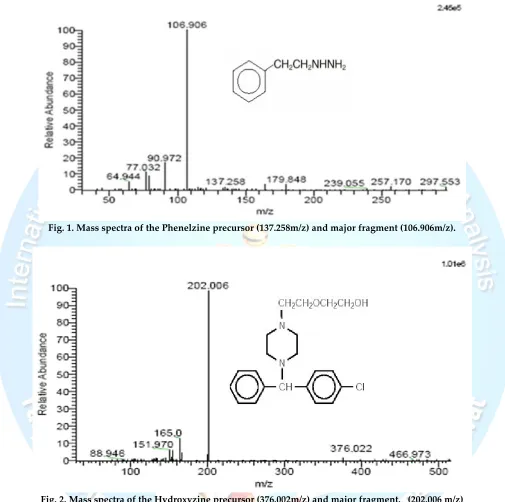
UPLC separation was carried out on a ACE C18 analytical column (5.0 µm, 100×4.6 mm) with mobile phase A-methanol and B-5mM Ammonium Acetate (A:B=90:10) at a flow rate of 0.9 mL/min and the column temperature was maintained at 35˚C. The sample injection volume was 10 µL and the analyti-cal run time was 3.0 min. The eluent from the ana-lytical column was introduced directly to the MS/MS system using ESI source in the positive ion mode. Source specific and compound specific mass spectrometric parameters are given in Table-1. The precursor [M·H] + ions at m/z 137.258, 376.022
for phenelzine and hydroxyzine are selected by the first quadrupole (Q1). After collision-induced frag-mentation in Q2, the product ions at m/z 106.906, 202.006 for phenelzine and hydroxyzine are moni-tored in Q3. A resolution of one unit (at half peak height) is used for both Q1 and Q3. The full scan of parent and product ion spectra is shown in Figs. 1– 2.
3.2 Method Validation [20-39]:
The objective of validation of an analytical proce-dure is to demonstrate that it is suitable for its in-tended purpose" (International Conference on Har-monization Guideline Q2A)[38] "Methods valida-tion is the process of demonstrating that analytical procedures are suitable for their intended use" (US Food and Drug Administration Draft Guidance for Industry, 2013) [39].
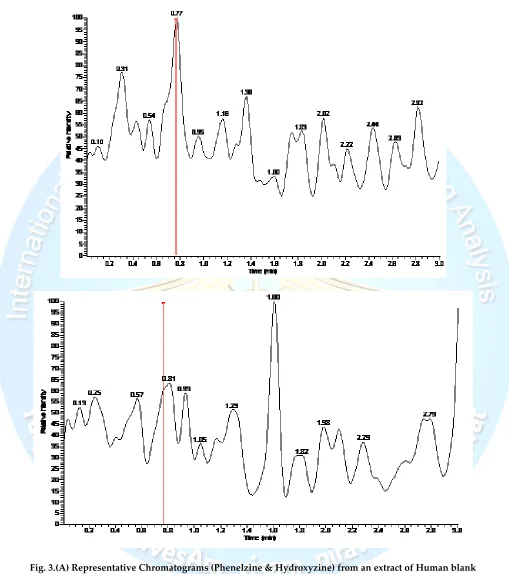
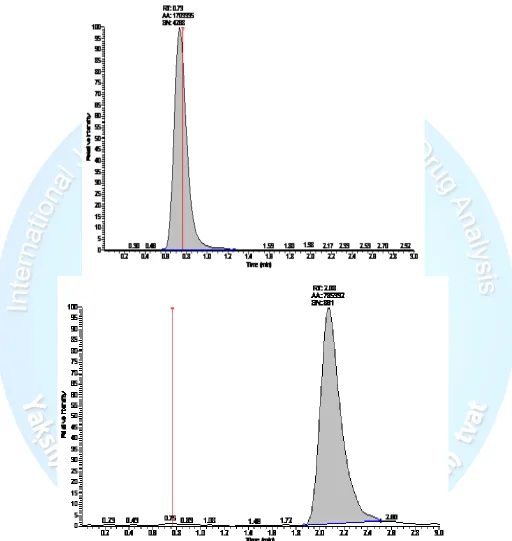
3.2.1. Specificity and selectivity
Six human plasma samples from six individual healthy donors receiving no medication were ex-tracted and analyzed for the assessment of potential interferences with endogenous substances. The ap-parent response at the retention time of drug and internal standard were compared to the response at the lower limit of quantification (LLOQ) for drug to the response at the working concentration for inter-nal standard. Observed retention times were about 0.73 min (phenelzine) and 2.08 min (Hydroxyzine) respectively. No additional peak due to endogenous substances that could have interfered with the de-tection of the compounds of interest was observed. Representative chromatograms of extracted human blank plasma and extracted human blank plasma spiked with Drug and IS are shown in Fig.3.A and 3.B.
Table 1: Source specific and compound specific mass spectrometric parameters
Parameters Phenelzine Hydroxyzine
Declustering potential(DP) 82.00 82.00
Entrance potential (EP) 15.00 15.00
Collision energy (CE) 28.00 30.00
Collision cell exit potential (CXP) 13.00 10.00
Polarity Positive Positive
Curtain gas (CUR) 26.00
Collision associated dissociation(CAD) 7.00
Ion spray voltage (ISV) 4800.00
Heater temperature (TEM) 400.00°C
Nebulizer gas (GS1) 45.00
Heater gas (GS2) 45.00
Fig. 1. Mass spectra of the Phenelzine precursor (137.258m/z) and major fragment (106.906m/z).
Fig. 3.(B) Representative Chromatograms (Phenelzine & Hydroxyzine) from an extract human blank plasma spiked with Phenelzine and Hydroxyzine (as IS)
3.2.2. Linearity
Linearity means that the assay provides test results that are proportional to the concentration of the analyte in the sample with directly or via a
constructed by weighted 1/x2 of the peak area ratio
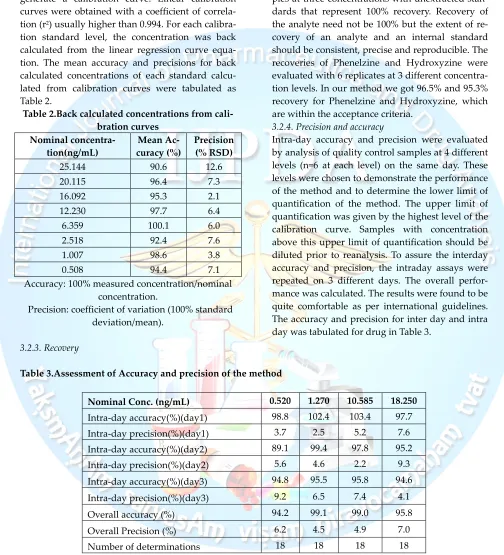
(drug/IS) with the above calibration standards to generate a calibration curve. Linear calibration curves were obtained with a coefficient of correla-tion (r2) usually higher than 0.994. For each
calibra-tion standard level, the concentracalibra-tion was back calculated from the linear regression curve equa-tion. The mean accuracy and precisions for back calculated concentrations of each standard calcu-lated from calibration curves were tabucalcu-lated as Table 2.
Table 2.Back calculated concentrations from cali-bration curves
Nominal concentra-tion(ng/mL)
Mean Ac-curacy (%)
Precision (% RSD)
25.144 90.6 12.6
20.115 96.4 7.3
16.092 95.3 2.1
12.230 97.7 6.4
6.359 100.1 6.0
2.518 92.4 7.6
1.007 98.6 3.8
0.508 94.4 7.1
Accuracy: 100% measured concentration/nominal concentration.
Precision: coefficient of variation (100% standard deviation/mean).
3.2.3. Recovery
Recovery experiments should be performed by comparing the analytical results for extracted sam-ples at three concentrations with unextracted stan-dards that represent 100% recovery. Recovery of the analyte need not be 100% but the extent of re-covery of an analyte and an internal standard should be consistent, precise and reproducible. The recoveries of Phenelzine and Hydroxyzine were evaluated with 6 replicates at 3 different concentra-tion levels. In our method we got 96.5% and 95.3% recovery for Phenelzine and Hydroxyzine, which are within the acceptance criteria.
3.2.4. Precision and accuracy
Intra-day accuracy and precision were evaluated by analysis of quality control samples at 4 different levels (n=6 at each level) on the same day. These levels were chosen to demonstrate the performance of the method and to determine the lower limit of quantification of the method. The upper limit of quantification was given by the highest level of the calibration curve. Samples with concentration above this upper limit of quantification should be diluted prior to reanalysis. To assure the interday accuracy and precision, the intraday assays were repeated on 3 different days. The overall perfor-mance was calculated. The results were found to be quite comfortable as per international guidelines. The accuracy and precision for inter day and intra day was tabulated for drug in Table 3.
Table 3.Assessment of Accuracy and precision of the method
Nominal Conc. (ng/mL) 0.520 1.270 10.585 18.250
Intra-day accuracy(%)(day1) 98.8 102.4 103.4 97.7
Intra-day precision(%)(day1) 3.7 2.5 5.2 7.6
Intra-day accuracy(%)(day2) 89.1 99.4 97.8 95.2
Intra-day precision(%)(day2) 5.6 4.6 2.2 9.3
Intra-day accuracy(%)(day3) 94.8 95.5 95.8 94.6
Intra-day precision(%)(day3) 9.2 6.5 7.4 4.1
Overall accuracy (%) 94.2 99.1 99.0 95.8
Overall Precision (%) 6.2 4.5 4.9 7.0
Table 4.Stability results
Nominal Conc. (ng/mL) 18.250 1.270
Precision Accuracy Precision Accuracy
Freeze thaw stability 5.7 96.1 9.5 98.4
Bench top stability 4.3 102.2 3.5 104.2
Wet extract stability at room temperature 2.1 109.4 6.0 93.5
Wet extract stability at 2-8ºC 6.9 97.4 4.8 102.7
Auto sampler stability 3.9 107.7 2.5 108.7
Long term stability 4.7 105.8 7.0 93.1
Interim storage stability at -25 °C 3.0 104.1 7.7 104.0
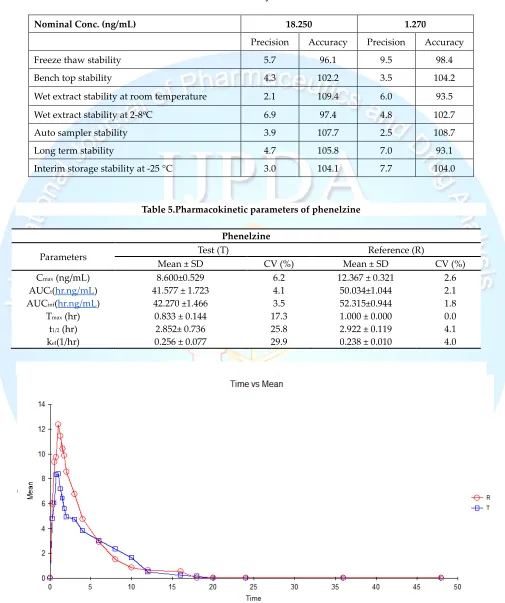
Table 5.Pharmacokinetic parameters of phenelzine
Phenelzine
Parameters Test (T) Reference (R)
Mean ± SD CV (%) Mean ± SD CV (%)
Cmax (ng/mL) 8.600±0.529 6.2 12.367 ± 0.321 2.6
AUCt(hr.ng/mL) 41.577 ± 1.723 4.1 50.034±1.044 2.1
AUCinf(hr.ng/mL) 42.270 ±1.466 3.5 52.315±0.944 1.8
Tmax (hr) 0.833 ± 0.144 17.3 1.000 ± 0.000 0.0
t1/2 (hr) 2.852± 0.736 25.8 2.922 ± 0.119 4.1
kel(1/hr) 0.256 ± 0.077 29.9 0.238 ± 0.010 4.0
3.2.5. Stability
According to FDA guidelines for industry effect of freeze–thaw, bench top, short-term, long-term, stock solution and post preparative stability as-sessments are evaluated as a part of bioanalytical method validation. In our study quality control plasma samples are used subject to bench top (12h), Auto injector (10–84 h), freeze–thaw (-80 to +20 °C) cycles, wet extract (28 h) at room tempera-ture, wet extract at 2-8°C (48h) and long term ( 90 days) at deep freezer (at -80 °C) tests are per-formed. The values obtained for present stability studies are tabulated (Table 4), which are within the acceptance criteria.
3.3. Application of the method
The present method was applied for a randomized cross-over bioequivalence study of two different Phenelzine preparations in 24 healthy male volun-teers. After single oral administration of the drug blood samples were collected at a suitable time intervals up to 48 hours. This method was success-fully used to measure the plasma concentrations of Phenelzine. Various Pharmacokinetic parameters established and compared for the both of the prep-arations were given in Table 5. Plasma concentra-tion- time profiles were given as graph (Figure 4.).
4.0 Conclusion
To our knowledge, this is the first fully validated LC–MS/MS method for quantification of phenel-zine in human plasma. The method was applied successfully to the analysis of plasma samples ob-tained for pharmacokinetic, bioavailability or bioe-quivalence study after therapeutic doses of phenel-zine.The established LC-MS/MS method is sensi-tive and suitable for the study of phenelzine in human plasma. Because of the relative short chro-matographic runtime (3.0 min), the method is easy to follow and can be adopted for clinical drug monitoring.
REFERENCES
1. McKenna KF, Baker GB, Coutts RT.,
N2-Acetylphenelzine: effects on rat brain GABA, alanine, and biogenic amines. Naunyn Schmie-debergs Arch Pharmacol, 343( 1991), pp. 478– 82.
2. Parent MB, Habib MK, Baker GB.,
Time-dependent changes in brain monoamine
oxi-dase activity and in brain levels of monoamines and amino acids following acute administration of the antidepressant/ antipanic drug phenel-zine, Biochem Pharmacol, 59( 2000), pp.1253– 63.
3. Marise B. Parent, Sangeeta Master, Shauna
Kashlub, Glen B. Baker, Effects of the antide-pressant/antipanic drug phenelzine and its put-ative metabolite phenylethylidenehydrazine on extracellular ᵞ-aminobutyric acid levels in the striatum, Biochemical Pharmacology, 63 (2002), pp. 57–64.
4. Popov N, Matthies H., Some effects of monoa-mine oxidase inhibitors on the metabolism of ᵞ-aminobutyric acid in rat brain., J Neurochem , 16(1969), pp. 899–907.
5. Keck PE, McElroy SL., New uses for
antide-pressants: social phobia., J Clin Psychiatry, 58(1997), 32–8.
6. Dassylva B, Fontaine R., Atypical depression: evolution toward a specific pharmacologic and efficacious treatment?, Can J Psychiatry, 40( 1995), pp.102–8.
7. Ashok RB, Sheehan DV., Somatic treatment
strategies in panic disorder. In: Asnis GM, Van Praag HM, editors. Panic disorder. Clinical, bio-logical, and treatment aspects., New York: Wi-ley, 1995, pp. 279– 313.
8. Johnson MR, Lydiard RB, Ballenger JC. MAOIs
in panic disorder and agoraphobia. In: Kenne-dy FH, editor. Clinical advances in monoamine oxidase inhibitor therapies Washington: Ameri-can Psychiatric Institute, 1994, pp. 205–224.
9. Baker GB, Wong JTF, Yeung JM, Coutts RT.,
Effects of the antidepressant phenelzine on brain levels of ᵞ-aminobutyric acid (GABA)., J Affect Disord, 21( 1991), pp.207–11.
10. Parent MB, Habib MK, Baker GB.,
Task-dependent effects of the
antidepres-sant/antipanic drug phenelzine on memory, Psychopharmacology,142( 1999), pp.280–8.
11. Paslawski T, Treit D, Baker GB, George M,
Coutts RT., The antidepressant drug phenelzine produces antianxiety effects in the plusmaze and increases in rat brain GABA., Psychophar-macology, 127( 1996), pp.19–24
12. Nardil(phenelzine sulfate) Tablets, USP,
13. Nardil(phenelzine sulfate) Tablets, USP, http://www.pfizer.com/files/products/uspi_nar dil.pdf.
14. T.S. Rao, G.B. Baker, R.T. Coutts, J.M. Yeung, G.J.A. McIntosh, G.A., Analysis of the antide-pressant phenelzine in brain tissue and urine using electron-capture gas chromatography, Journal of Pharmacological Methods, Volume 17, Issue 4, July 1987, Pages 297–304.
15. Satya P. Jindal, Theresa Lutz, Thomas B.
Coop-er, Determination of phenelzine in human plasma with gas chromatography—mass spec-trometry using an isotope labeled internal standard, Journal of Chromatography B: Bio-medical Sciences and Applications, Volume 221, Issue 2, 12 December 1980, Pages 301–308.
16. Mark Lichtenwalner, Matthew McMullin,
Don-na Hardy and Fredric Rieders , Quantitative Determination of Phenelzine in Human Fluids by Gas Chromatography with Nitrogen Specific Detection, Journal of Analytical Toxicology, Vo-lume 12, Issue 2, Pp. 98-101.
17. I. J., McGilveray, S. Sved, D. L. Wilson andN. Beaudoin, Determination Of Phenelzine Plasma Concentrations In Piglet And Man, Journal of Pharmacy and Pharmacology, Volume 34, Issue S12, page 98P, December 1982
18. B.K. Logan and D.T. Stafford, Rapid Screening for 100 Basic Drugs and Metabolites in Urine Using Cation Exchange Solid-Phase Extraction and High-Performance Liquid Chromatogra-phy with Diode Array Detection, Journal of Analytical Toxicology, Vol. 14, May/June 1990.
19. Marise B. Parenta, Sangeeta Master, Shauna
Kashlua, Glen B. Baker, Effects of the antide-pressant/antipanic drug phenelzine and its put-ative metabolite phenylethylidenehydrazine on extracellular-aminobutyric acid levels in the striatum, Biochemical Pharmacology, 63 (2002), 57–64.
20. Raghunadha Reddy S, Koteswara Rao.Divi, I.
Sarath Chandiran, K.N. Jayaveera, Y.K. Naidu, M.P. Kalyan Reddy. Development and valida-tion of high-throughput liquid chromatogra-phy–tandem mass spectrometric method for simultaneous quantification of Clopidogrel and its metabolite in human plasma, Journal of Chromatography B, Elsevier Publications, Feb-ruary- 2010, volume-878, Issue:3-4, pages:502– 508, Impact factor-2.977, ISSN: 1570-0232.
21. Y.K.N, Raghunadha Reddy Seelam, Koteswara
Rao Divi, Penchala Kalyan Reddy Mule, Sarath Chandiran I and Jayaveera K N. Simultaneous Quantification of Alverine And Its Metabolite P-Hydroxy Alverine In Human Plasma With Robotic Liquid-Liquid Extraction By Using Ful-ly Validated LC-MS/MS and Its Application To A Bioequivalence Study, Journal Of Pharmacy Research, 2010, Volume-3, Issue-6, Page-1407-1411, Impact Factor-1.5, ISSN: 0974-6943.
22. Raghunadha Reddy.S, Koteswara Rao.Divi,
I.Sarath chandiran and K.N. Jayaveera. Quanti-fication of Artemether in human plasma with liquid- liquid extraction by using fully vali-dated high performance liquid Chromatogra-phy–Tandem mass spectrometric method, Journal of Pharmacy Research, August-2010, Voumel-3, Issue-8, Impact Factor-1.5, ISSN: 0974-6943.
23. I.Sarath Chandiran, K. N. Jayaveera and Rag-hunadha Reddy. S., High-Throughput Liquid Chromatography–Tandem Mass Spectrometric Method for Simultaneous Quantification of Carvedilol and Its Metabolite 4-Hydroxyphenyl Carvedilol in Human Plasma and Its Applica-tion to Bioequivalence Study, Journal of Chemi-cal and PharmaceutiChemi-cal Research, , 2011,
3[2]:341-353, ISSN No: 0975-7384,
CO-DEN[USA]: JCPRC5.
24. I.Sarath Chandiran, K. N. Jayaveera and Ragu-nadha Reddy. S. Development and Validation of High-Throughput Liquid Chromatography-Tandem Mass Spectrometric Method for Quan-tification of Itraconazole and its Metabolite in Human Plasma. Scholars Research Library, Der Pharmacia Lettre, 2011, 3[2]: 316-328.
25. I.Sarath Chandiran K.N. Jayaveera and
Raghu-nadha Reddy.S, Pharmacokinetic and Bioequi-valence Comparison Between Extended Release Capsules of Venlafaxine Hydrochloride 150mg: An Open Label, Balanced, Randomized-Sequence, Single-Dose, Two-Period Crossover Study In Healthy Indian Male Volunteers, In-ternational Research Journal Of Pharmacy [IRJP], 2[3], 2011,262-269, ISSN 2230-8407. 26. Raghunadha Reddy. S, I. Sarath Chandiran, K.
method and its applications in pharmacokinet-ics, Journal of Chemical and Pharmaceutical Research, 2010, volume-2, issue-3, Pages:59-69 and ISSN No: 0975-7384.
27. Raghunadha Reddy Seelam, Sarath Chandiran
I, Koteswara Rao Divi, Jayaveera K. N., Devel-opment and Validation of High Performance Liquid Chromatography-Tandem Mass Spec-trometric Method for Simultaneous Quantifica-tion of Telmisartan in Human Plasma, Interna-tional journal of pharmaceutical sciences and Drug Research, 2010, Volume-2, Issue-3, Pages: 188-192 and ISSN No: 0975-248X.
28. Raghunadha Reddy.S, I.Sarath chandiran, K.N.
Jayaveera and Koteswara Rao.Divi. Quantifica-tion of ibuprofen in human plasma by using high throughput liquid chromatography– tandem mass spectrometric method and its ap-plications in pharmacokinetics, scholars re-search library, archives of applied rere-search, 2010, volume-2, issue-3, pages-101-111, ISSN-0975-508x,coden[USA] AASRC9.
29. Raghunadha Reddy.S, Koteswara Rao.Divi,
Y.K.Naidu, I.Sarath Chandiran, k.N. Jayaveera and M.P.Kalyan Reddy. Development and vali-dation of high-performance liquid chromato-graphy tandem mass spectrometric method for quantification of Clonidine in human plasma, journal of chemical and pharmaceutical sciences, April - June’2010, volume-3, issue-2.
30. Raghunadha Reddy.S, M.P. Kalyan Reddy,
Y.K.Naidu, Koteswara Rao.Divi, I.Sarath Chan-diran and K.N. Jayaveera. Development and Validation of High Performance Liquid Chro-matography–Tandem Mass Spectrometric Me-thod for Quantification of Lumefantrine in Human Plasma with Precipitation, Internation-al JournInternation-al of Pharma Research and Develop-ment [IJPRD], Apr -2010, Volume-2, Issue-2, Page-1-9 and ISSN: 0974 – 9446.
31. Y.K.N, Raghunadha Reddy S., Koteswara Rao
Divi, M.P. Kalyan Reddy, I. Sarath Chandiran and K.N. Jayaveera. Quantification of Levetira-cetam in Human Plasma with Precipitation Ex-traction by Using Fully Validated LC-MS/MS and Its Application to a Bioequivalence Study, Research J. Pharm. and Tech., July-Sept 2010, Volume-3, Issue-3, and Page: 847-853 and ISSN: 0974-3618.
32. S.Raghunadha Reddy, Pobba Rajani,
Koteswa-rarao. Divi, YK Naidu, Sarath Chandiran I and MP Kalyan Reddy. Anti- inflammatory and analgesic activity of Smilax chinensis, Research Journal of Pharmaceutical, Biological and Chemical Sciences, April – June 2010, Volume-1, Issue-2, Pages: 1-8, ISSN: 0975-8585.
33. Kalyan Reddy MP, Jaya Chandra Reddy P,
Rag-hunadha Reddy S, Jayaveera KN. Development and validation of bio-analytical method for Quantification of Pantoprazole in human plas-ma using LC-MS/MS, Journal of Pharplas-macy and Chemistry, July - September 2010,Volume-4, Is-sue-3, Pages:80-86 and ISSN No: 0973-9874.
34. Raghunadha Reddy S, Naidu YK, Koteswara
Rao Divi, Ravikiran V, Sandhya Rani Y, Kalyan Reddy MP. Development and Validation of High Performance Liquid Chromatography Tandem Mass Spectrometric Method for Quan-tification of Aceclofenac in Human Plasma, Journal of Pharmacy and Chemistry, July - Sep-tember 2010, Volume-4, Issue-3, Pages:89-95 and ISSN No: 0973-9874.
35. Mahitej Yadav Katteboina, Nageswara Rao
Pilli, Ramesh Mullangi, Raghunadha Reddy Seelam and Shobha Rani Satla, LC-MS/MS as-say for the determination of lurasidone and its active metabolite, ID-14283 in human plasma and its application to a clinical pharmacokinetic study, 10 November 2015, Biomed. Chromatogr.
36. I. Sarath Chandiran, Raghunadha Reddy
See-lam, Seelam Sai Satyanaraya Reddy, Ravindra Reddy S, Bioequivalence and Pharmacokinetic Comparison between Extended Release Cap-sules of Carvedilol Phosphate 40mg: An Open Label, Balanced, Randomized- Sequence, Sin-gle-Dose, Two-Period Crossover Study in Healthy Male Volunteers, International Journal of Medicine and Pharmaceutical Research, 2015, 3(4): 1105–1114.
37. Raghunadha R Seelam, Sarath C Irisappan,
Ravindra R Seelam, Sai SR Seelam, Bioequiva-lence comparison between two different For-mulations of alverine citrate 120mg capsules: an open Label, balanced, randomized-sequence, single-dose, two period Crossover study in healthy male volunteers, Journal of Compre-hensive Pharmacy, 2015, 2(3), 105-114.
38. ICH Q2A: Validation of Analytical Procedures.
Ad-ministration web site. Available at: http://http://www.fda.gov/cder/guidance/ichq2 a.pdf.
39. Guidance for Industry: Bioanalytical Method
Validation; Draft Guidance. Rockville, MD: US FDA; 2013. Available at:
http://www.fda.gov/downloads/drugs/guidanc