Seismic Profile Texture Feature Extraction
Algorithm Merged Directional Derivative into
GLCM Method
Tianshi LiuSchool of Computer Science, Xi’an Shiyou University, Xi’an, China [email protected]
Minmin Xiao
School of Computer Science, Xi’an Shiyou University, Xi’an, China [email protected]
Abstract—In view of the texture direction suppression problem of seismic profile, this paper proposes a new texture feature extraction algorithm merged directional derivative into GLCM method. The algorithm introduces the weight factor by utilizing the directional derivative of the seismic profile. Moreover, the Haralick texture features such as ASM, contrast, entropy and IDM are extracted based on the GLCM method. Then, the ultimate feature set is extracted by merging the Haralick texture features and weight factor together. The experimental results show that the proposed algorithm can extract more accurate seismic profile feature set and avoid successfully the texture direction suppression problem of seismic profile. The ability of profile identification and segmentation has a certain improved compared with the GLCM method.
Index Terms—seismic profile, feature extraction, directional derivative, gray level co-occurrence matrix, Haralick texture feature, weight factor
I. INTRODUCTION
Traditionally, the seismic profile is interpreted manually, which has largely subjective and one-sided. With the increase of the data needs to be processed, the manual interpretation is far cannot meet the requirement of seismic data processing. The seismic profile has typical texture feature, and the different texture region represent different geological body. The region where has a mutation of the texture direction or structure is a mutation of the geological structure. Therefore, from the point of natural texture, it is reasonable to specifically analyze the seismic profile data by texture feature. Furthermore, the extracting texture feature of the seismic profile is a basis of the geological structure research.
At present, the researches of tectonic feature, seismic facies and reservoir prediction have made a series of achievement by using seismic texture technology [1-5]. Reference [6] used the texture processing technology to describe and predict reservoir parameters, and for further research into reservoir lithology. Reference [7] suggested firstly an optimization method and a criterion for
constructing the GLCM (Gray Level Co-occurrence Matrix) of the seismic texture coherence algorithm. Reference [8] utilized GLCM method to extract texture feature of the seismic profile and fuzzy k-means clustering algorithm to classify features effectively. It achieved the identification of geological target bodies. Reference [9] discussed the realization method of the amplitude co-occurrence matrix and the choice of time-space window parameters of the seismic profile. Reference [10] used directional derivative to achieve the identification of the texture image. Reference [11] proposed a new texture feature extraction method fused with LBP (local binary pattern) and GLCM. Seismic texture attributes contribute to the interpretation of seismogeology, but their capability of identifying small faults, stratigraphic discontinuity, channel and body distribution and other phenomena is not as good as coherence volume [12,13]. Reference [14] shown that a self-organizing map (SOM) algorithm was utilized to analyze 3-D data volume of seismic texture attributes based on a GLCM and to study the distribution laws of channel sand bodies.
However, the quality of the extracted feature is very important for the ultimate research when the seismic profile is analyzed by using texture feature. Generally, in order to weaken the influence of the direction feature for the result, the average and variance of texture feature of four angles 0°, 45°, 90°, and 135° are used as final texture feature. Nevertheless, if the average of texture feature of four angles is directly calculated, the texture direction will be ignored and the feature of the image will be weakened in a certain extent. Therefore, this paper proposes a new seismic profile texture feature extraction algorithm merged directional derivative into GLCM method. The proposed algorithm can update the proportion of the texture feature of each angle based on the direction feature and weight factor. Besides that, it can provide more specific, more accurate feature set for further research and also can better represent the profile.
Considering the regional of texture on the macroscopic, this paper utilizes the GLCM method to count texture feature of the seismic profile. In order to capture the subtle change of the texture, it utilizes directional derivative to describe direction feature of the seismic profile by counting the rate of the change of pixel and neighbor pixels. The final feature set is extracted by merging the direction feature on the microscopic into the texture feature on the macroscopic.
A. GLCM Method
GLCM is a method of counting the distribution of the gray level. Essentially, it counts the frequency of a pair of gray level in a certain distance. Haralick et al. computed a set of gray level spatial dependence probability distribution matrices and proposed 14 textural features which can be extracted from each of these matrices [15]. The matrix of relative frequencies p i j d( , , , )θ with
which two neighbor resolution cells separated by distance ‘d’ occur on the image, one with gray level ‘i’ and the other with gray level ‘j’. Formally, for angles quantized to 45° intervals the unnormalized frequencies are defined by [15]
( , , ,0 ) #{[( , ),( , )]| 0,| | } ( , , ,45 ) #{[( , ),( , )]| ( , )
( , )}
( , , ,90 ) #{[( , ),( , )]|| | , 0} ( , , ,135 ) #{[( , ),( , )]| ( , )
( ,
p i j d k l m n k m l n d
p i j d k l m n k m d l n d
or k m d l n d
p i j d k l m n k m d l n
p i j d k l m n k m d l n d
or k m d l
= − = − =
= − = − = − − = − − =
= − = − = = − = − − = −
− =
D
D
D
D
)}
n d
⎧ ⎪ ⎪ ⎪⎪ ⎨ ⎪ ⎪ ⎪
− =
⎪⎩
.
(1) Where ‘#’ denotes is the number of elements in the set. B. Directional Derivative
Directional derivative can count the change laws of the gray level of pixel in all directions and also can reflect the direction feature of each gray level of pixel. Assuming
( )
i j, is a point of the image which size is N M× and( )
i j, is the center of the 7×7 sliding window. The window is shown in Fig.1. Where{
d k k( ) | =1,...,12}
is the directional derivative set of 12 angles.Figure 1. 7×7 cells of mix of higher-order directional derivative
C. Texture Feature Extraction Algorithm of Seismic Profile
1) Selection of seismic profile texture feature
For the seismic profile, the combination of different feature represents different information:
(1) For the ASM (Angular Second Moment), higher value shows that the values of this region are inhomogeneous and the texture is coarser. For the seismic image, it shows good porosity and its structure is more complex.
(2) There are higher entropy, lower energy, and low and medium values of contrast and IDM (Inverse Difference Moment), it can be inferred that there are a certain seismic facies and sedimentary facies in the region for the seismic image.
(3) The combination of higher entropy and lower IDM shows that there are random values and the local change is very fast in the region. For the seismic image, it indicates that the region is a complex geological structure and may contain oil and gas resources.
Through the above analysis, the Haralick features such as ASM, contrast, entropy and IDM are closely related to the seismic profile information. Therefore, this paper extracts the four features to describe the seismic profile. The corresponding computation formulas are as follows [15]:
(1) ASM
2
1 1 ( , , , )
L L
i j
Aθ p i j d θ
= =
=
∑∑
. (2)(2) Contrast
2 2
1 1[( ) ( , , , )]
L L
i j
CONθ i j p i j dθ
= =
=
∑∑
− . (3)(3) Entropy
1 1
( , )lg ( , , , )
L L
i j
ENTθ p i j p i j d θ
= =
= −
∑∑
. (4)(4) IDM
2 1 1
( , , , ) 1 ( )
L L
i j
p i j d HOM
i j
θ θ
= =
=
+ −
∑∑
. (5)2) Merger of Haralick texture feature and direction feature
In order to solve the direction suppression problem of the texture, a definition is proposed. Haralick texture feature of the seismic profile are A45 ( 1)Dt− , CON45 ( 1)Dt− ,
45 ( 1)t
ENT −
D , HOM45 ( 1)Dt− . Weight factor is ω( )t .
Directional derivative is d t(3 2)− , merging the directional derivative into Haralick texture feature vector is defined by
(A CON ENT HOM)=
(
4 4 4 4)
45 ( 1) 45 ( 1) 45 ( 1) 45 ( 1)
1 ( ) t 1 ( ) t 1 ( ) t 1 ( ) t
t=ωt A − t=ωt CON − t=ωt ENT − t=ωt HOM −
∑ D ∑ D ∑ D ∑ D ,
4
1 4
1
1 1
( ) 1
( (3t 2))
( (3t 2)) 1,2,3,4; 0
( ) 1
t t t d d t t α α ω α ω = = ⎧ = × ⎪ − ⎪⎪ − = > ⎨ ⎪ ⎪ = ⎪⎩
∑
∑
, (7) Where A45 ( 1)Dt− =A0D and (3d t−2)=d(1) whent
=
1
.0
AD is the value of ASM and d(1) is the value of
directional derivative when angleθ =0D respectively.
Similarly, A45D , d(4), A90D , d(7), A135D , d(10) can be
obtained.
(1)
d , d(4), d(7) and d(10) are shown in Fig.1. Formally, from the aspect of difference, the direction feature d(1), d(4), d(7) and d(10)are defined by:
(
)
(
)
(
)
1 1
1 1
(1) | ( , 3) 6 ( , 2) 15 ( , 1) 20 ( , ) 15 ( , 1) 6 ( , 2) ( , 3)|
(4) | 3, 3 6 2, 2 15 1, 1 20 ( , ) 15 ( 1, 1) 6 ( 2, 2) ( 3, 3)| (7) | ( 3, ) 6 ( 2, )
N M
i j
N M
i j
d f i j f i j f i j f i j
f i j f i j f i j
d f i j f i j f i j
f i j f i j f i j f i j
d f i j f i j
= = = = = − − − + − − + + − + + + = + − − + − + + − − + − + − − + + − + = + − +
∑∑
∑∑
1 1 1 115 ( 1, ) 20 ( , ) 15 ( 1, ) 6 ( 2, ) ( 3, )|
(10) | ( 3, 3) 6 ( 2, 2) 15 ( 1, 1) 20 ( , ) 15 ( 1, 1) 6 ( 2, 2) ( 3, 3)|
N M
i j
N M
i j
f i j f i j
f i j f i j f i j
d f i j f i j f i j
f i j f i j f i j f i j
= = = = ⎧ ⎪ ⎪ ⎪ ⎪ ⎪ ⎪ ⎪ ⎪ ⎨ ⎪ + + − ⎪ ⎪ + − − − + − ⎪ ⎪ ⎪ = − − − − − + − − ⎪ ⎪ − + + + − + + + + + ⎩
∑∑
∑∑
, (8) Where the size of image is N M× and f i j( )
, is the graylevel value of the point
( )
i j, . 3) description of algorithm processIn order to describe the algorithm process more simply, several variables which can represent the complex and frequently-used expressions are defined. The corresponding relations of variables and expressions are shown in table I.
TABLE I
CORRESPONDING RELATIONS OF VARIABLES AND EXPRESSIONS
Variable (i=1,2,…,N, Expression
j=1,2,…,M) Variable
Expression (i=1,2,…,N, j=1,2,…,M)
Aij A(i,j) Aa Average(Sum(A(i,j)))
CONij CON(i,j) Acon Average(Sum(CON(i,j)))
ENTij ENT(i,j) Aent Average(Sum(ENT(i,j)))
HOMij HOM(i,j) Ahom Average(Sum(HOM(i,j)))
Input:
(1) 7×7 sliding window
(2) distance d =1 (3) gray-scale L =8
(4) angle θ =0D, 45D, 90D, 135D
(5) α= 2 Output:
(1) The texture feature set of the point (i, j):
(
)
{
45 ( 1) 45 ( 1) 45 ( 1) 45 ( 1)i j t t t t
FS A CON ENT HOM
− − − −
= D D D D
}
|t=1, 2,3,4 .
(2) The merged texture feature set of image :
(
)
{
i j i j i j i jFFS= A CON ENT HOM
}
|i=1,2,..., ,N j=1,2,...,M . (3) the final feature set of image :
(
)
{
2hom
( ij a) ij con ij ent i j
S= A −A CON −A ENT −A HOM −A
}
|i=1,2,..., ,N j=1,2,...,M . The algorithm process is as follow:
Step 1 : Use (1) to calculate the gray level co-occurrence matrixes of the sliding window and obtain four gray level co-occurrence matrixes ( , , , )p i j d θ .
Step 2 : Use (2)-(5) and gray level co-occurrence matrixes ( , , , )p i j dθ which are obtained from the step1 to calculate the Haralick texture feature such as ASM, entropy, contrast, and IDM. The texture feature set FSij can be obtained. Then the texture
feature set FSij is assigned to the center
( )
i j, of thesliding window. Similarly, traversing the entire seismic profile. The number of elements is 16 for the center
( )
i j, in the final set.Step 3 : Use (8) to calculate the direction feature of the sliding window center
( )
i j, when angleθ =0D, 45D,90D, 135D. Similarly, traversing the entire profile
and the directional derivative set
{
d (3t 2) | i 1,2,..., N, j 1,2,...,M, t 1,2,3,4ij − = = =}
isextracted. The number of elements is 4 for the center
( )
i j, in the set.Step 4 : Use (7) and the directional derivative set which is obtained from step3 to calculate the weight factor set
{
ωij(t) | i 1,2,..., N, j 1,2,...,M, t 1,2,3,4= = =}
when angle θ =0D,45D,90D,135D.
Step 5 : Based on the texture feature set which is obtained from step2 and the weight factor set which is extracted from step4, use (6) to extract the merged feature set. The feature set FFS can be extracted by traversing the entire profile.
Step 6 : Calculate Aa, Acon, Aent, and Ahom. Where Aa is the
average of A which is the ASM feature extracted from the entire seismic profile. Similarly, Acon, Aent,
and Ahom are the average of contrast, entropy, and
III. EXPERIMENTAL RESULTS
This paper selects the actual seismic profile to experiment. The seismic profile and the sub-profile are shown in Fig.2. The seismic profile is shown in Fig.2 (a) and the sub-profile is shown in Fig.2 (b). In Fig.2 (b), the X direction is the line direction and the Y direction is the direction of depth. Seismic profile texture consists of seismic texture element which is different from other general image texture. The sample point is shown the little black in square in Fig.2 (b) and its neighbors is shown the gray areas in Fig.2 (b).
(a) (b)
Figure 2. (a) Seismic profile image. (b) Seismic sub-profile
A. Selection of Sliding Window and Gray-scale
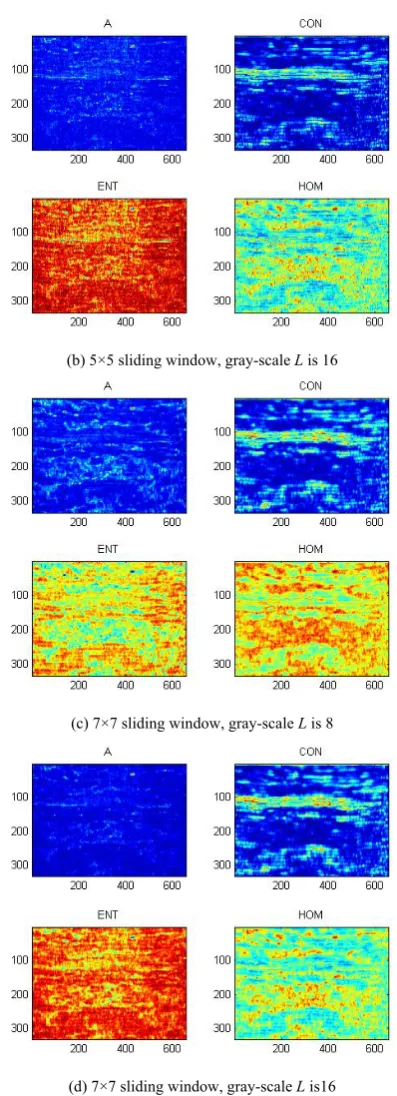
Actually, the selected sliding window is a seismic sub-profile. It also is a 2-D array which is composed of a finite number of pixels and small enough compared with the entire seismic profile. First, a pixel point which is the sampling point of the seismic profile should be selected. Then, a seismic sub-profile should be created based on the sampling point. Usually, the size of selected sliding window is 5×5 or 7×7.
There are informative for a 256 level gray image. Consequently, the image is usually compressed and the gray-scale is converted into 16 or 8 by the histogram method.
The optimal group of parameters can be selected based on the actual experiment. With the combination of different sliding window and gray-scale, feature images are shown in Fig.3. In Fig.3, A represents ASM, CON is Contrast, ENT is Entropy and HOM is IDM. Fig.3 (a) shows that the sliding window is 5×5 and the gray-scale L is 8. Fig.3 (b) shows that the sliding window is 5×5 and the gray-scale L is 16. Fig.3 (c) shows that the sliding window is 7×7 and the gray-scale L is 8. Fig.3 (d) shows that the sliding window is 7×7 and the gray-scale L is 16.
(a) 5×5 sliding window, gray-scale L is 8
(b) 5×5 sliding window, gray-scale L is 16
(c) 7×7 sliding window, gray-scale L is 8
(d) 7×7sliding window, gray-scale L is16
Figure 3. Feature images with different sliding window and gray-scale
From the Fig.3, it can be found that the third feature image is the clearest compared others. Consequently, the optimal group of parameters is 7×7 sliding window and gray-scale L = 8.
B. Directional Derivative and Weight Factor
other three direction values, the phenomenon that the texture of image has obvious directivity can be inferred. Otherwise, the distribution of the texture is uniform. The corresponding relations between directional derivative and weight factor with different ‘α’ are shown in Fig.4 and table II. When the directional derivative is the minimum value, the corresponding weight factor is the maximum one. In order to describe the feature more accurate and simpler, ‘α=2’ is selected. In Fig.4, it can be found that the weight factor which is the maximum one when ‘α =1’ is less than the weight factor which is the maximum one when ‘α =2’, whereas the weight factor which isn’t the maximum one when ‘α =1’ is greater than the weight factor which isn’t the maximum one when ‘α=2’.
Figure 4. Directional derivative and weight factor with different ‘α’
TABLE II
DIRECTIONAL DERIVATIVE AND WEIGHT FACTOR WITH DIFFERENT
‘α’
Direction Su
m
0° 45° 90° 135°
Derivative 195 15 225 255
Weight factor (α=1)
0.06397390
86803813 0.831660812844957 0.0554440541896638 0.0489212242849975 1 Weight
factor (α=2)
0.00583648
89118828 0.986366626108192 0.00438385167159197 0.00341303330833285 1 C. Merged Feature
The merged feature can accurately describe the entire seismic profile. The feature images of variance are shown in Fig.5. In the Fig.5, TSCON is the variance of contrast and TSHOM is the variance of IDM. The variance images of original CON and HOM are show in Fig.5 (a). The variance images of merged CON and HOM are show in Fig.5 (b). In the variance feature images, the deeper color indicates the smaller variance value. Consequently, from the variance feature images of contrast and IDM, it can be found that the variance of merged feature is smaller than the original. The phenomenon shows that the merged feature deviates from the feature of each direction with a lower level. Therefore, the merged feature can better represent the feature of the seismic profile.
(a) Variance images with original CON and HOM
(b) Variance images with merged CON and HOM
Figure 5. Contrastive variance images with merged and original CON
and HOM
D. Segmentation the Seismic Profile Image
In order to show the effectiveness of the algorithm, this paper uses the fuzzy c-means clustering algorithm to segment the seismic profile image. The segmentation image by original GLCM method is shown in Fig.6 (a). The segmentation image by the merged algorithm is shown in Fig.6 (b).
(a) Segmentation image by original GLCM method
(b) Segmentation image by proposed merged algorithm Figure 6. Ultimate segmentation image
island is relatively less and the description of the feature for the original profile is more specific.
IV. CONCLUSIONS
Seismic profile is a typical natural texture image. It can be accurately described by the texture feature. Although the general feature extraction algorithm can extract the texture feature of the image, the problem is that the direction of the image texture is always ignored when textural features are extracted. Consequently, the paper aimed at the ignored problem and proposed an algorithm merged directional derivative into GLCM method. It can be found that the merged algorithm can provide more specific feature set for the segmentation of the seismic profile and the effect of segmentation is better.
ACKNOWLEDGMENT
This work was supported in part by a grant from Natural Science Foundation of Shaanxi Provence of China No.2012JM8037.
REFERENCES
[1] Gao Dengliang. “Application of seismic texture model
regression to seismic facies characterization and interpretation,” The Leading Edge, 2008, 27(3):394-397.
[2] Angelo S M, Matos M, Marfurt K J. “Integrated seismic
texture segmentation and clustering analysis to improved delineation of reservoir geometry,” SEG Annual Meeting. Society of Exploration Geophysicists, 2009.
[3] Xu JianLou, Feng XiangChu, Hao Yan, Han Yu.
“Adaptive variational models for image decomposition combining staircase reduction and texture extraction,” Journal of Systems Engineering and Electronics, 2009, 02: 254-259.
[4] Zhang Guang-Zhi, Chen Lei, Ye Duan-Nan. “Seismic
Attributes Extraction Based on GPU,” proceedings of 2010 3rd International Conference on Computer and Electrical Engineering (ICCEE 2010 no.2) [C]. IACSIT, 2012: 6.
[5] Chopra S, Alexeev V. “Applications of texture attribute
analysis to 3D seismic data,” The Leading Edge, 2006, 25(8): 934-940.
[6] Yenugu M, Marfurt K J and Matson S. “Seismic texture
analysis for reservoir prediction and characterization,” The Leading Edge, 2010, 29(9): 1116-1121.
[7] Chuai Xiaoyu, Wang Shangxu, Yuan Sanyi, Chen Wei,
Meng Xiangcui. “A seismic texture coherence algorithm and its application,” Petroleum Science, 2014, 02: 247-257.
[8] Tong min. “The research of seismic texture extraction
method and analysis of influencing factors,” China University of Geoscience, 2013. (in Chinese)
[9] Lei yingcheng, Cao junxiang. “The amplitude
co-occurrence matrix analysis of seismic' images and its
application”. Journal of Oil and Gas Technology," 2011, 33(6): 64-68. (in Chinese)
[10]Yu Xiaohan, Yuan Xaozong. “Direction measure and its
application to texture classification,” Acta Automatica Sinica, 1990, 16(4): 347-351. (in Chinese)
[11]Wang Guode, Zhang Pei-lin, Ren Guoquan, Kou Xi.
“Texture Feature Extraction Method Fused with LBP and GLCM,” Computer Engineering, 2012, 38(11). (in Chinese)
[12]Chuai Xiaoyu, Wang Shangxu, Shen Jinsong, Chen Wei,
Xiao Mengxiong. “A new seismic coherence cube algorithm: Seismic texture coherence algorithm,” 82th Annual International Meeting, SEG Technical Program Expanded Abstracts 2012: 1-5.
[13]Gao D L. “Latest developments in seismic texture analysis
for subsurface structure, facies, and reservoir characterization: A review,” Society of Exploration Geophysicists, 2011, 76(2): W1-W13.
[14]Marcilio Castro de Matos, Malleswar (Moe) Yenugu,
Sipuikinene Miguel Angelo, and Kurt J. Marfurt. “Integrated seismic texture segmentation and cluster analysis applied to channel delineation and chert reservoir characterization,” Society of Exploration Geophysicists, 2011, 76(5): P11-P21.
[15]Haralick R M, Shanmugam K, Dinstein I H. “Textural
features for image classification. Systems,” Man and Cybernetics, IEEE Transactions on, 1973 (6): 610-621.
Tianshi Liu (1960- ) received B.S.
degree from Northwest University, China in 1982, and obtained his M.E. degree from Xi’an Jiaotong University, China in 1985, and obtained Ph.D. degrees from Northwestern Polytechnical University, China in 2005. Now he is a Professor and Master Degree supervisor in School of Computer Science at Xi’an Shiyou University, Xi’an, China. His current research interests include distributed systems, management information system, computer networks, and communication optimization algorithm.
Prof. Liu is the member of CCF, the president of Shaanxi Computer Institute and the vice-president of the Chinese Society of Education.
Minmin Xiao (1990- ) received B.S.
degree from Xi’an Shiyou University, China in 2012.