Human Gait Identification Based on Difference
Image
Jinyan Chen, Gang Li
School of Computer Software, Tianjin University, Tianjin,China. Email: {chenjinyan, ligang }@tju.edu.cn
Abstract—Human gait recognition aims to identify people by their walking style. In this paper a difference image based human gait identification method is proposed. For each human gait images sequence, gauss model based background estimation is used to segment frames of the sequence to obtain the silhouette images with less noise. By comparing the difference of two adjacent silhouettes in the images sequence, we can get a difference images sequence. Every difference image in the difference sequence indicates the body moving feature during ones walking. By projecting every difference image to Y axis or X axis we can get two feature vectors. Project every difference images of the whole walking images in one walking cycle we can get two matrixes. These two matrixes indicate the style of ones walking. Then Two-Dimensional Principal Component Analysis(2DPCA) is used to transform the above matrixes to two vectors while at the same time keep the maximum separability. Finally the similarity of two human gait images is calculated by the Euclidean distance of the two vectors. Experimental results on a gait database of 124 people show that the rank 5 identification accuracy can achieve 92%.
Index Terms—human gait, gait identification, principle component analysis, difference image, visual surveillance
I. INTRODUCTION
A. Background of Gait Based Human Identification
Human gait is the manner of ones walking, which was firstly studied by doctors for medical purpose [1-3]. Doctors analyzed their patients walking style to decide whether they were healthy. Then Roislien et al. [4] found that age, gender and weight might influence human gait. BenAbdelkader et al. [5-7] found that just as other biological features, almost everyone has his own walking features. In fact if the sample is properly chosen human gait could also be used as a biological feature to identify human.
In comparison with the first generation biometric such as fingerprint, face and iris, gait based identification has many advantages [8, 9]: (1) Gait based identification could be done at a distance as long as the object is visible. (2) Human gait is difficult to be disguised: fingerprint and iris can be masked by glove or glasses while walking style is difficult to be disguised. (3) Human gait based identification does not require user’s interaction.
Currently gait recognition approaches can be classified into two categories: model-based identification and model free identification. Model-based gait identification
try to segment the silhouette into several components according to the structure of human model, then uses the moving model parameters of the above components to describe the gait features. Cunado et al. [11] took Hough translation to extract arms, legs and body from the binarized silhouette and used Fourier analysis to describe the movement the above parts. Yam et al. [12] adopted double pendulum to describe the thigh and lower leg movements. Lee and Grimson [10] used several ellipses to fit the different parts of the silhouette of the person and estimate the parameters from these ellipses. Yoo et al. [13] divided the body into several parts by image segmentation and extracted features from these segments, then support vector machine was used to identify human. Tafazzoli and Safabakhsh [14] constructed movements model based on anatomical proportions then Fourier transform was used to analysis human walking style.
However, the majority of current approaches are the model free approaches. The model free approaches do not model the structure of human motion, but deal directly with image statistical information. Yu et al. [15] overlapped silhouette to get Gait Energy Image (GEI) and used the GEI to identify human. Cheng et al. [9] used Hidden Markov Models to analyze the relationship between these images. Wei Suyuan et al. [16] and Xue Hongmin et al. [17] used “frieze” patterns to extract features from images sequence. Little and Boyd[18] adopted scale independent features from moments of the dense optical flow to represent the shape of human motion. Wang et al. [19] took Chrono-Gait Image as the gait features. Liu et al.[20] represented ones walking style by outermost contour.
In fact model based human identification focus on analysis the moving features of body parts while model free methods focus on the statistical information of the silhouette.
The raw features extracted by model free identification usually serve the curse or dimensions. So Principal Component Analysis (PCA), Gabor transform [21], Random Forest algorithm[22] and Fourier transform [23, 24] were used to reduce the dimension of these features.
Training gait image sequences
Background
subtraction Difference Image Sequence Project To X,Y Axis
2D PCA
Trained Database
Testingt image sequences Background
subtraction Difference Image
Sequence Project To X,Y
Axis
2D PCA
Recognition
Training Testing
Figure1. The overview of our Difference Image (DI) based method.
B. About PCA and 2DPCA
Principal Component Analysis (PCA) is an efficient method to extract features from raw data. As a dimension reduction method PCA has been used in the scenario of computer vision and pattern recognition. One dimensional PCA has been used in gait based human identification. Liang Wang et al. [25] used one dimensional PCA to transform the original silhouette matrix to a low-dimensional eigenspace. Dong Xu et al. [26] used average human gait matrix to express the walking features of human then extract features from the average human gait matrix by one dimensional PCA. But to our knowledge most of the PCA based human gait identification are based on one dimension PCA not two dimensions PCA.
C. Our Contribution
In this paper, we propose a model free based gait recognition approach which can tolerate imperfect segmentation to some extension. This paper is an extension to our previous work[27]. Comparing to our precious work in this paper we improved our silhouette extraction method and utilized 2DPCA as the features extraction method. Experiment shows these improvement can achieve better result. In comparison with the works of state-of-the-art, the contributions of this paper are:
Difference Image (DI) based silhouette feature representation method: Model based human identification focused on analysis the moving features of body parts while model free methods focused on the statistical information of the silhouette. Model-based method is more precise but is sensitive to segmentation and prone to be affected by noise. Comparing to model-based method
model free method is more robust to noise but is not very precise. This paper combines the advantages of the above two methods. In this paper we propose a new gait feature representation which focuses on the difference image between two adjacent frames in the human walking images sequence. The image difference is projected and the “projected result” is used as the gait feature.
Comparing to other methods, the difference image can keep more features of walking.
2DPCA based feature extraction method: Two-Dimensional Principal Component Analysis (2DPCA) is used to extract features from the feature matrix, which can be more efficient and save more storage comparing to widely used One-Dimensional Principal Component Analysis. To our knowledge nobody has used 2DPCA in human gait identification.
The overview of our gait recognition method is shown in Fig. 1. It contains two major parts – the training part and the testing part. In training part, we first extract features from the input training gait sequences. Then 2DPCA is performed to reduce the dimensionality of the extracted features. In testing part, we also extract feature of the test gait sequence firstly. Then the features in the training stage are used to identify the testing gait sequence.
The remainder of this paper is organized as follows: Section 2 describes our feature extraction, identification and verification method in detail. Experimental results are presented in Section 3, and Section 4 gives conclusions of the paper.
II. GAIT FEATURE EXTRACTION AND HUMAN IDENTIFICATION &VERIFICATION
A. Silhouettes Sequence Extraction
In this paper Gauss background model is used to estimate the background. We use the method proposed by Wang [25] to subtract background image from the foreground image: ) 256 ( ) 256 ( ) 256 )( 256 ( 2 ) 1 ( ) 1 ( ) 1 )( 1 ( 2 1 ) , ( b a b a b a b a b a D − + − − − ⋅ + + + + + −
= (1)
D(a,b) is the difference between point a(pixel in foreground image) and point b(pixel in background image). Gauss blur is used to smooth the images to eliminate the affect of noise.
For each image I, the distribution of the above extraction function f(a(x,y),b(x,y)) over x and y can be obtained. Then moving pixels can be extracted by comparing such a distribution against a threshold value decided by the conventional histogram method. That is:
,
1 ( ( , ) )
silhouette ( , )
0 therwise
x y i
if D a b
x y
o
> Δ
⎧
=⎨
⎩ (2)
By above method we get a sequence of binary silhouettes images from the walking video. Fig. 2 shows the original image and the image segmentation result.
(a) (b)
Figure 2. (a) The original image in gait database, (b) The silhouette image obtained by formula (1) (2).
B. About Difference Image
We can get the difference image by subtracting two silhouettes image. Given two adjacent images i and i+1, then the difference image of i and i+1 can be described as following:
1 , 1
1 ( ( , ) 0 and ( , ) 1) _ ( , )
0 therwise
i i
i i
if img x y img x y diff img x y
o + + = = ⎧ =⎨
⎩ (3)
Fig. 3 shows binarized two frames extracted from a surveillance video and the difference image.
The difference images can be regarded as the body moving mode during ones walking. We use the following method to reduce the dimensions of the difference image, projecting every difference image to Y axis or X axis then we can get two vectors: PX and PY. For frame i and i+1, the PXi and PYi can be defined as following:
∑
+=
y
i i x y img diff
x) _ ( , )
(
PXi , 1 (4)
∑
+=
x
i i x y img diff
y) _ ( , )
(
PYi , 1 (5)
(a) (b)
(c)
Figure3. (a) (b) Binarized silhouettes images. (c) The difference image of (a) and (b).
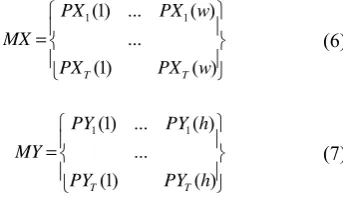
The difference image matrices can be defined as following: ⎪ ⎭ ⎪ ⎬ ⎫ ⎪ ⎩ ⎪ ⎨ ⎧ = ) ( ) 1 ( ... ) ( ... ) 1 ( 1 1 w PX PX w PX PX MX T T (6) ⎪ ⎭ ⎪ ⎬ ⎫ ⎪ ⎩ ⎪ ⎨ ⎧ = ) ( ) 1 ( ... ) ( ... ) 1 ( 1 1 h PY PY h PY PY MY T T (7)
T is the total frames count in a walking cycle, w means the width the difference image and h means the height. We can visualize MX and MY as Fig. 4.
Figure4. By projecting the difference image along X axis and Y axis we can get the gait feature matrices , then stacking these 1D projections
over time we can get the 2D patterns.
C. The Average Difference Image
Figure5. A “half” walking cycle.
In fact a human gait images sequence can be divided to several walking cycles. Fig. 5 shows a gait cycle. In the first stance the person is at rest and the silhouette size is minimal, then he step out his left leg and the silhouette size will increase with his stepping out, in the sixth stand his legs and arms complete separated. Then the legs and arms closed, at stance 11 the size reach minimum again. By estimating the size of the silhouette we can divide an images sequence into several walking cycles. In fact this is not a complete gait cycle but a “half” cycle, but as we know that the next “half” cycle is just the same as this one, so in this paper we call a “half” gait cycle as one gait cycle.
By the above method we can divide an images sequence into several walking cycles. Then we can get the average project matrix as follows:
1 1
1
(1) ... ( )
...
(1) ( )
c i i
T T
PX PX w
MX MX
PX PX w
=
⎧ ⎫
⎪ ⎪
= =⎨ ⎬
⎪ ⎪
⎩ ⎭
∑
(8)1 1
1
(1) ... ( )
...
(1) ( )
c i i
T T
PY PY h
MY MY
PY PY h
=
⎧ ⎫
⎪ ⎪
= =⎨ ⎬
⎪ ⎪
⎩ ⎭
∑
(9)Where c represents the cycles. In this paper the Average Difference Image is abbreviated as DI.
D. Two-Dimensional Principal Component Analysis
In traditional PCA method:-based image feature extraction methods, every feature must transform to a vector that is mean the 2D image should be transformed to a vector. Then overlapping these vectors usually lead to a high dimensional vector space. The overcome the problem of high dimensional space Jian Yang[28] proposed a two-dimensional based PCA. Comparing to one dimensional PCA this method seems more efficient. The kernel idea of two-dimensional PCA is to project a m×n random matrix onto Y by the following linear transformation[28]:
Y=AX (10) Where A means the mapping matrix and Y means the target matrix. By formula (10) the original matrix is projected to a m-dimensional vector Y, which is called the projected feature vector of image A.
To estimate the total discriminatory ability of projection vector X the total scatter of samples can be introduced. The total scatter can be described by the trace
J(X)=tr(Sx) (11)
Where Sx means the covariance matrix of the projected
feature vectors , tr(Sx) means the trace of Sx. By using
formula(11) [28], the trace of Sx can be described as
follows:
X EA A EA A E X S
tr T T
x) [ ( ) ( )]
( = − − (12)
We define:
∑
=− −
= M
j
j T j
t A A A A
M G
1
) ( ) ( 1
(13)
The criterion described formula (11) can be denoted as following:
X G X X
J( )= T t (14) The optimal projection axes X1,..., Xd, should make Gt
has the maximum trace that is to say X1,..., Xd are the
orthonormal eigenvectors for Gt corresponding. That is:
1
( ,..., ) argmax ( )
0 , 1...
d i j
X X J X
X X i j and i j d
=
⎧
⎨ = ≠ =
⎩ (15)
And
Yk=AXk k=1,...,d (16)
E. 2DPCA-Based Reconstruction
The principal components and eigenvectors can be combined to reconstruct the original image. Let V=[Y1,...,Yd] and U=[X1,...,Xd] and according to formula
(16) :
U=AV (17) Since X1...Xd is orthonormal then according to formula
(15) the reconstructed image can be expressed as:
1 d
T T
k k k
A UV Y X
=
= =
∑
(18)
That is to say the original image can be reconstructed by the Yk and Xk. In this paper the features of sample i is
expressed as Fi that is:
) ,...,
( 1 di
i
i Y Y
F = (19)
F. Alignment of the Difference Matrix.
Figure6. Three images from CASIA dataset with view angle 0,90 and 180.
matrix has the same size we use bilinear interpolation to extend every matrix to the standard width and height. In this paper the with of standard image is 13 pixels and the height is 50.
G. Identification and Verification
2DPCA is used to extract the features from X axes and Y axes projected feature matrix. Then for one walking images sequence i, we can get a d dimensions vector Fi.
Given two feature vectors Fi and Fj, the distance is
defined as following:
2
1
( , ) d ( k k)
i j i j
k
D F F f f
=
=
∑
− (20) Suppose that the training samples are F1,...,FM(Wherethe M is the total number of training samples), and that each of these samples is assigned a given identity class k. Given a test sample T, this sample belongs to n if
( , ) min( ( , ))n k k
d T F = d T F
In the scenario of verification, the similarity between two feature vectors is defined as the negative of distance, that is:
2
1
( , ) ( , ) d ( k k)
i j i j i j
k
Sim F F D F F f f
=
= − = −
∑
− (21)In this paper the similarity between a probe Pj and Fi in
the gallery is defined as z-normed similarity [29]:
( , ) ( , )
( , )
. . ( , )
j i i j i
j i
i j i
Sim P F Mean Sim P F
Sim P F
s d Sim P F
−
= (22)
Where s.d. is standard deviation.
FAR (False Acceptance Rate) , FRR (False Rejection Rate) and EER (Equal Error Rate) are used to evaluate the performance of verification[30].
III. EXPERIMENT AND DISCUSSION
A. About the Dataset
In this paper CASIA database (Dataset B) [31] is used to evaluate our proposed method. The CASIA database is provided by the Institute of Automation, Chinese Academy of Sciences (CASIA) . Dataset B consists of 124 subjects (93 males and 31 females) captured from 11 view angles (ranging from 0 to 180 degree with view angle interval of 18). For every person there are six normal walking sequences (named normal-01...normal-06) conducted from every view angle. Every walking sequence contains 3-8 gait cycles (about 40-100 frames). The video frame size is 320×240 pixels, and the frame rate is 25 fps. We use all the 124 objects in Dataset B to carry out our experiments. For each person from every view angle, we select 1-3 walking cycles from sequence
normal-01 as the training data (gallery), and one walking cycle from sequence normal-02 as the test data (probe).
For every view angle, each time we leave one training images sequence out and use the remainder as the training set. In the scenario of identification we calculate the distance between the probe corresponding to the leave out training images sequence and the 124 classes (including the leave out images sequence). In the scenario of verification, we calculate the similarity between the probe corresponding to the leave out training images sequence and the 124 classes (including the leave out images sequence).
In all the following experiment 2DPCA method was used to get features from the images and the first 5
eignvalues are used to produce features except with special declaration.
B The Magnitude of Eigenvalues
After projection of the feature image sample onto these axes using (8), we obtained top twenty principal component. The magnitude of Gt’s eigenvalues is plotted
in decreasing order in Fig. 7. As showed in Fig. 7 the magnitude of the eigenvalues quickly converges to zero, which is exactly consistent with the results of Fig. 8.
0 5 10 15 20 25
0 200 400 600 800 1000
E
igenval
ues
Original image k=1 k=2 k=3 k=4 k=5 k=6
Figure8. The reconstruction of feature matrix (projected to Y axes). All images are enlarged for the sake of clarity.
0 0.2 0.4 0.6 0.8 1
0 0.1 0.2 0.3 0.4 0.5 0.6 0.7 0.8
FAR
FRR EER
DI GEI
(a)
0 0.2 0.4 0.6 0.8 1
0 0.1 0.2 0.3 0.4 0.5 0.6 0.7 0.8
FAR
FRR EER
DI GEI
(b)
0 0.2 0.4 0.6 0.8 1
0 0.1 0.2 0.3 0.4 0.5 0.6 0.7 0.8
FAR
FRR EER
DI GEI
(c)
Figure 9. a-c The comparison of ROC curves of AGDI and GEI with
C. The Reconstruction of the Feature Matrix
From the definition of 2DPCA and formula (18) we can reconstruct the original image from the subimages. Fig. 8 shows the result of the reconstruction.
From Fig. 8 we can find that the first 3 subimages contain most energy of the original image while the others contain detail information about the feature matrix. Therefore, it is reasonable to use these component vectors to represent the image for recognition purposes.
D. Comparison between Our Method and GEI
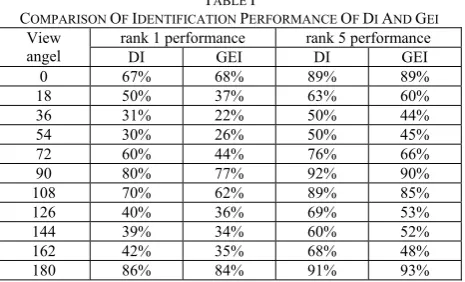
We compare the performance of our Difference Image (DI) base method with that of Gait Energy Image based method (In this paper we use real template for GEI method). Table1 shows the rank 1 and rank 5 identification rates comparing with GEI.
TABLE I
COMPARISON OF IDENTIFICATION PERFORMANCE OF DI AND GEI
View
angel rank 1 performance DI GEI DI GEI rank 5 performance
0 67% 68% 89% 89%
18 50% 37% 63% 60%
36 31% 22% 50% 44%
54 30% 26% 50% 45%
72 60% 44% 76% 66%
90 80% 77% 92% 90%
108 70% 62% 89% 85%
126 40% 36% 69% 53%
144 39% 34% 60% 52%
162 42% 35% 68% 48%
180 86% 84% 91% 93%
From table 1 we can see that our method has better performance under view angle 0,90,108 and 180. That is may because the image token from above the angle is not prone to be affected by deformation.
To compare the performance of verification, we also evaluate the FAR (False Acceptance Rate) and FRR (False Rejection Rate) for AGDI and GEI. The ROC (Receiver Operating Characteristic) curves under view angle 0,90, 180 are shown in Fig. 9(a)-(c).
The Comparison Between PCA and 2DPCA.
We also design an experiment to compare the
view angel is 90.
As illustrated in Fig. 10, the performance of 2DPCA, achieving maximum at about 5 dimensions, is much better than PCA which will achieve the best performance at about 15 dimensions. This experiment shows that 2DPCA is more efficient in dimension reduction.
5 10 15
0 20 40 60 80 100
R
e
cog
n
it
io
n Accu
a
cy
%
Dimension 2DPCA PCA
Figure 10.The Rank 5 recognition Accuracy comparison of 2DPCA and PCA.
The Affection of Images Cycle Count
From formula (8) and (9) we can see that the feature matrix is the average value of differential images. It should be expected that the use of more images as sample would contribute to a more precise result. To demonstrate this effect, a test was conducted by selectively choosing 1,2,3 gait cycles image from 90 degree in sequence normal-02 as test dataset probe. The precision of identification and verification is showed in Fig. 11.
From Fig. 11 we can find that the accuracy of identification and verification will increase with the increase of walking cycles.
IV. CONCLUSION AND FUTURE WORK
In this paper, a difference image and two-dimensional principal component analysis based gait identification and verification method is proposed. The difference image is obtained by comparing two adjacent silhouettes. By projecting difference image to X-axis and Y-axis we get feature matrix. Bilinear interpolation is used to make every feature matrix has the same with and height then 2DPCA is used to get the features. Experimental result shows that 2DPCA has better performance comparing to traditional PCA. Minimum distance classification algorithm is used to identify the human gaits. Experiment based on CASIA database result shows our method has an encourage identification and verification performance. In the future there are still some problems to be resolved: Our method is still sensitive to silhouettes segmentation. The matrix alignment method in this paper may lose some useful information.
ACKNOWLEDGMENTS
Dataset used in this paper is provided by Institute of Automation, Chinese Academy of Sciences. This work is partially supported by Ph.D. Programs Foundation of Ministry of Education of China (No. 20100032120011).
REFERENCES
[1] Johansson, G., Visual Motion Perception. Scientific American, 1975. 232(6): pp. 76-88.
[2] Whittle, M.W., Clinical Gait Analysis: A Review. Human Movement Science, 1996. 15(3): pp. 369-387.
[3] Hope, J., A review of the mechanism of injury and treatment approaches for illness resulting from exposure to water-damaged buildings, mold, and mycotoxins. TheScientificWorldJournal, 2013. 2013: pp. 767482-767482.
[4] Roislien, J., et al., Simultaneous estimation of effects of gender, age and walking speed on kinematic gait data. Gait & Posture, 2009. 30(4): pp. 441-445.
[5] BenAbdelkader, C., R. Cutler, and L. Davis. Stride and cadence as a biometric in automatic person identification and verification. in Automatic Face and Gesture Recognition. 2002: IEEE.
[6] Stevenage, S.V., M.S. Nixon, and K. Vince, Visual analysis of gait as a cue to identity. Applied Cognitive Psychology, 1999. 13(6): pp. 513-526.
[7] Winter, D.A., Biomechanics and motor control of human movement. 2009, New York: John Wiley & Sons Inc. [8] Wang, L., et al., Fusion of static and dynamic body
biometrics for gait recognition. Circuits and Systems for Video Technology, IEEE Transactions on, 2004. 14(2): pp. 149-158.
[9] Cheng, M.H., M.F. Ho, and C.L. Huang, Gait analysis for human identification through manifold learning and HMM. Pattern Recognition, 2008. 41(8): pp. 2541-2553.
[10]Lee, L. and W.E.L. Grimson, Gait analysis for recognition and classification. Proceedings of Fifth IEEE International Conference on Automatic Face Gesture Recognition, 2002: pp. 155-162.
[11]Cunado, D., M. Nixon, and J. Carter. Using gait as a biometric, via phase-weighted magnitude spectra. in Audio- and Video-Based Biometric Person Authentication. First International Conference, AVBPA'97. 1997: Springer. [12]Yam, C., M.S. Nixon, and J.N. Carter. Gait recognition by walking and running: a model-based approach. in The 5th Asian Conference on Computer Vision. 2002. Melbourne, Australia.
[13]Yoo, J.-H., D. Hwang, and M.S. Nixon. Gender classification in human gait using support vector machine. in Advanced Concepts for Intelligent Vision Systems. 7th International Conference, ACIVS 2005. Proceedings. 2005. Antwerp, Belgium: Springer-Verlag.
[14]Tafazzoli, F. and R. Safabakhsh, Model-based human gait recognition using leg and arm movements. Engineering Applications of Artificial Intelligence, 2010. 23(8): pp. 1237-1246.
[15]Yu, S., et al., A study on gait-based gender classification. IEEE Transactions on Image Processing, 2009. 18(8): pp. 1905-1910.
[16]Kale, A., et al., Gait-based human identification from a monocular video sequence. Handbook on Pattern Recognition and Computer Vision, 2004.
[17]Liu, Y.X., R. Collins, and Y.H. Tsin, Gait sequence analysis using frieze patterns. Computer Vision - Eccv 2002, Pt Ii, 2002. 2351: pp. 657-671.
[18]Little, J.J. and J.E. Boyd, Recognizing people by their gait: the shape of motion. Videre|Videre, 1998. 1(2).
[20]Liu, L.L., et al., Gait Recognition Based on Outermost Contour. International Journal of Computational Intelligence Systems, 2011. 4(5): pp. 1090-1099.
[21]Hu, H., Enhanced Gabor Feature Based Classification Using a Regularized Locally Tensor Discriminant Model for Multiview Gait Recognition. Ieee Transactions on Circuits and Systems for Video Technology, 2013. 23(7): pp. 1274-1286.
[22]Dupuis, Y., X. Savatier, and P. Vasseur, Feature subset selection applied to model-free gait recognition. Image and Vision Computing, 2013. 31(8): pp. 580-591.
[23]Das Choudhury, S. and T. Tjahjadi, Silhouette-based gait recognition using Procrustes shape analysis and elliptic Fourier descriptors. Pattern Recognition, 2012. 45(9): pp. 3414-3426.
[24]Lee, C.P., A.W.C. Tan, and S.C. Tan, Gait recognition via optimally interpolated deformable contours. Pattern Recognition Letters, 2013. 34(6): pp. 663-669.
[25]Wang, L., et al., Silhouette analysis-based gait recognition for human identification. Ieee Transactions on Pattern Analysis and Machine Intelligence, 2003. 25(12): pp. 1505-1518.
[26]Xu, D., et al., Human gait recognition with matrix representation. Ieee Transactions on Circuits and Systems for Video Technology, 2006. 16(7): pp. 896-903.
[27]Chen, J. and R. Wu. Two-dimensional PCA-based human gait identification. in Photonics Asia. 2012: International Society for Optics and Photonics.
[28]Yang, J., D. Zhang, and A.F. Frangi, Two-dimensional PCA: a new approach to appearance-based face representation and recognition. Pattern Analysis and Machine Intelligence, IEEE Transactions on, 2004. 26(1): pp. 131-137.
[29]Phillips, P.J., et al. Face recognition vendor test 2002. in Analysis and Modeling of Faces and Gestures, 2003. AMFG 2003. IEEE International Workshop on. 2003: IEEE.
[30]Sarkar, S., et al., The HumanID gait challenge problem: Data sets, performance, and analysis. Ieee Transactions on Pattern Analysis and Machine Intelligence, 2005. 27(2): p. 162-177.
[31]CASIA Gait Database, 2009,
http://www.sinobiometrics.com/.
Jinyan Chen born in 1974. Received his Ph.D’s degree at School of Computer Science and Technology in 2008, Tianjin University. He is currently a lecturer in Tianjin University. His research is in the areas of human gait identification, human activity and action recognition.