6
I
January 2018
International Journal for Research in Applied Science & Engineering Technology (IJRASET
)
ISSN: 2321-9653; IC Value: 45.98; SJ Impact Factor :6.887 Volume 6 Issue I, January 2018- Available at www.ijraset.com
Chronic Kidney Disease Analysis Using Machine
Learning Algorithms
Jaya Sandeep Reddy Mula1, Binil Kuriachan2
1,2
Computer Science Department, VIT University, Chennai.
Abstract:Now-a-days, Data Mining technology has become the trend for diagnostic result. Innumerable efforts were put on to cope with the explosion of medical data, retrieving useful information from it and making prediction with availed information The main objective of this research paper is predicting the presence of the Chronic Kidney Disease(CKD) in patients by using various classification algorithms like Naïve Bayes, Random Forest, Logistic Regression, Linear Discriminant Analysis(LDA) and Quadratic Discriminant Analysis(QDA) and also finding the most predictive and influencing features on target variable by using feature selection technique (Chi-Square test) and Gini impurity index. R tool is used for implementing these classification techniques. Performance of all stated algorithms are being compared by considering accuracy, precision and recall in order to determine the best classifier for predicting the patients having chronic kidney disease.
Keywords: Data Mining, Classification Algorithms, R tool.
I. INTRODUCTION
Data mining techniques makes the researchers, industrialists and other sectors paying attention on it because of its capability to extract the valuable information from the huge amount of data that is hidden in the data. Data mining is used in various sectors like medical, social networking, education, agriculture, web mining, image mining, machine failure analysis, business analysis etc. Data mining plays a key role for the discovery of latest trends in health-care
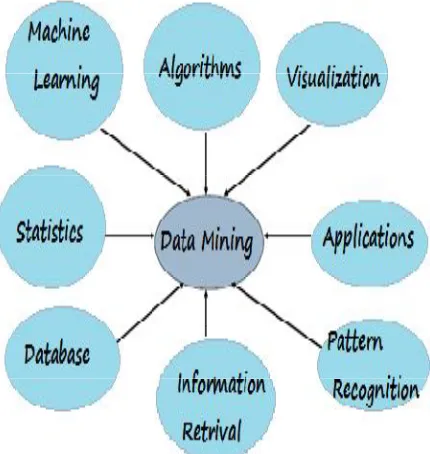
Industry because of its better service for the medical analysis that would help the health-care organizations for taking innumerable type of required management decisions. Fig.1 represents the classification of various techniques used in data mining. The services that are being provided by the data mining techniques in the health-care are stated as follows:
[image:2.612.200.415.474.701.2]Days required for a candidate for staying in the hospital, ranking the hospital position, requirements for best treatment and detection of fault insurance claim policies by the victims and also by the providers, re-admission of the victims, identification of group of the particular victims, providing guidance for the effective drug recommendation system, etc.
Data mining in the health-care sector is being used for predicting different types of diseases as well as it gives better knowledge for the professional in order to give proper decisions and also magnifying the performance of the patient management task to be done for example, patients suffering from common type of symptoms are grouped and proper treatment plans can be made for the them considering the victim’s health conditions, previous diagnosis reports and treatments.
Chronic Kidney Disease is an internationally recognized health issues from public affecting in range of 5-10 percent of the world population. This results in decreasing the capability of the kidneys performance for excreting the waste products that leads to the death. Till now CKD was the cause of 956,000 deaths globally in 2013. The most common recognized cause of CKD is diabetes and hypertension. The specific symptoms of CKD are detected as an increase in serum creatinine or protein in the urine. This paper mainly focuses on detecting the CKD using classification algorithms Naïve Bayes, Random Forest, LDA, QDA and Logistic Regression.
II. LITERATURESURVEY
In April 2017, Israa Ahmed and Mohammad Azzeh published a paper on "Comparative study of predicting heart diseases by using data mining classification". In this research, the analysis is done on improving the precision and accuracy of the heart disease detection, as a result various methods were formed to analyze the disease factors for reducing medical cost, errors, etc., by using various machine learning like Naive Bayes, Decision Tree, Random Forest and support vector machine and these classifier algorithms were compared for best algorithm that gives good precision and accuracy.
In January 2017, Dr. V Murali Bhaskaran published a paper on “Diabetes disease prediction system using classification techniques”. In paper various classifier algorithms were used for improving precision, accuracy, recall and f-measure like random forest, Naïve Bayes and NB-tree by using Weka tool.
In January 2017, Fadzli Syed Abdullah, Aryati Ahmad published a paper on “classification of childhood obesity among 6 school children using data mining technique”. In this research, classification on obesity of school children were performed by considering two districts. Data pre-processing, feature selection was performed on the datasets. Later classification algorithms like SVM, Bayesian network, Decision tree were performed and compared.
In 2014, Rajesh Sharma published a paper on “Automatic classification of cardiac signals by using QDA and LDA analysis”. In this paper, the non-stationary signal of the patient’s cardiac state indication is compared to find the disorders. Classifiers algorithms will extract the features from the ECG signal by categorizing into LDA and QDA analysis.
In August 2015, Dr S. Vijayarani and Mr. Dhayanand published a paper on “Data mining classification algorithms for kidney disease prediction”. The main objective of this paper is predicting the kidney disease presence using classification algorithms like Naïve Bayes and Support Vector Machine. Research work has been focused on accurate prediction and time factor performance. In December 2013, Teddy Mantoro published a paper on “Data mining techniques for optimization of liver disease classification”. The research work is based on finding the 10 important attributes of liver disease occurring using Decision tree, Naive Bayes algorithms for helping out the medical practitioner to give proper medication and medical treatment.
III. METHODOLOGY
A. Data Pre-processing
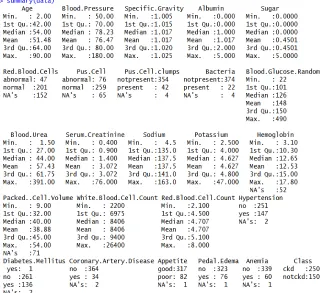
The Chronic Kidney Disease data consists of 400 records, the data used for analysis is chosen from the UCI machine learning repository. Data generated after the data cleaning and by replacing the missed values by mean of the column for continuous values are 233 records. The implementation of the work is done by using R tool. The dataset contains 25 attributes among them the continuous attributes include Age, Blood Glucose Random, Blood Pressure, Blood Urea Sodium, Potassium, Serum creatinine, Haemoglobin, WBC Count, RBC Count Packaged Cell Volume and the categorical attributes includes Red Blood Cell, Specific Gravity, Albumin, Pus Cell, Sugar Bacteria, Pus Cell Clump, Hypertension, Coronary Artery Disease, Diabetes Mellitus, Pedal Enema, Appetite and Class
International Journal for Research in Applied Science & Engineering Technology (IJRASET
)
[image:4.612.146.464.81.375.2]ISSN: 2321-9653; IC Value: 45.98; SJ Impact Factor :6.887 Volume 6 Issue I, January 2018- Available at www.ijraset.com
Fig. 2. Summary Before removing NA’S values in continuous attributes
[image:4.612.148.472.417.710.2]B. Feature Selection
Feature selection is one of the best method that will further improve the performance of the classification system, because it will select the most predictive feature among all the features. In addition to this, it will reduce data that are having dimensionality in high and removes the unnecessary and noisy data. Thus, Feature selection method helps in building the faster, accurate classification models. In present work, the selection of Feature selection method algorithms was influenced by size of the data, most efficient predictors and consistency. Here, we briefly introduce effective Feature selection technique like Chi-squared method.
1) Chi-Square(CHI2):Chi-Square filters the attributes, weight of the features for selecting the features having information and the ranking methods were used in to order to detach irrelevant features. CHI2 test is used for testing the independency of two events.
Let’s take the events X and Y to be independent when
P (XY) P(X)*P(Y) Eq. (1),
In the feature selection of text, these events will match for the happening of the class particularly. Computation can be done by using the stated formula as shown
CHI2 (t, c) = ∑ ( , , )
,,
, { , } Eq. (2),
N will be frequency observed and E will be the frequency expected for each class and the term. CHI2 will gives the measurement of
how much counts to be estimated and counts observed that deviates from each other. An increased value of CHI2 states that
hypothesis of independence is not correct. The occurrence of the terms forms the occurrence of the class are more likely when the
events are to be more likely. The outcome term of the CHI2 is calculated for the individual classes. This outcome can be globalized
to all the classes in two ways Weighted average score all outcomes should be calculated at first and then choosing the maximum
score among all the classed. The CHI2 value is to be globalized for all the classes
∑ P(ci). CHI2(t, ci) Eq. (3), Where
P(ci) probability of the class
CHI2 (t, ci) Class specific CHI2 outcome of term t.
C. Variable Importance
ean Decrease Gini is used for measuring variable importance by considering Gini impurity index which is used for calculating splits during training, variables in the obtained matrix describes how important the variables are classifying the data. Variables will be on the y-axis and important predictors will be on the x-axis. The plotting is done in an order of top to bottom approach in the form of most to least importance of the variables. Therefore, the predictors that are most important will pointed at the top and the determination of their importance is represented by the dot placed on the x-axis. If there is any large break down between the variables it describes the important variable to choose. So that this will be helpful for reducing the variables compared to other kind of data analysis techniques but preventive steps to be taken of not having too few variables that won’t separate the data or too many variables that gives over explanation of the differences. The important variables after plotting are Albumin, Haemoglobin and Serum. Creatinine, Packed. Cell. Volume Specific. Gravity, and the plot is shown in the Fig. 4.
D. Classification Model
Supervised Learning can be described as where the predictors and the outcome are given and algorithms are used for mapping function from the predictors to the outcome. It is of two types, Classification will predict the categorical class labels like yes or no, true or false, found or not found etc. Regression will predict the continuous class labels like weights, currency etc.
Unsupervised Learning: - describes only the given predictors without the outcome variable. It is of following types ; Clustering is
used to discover the intrinsic groupings in the data like grouping the customer by behaviour of their purchasing, Association is used for discovering the rules that explains the large portion of the data like people that buys X will show interest to buy Y.
International Journal for Research in Applied Science & Engineering Technology (IJRASET
)
[image:6.612.175.439.94.392.2]ISSN: 2321-9653; IC Value: 45.98; SJ Impact Factor :6.887 Volume 6 Issue I, January 2018- Available at www.ijraset.com
[image:6.612.119.487.438.708.2]Fig. 4 Variable Importance
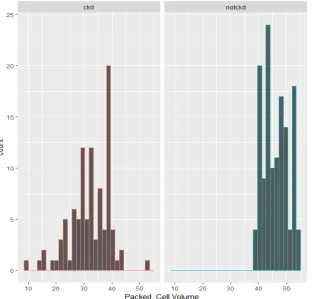
Fig. 6. Packed. Cell. Volume VS Target Variable
International Journal for Research in Applied Science & Engineering Technology (IJRASET
)
[image:8.612.123.443.79.384.2]ISSN: 2321-9653; IC Value: 45.98; SJ Impact Factor :6.887 Volume 6 Issue I, January 2018- Available at www.ijraset.com
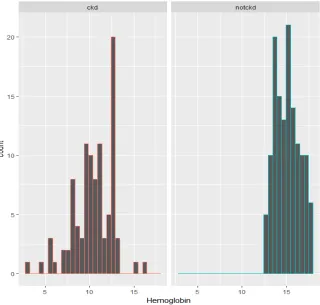
[image:8.612.120.481.410.717.2]Fig. 8. Haemoglobin VS Target Variable
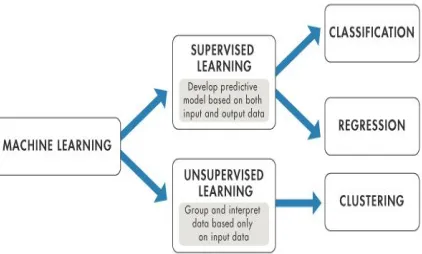
Fig. 10. Machine Learning Classification
Fig. 10 describes the classification of machine learning. Classification algorithms were used in this are Naïve Bayes, Random Forest, LDA, QDA and Logistic Regression. These are explained as follows
1) Naive Bayes Classifier: -The Naïve Bayes classifier will work on the principle of Bayes theorem with assumptions of the independent variable among the predictors. The model building is very easy and particularly useful for the huge datasets. This classifier is used for categorical classification only. The problem comes with this classifier is that it assumes that all the variables present in the data are independent to each other. In spite of independency assumption, naïve bayes will give good performance in terms of accuracy when the variables are independent to each other. Bayes theorem mainly focus on prior, posterior and discrete probability distribution. In healthcare field it plays a key role, one among them is it helps to make the computational process in a simple way and another one is that it has better accuracy and speed performance.
2) Logistic Regression: -If the dependent variable is binary, binary logistic regression is the better choice that will explore influence of categorical and/or continuous independent variables on the dependent variables in order to assess the effects of interaction between the independent variables. The probability of this classifier is expressed in terms of odds. Let us consider the probability that belongs to the /category 1 is 60/100 that is 60% then the odds that belongs to category 1 is 3. It can be represented in another way like it is 3 times more likely to category 1 than to be in category 0. Later the odds can be altered into the log of odds, which will be the natural log of the odds that means 2.718 power will be raised for the production of odds.
3) Random Forest: -analysis. In case if the outcome is not specified properly it will perform cluster analysis. The outcome should be specified in correct way of factors otherwise it will treat as continuous variable and will perform regression analysis. In random forest, nodes will split by considering the best ones from the subset of variables that are chosen randomly at the node, this can perform good when comparing to other classifiers and it will be robust against the over fitting. Random forest classifiers are easy and fast to implement, it will generate accuracy in high level when compared to others and are capable of handling bulk amount of data without over fitting. Considering all these things it will be one of the finest algorithm for the general usage purpose of available learning techniques.
4) Linear Discriminant Analysis (LDA): - LDA is one of the method used in statistics and machine learning for finding out the linear combination of variables that determines more than one class of the object. The obtained combination will be used as linear. Logistic Regression will be almost similar to the LDA than compared to ANOVA, as it will also explain the categorical dependent variable followed by the values of continuous independent variables. These methods can also be used in applications where these are not reasonable for assuming that the independent variable are distributed normally which might be the fundamental assumption for the LDA.
International Journal for Research in Applied Science & Engineering Technology (IJRASET
)
ISSN: 2321-9653; IC Value: 45.98; SJ Impact Factor :6.887 Volume 6 Issue I, January 2018- Available at www.ijraset.com
E. Metrics and Research Hypothesis
Four effectual measures were utilized in this paper are based on the confusion matrix outcome, that describes True Positive (TP), True Negative (TN), False Positive (FP) and False negative (FN).
Recall TP / (TP+FN) Eq. (4),
Precision TP / (TP+FP) Eq. (5),
Accuracy (TP+TN) / (TP+TN+FP+FN)Eq. (6).
The effectiveness of the text categorization can be measured by using the accuracy. Once model is build, it is necessary to decide that it will be good enough model for solving the problem Accuracy is not only enough to take this decision. So, we will look at Precision and Recall performance measures for evaluating the model for a binary classification problem.
IV. RESULTSOFCOMPARATIVESTUDY
[image:10.612.183.429.299.425.2]Different data mining tools are used to predict the accuracy, precision, recall for CKD. In this paper, the experimental steps are performed on the following algorithms like Naïve Bayes, Random Forest, LDA, QDA, and Logistic Regression for evaluating the algorithm that best classifies and identifies patients having chronic kidney disease.
TABLE 1
RESULT COMPARISON
From the Table 1, it is clearly observed that the accuracy, recall and precision values are different for Naïve Bayes, Random Forest, LDA, QDA, and Logistic Regression. The accuracy and precision for Random Forest are 100% and 1 which helps out for accurate classification and identification of patients who are suffering from chronic kidney disease.
A. Most Predictive Features
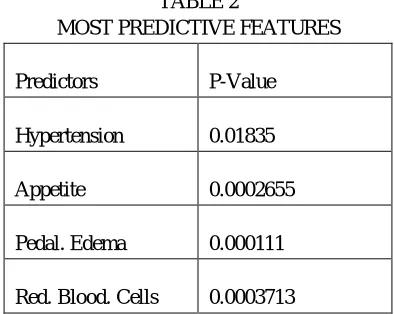
Chi Square test of independence is used to determine significant relationship between categorical variable. Most important predictive features are considered out of all features, because calculated P-Value for hypothesis testing is accepted when it is less than 5% and P-value score is described for important predictive features in Table 2.
TABLE 2
MOST PREDICTIVE FEATURES
Predictors P-Value
Hypertension 0.01835
Appetite 0.0002655
Pedal. Edema 0.000111
Red. Blood. Cells 0.0003713
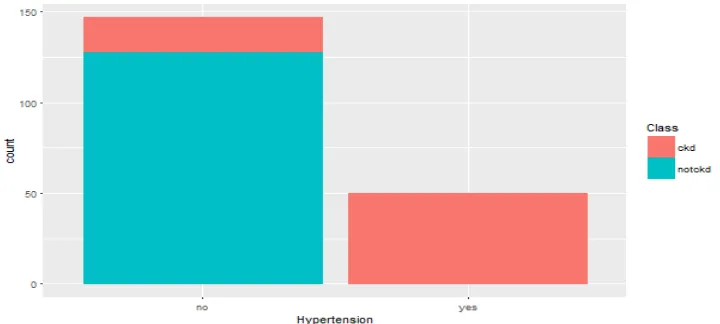
Visualization of above predictors with target variable from Table 2 is shown in Fig. 11, Fig. 12, Fig. 13, and Fig. 14. Classification
Algorithms
Accuracy Precision Recall
Naïve Bayes 97.83 96.4 100
Logistic Regression 97.83 95.5 100
LDA 95.65 100 89
QDA 93.48 100 89
[image:10.612.207.404.557.714.2]Fig. 11. Hypertension VS Target Variable
Fig. 12. Appetite VS Target Variable
[image:11.612.129.489.77.239.2]International Journal for Research in Applied Science & Engineering Technology (IJRASET
)
[image:12.612.117.496.76.289.2]ISSN: 2321-9653; IC Value: 45.98; SJ Impact Factor :6.887 Volume 6 Issue I, January 2018- Available at www.ijraset.com
Fig. 14. Red. Blood. Cells VS Target Variable
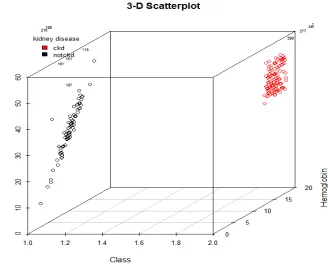
B. Visualization by a 3D Scatterplot for finding the best relationship between predictors and outcome
A 3D scatterplot is featured to visualize the above mentioned data structure. This visualization tool assigns two of explanatory variables to the Y and Z axis (predictor’s variables). To the X-axis (outcome). Also, the tool assigns the dots of the scatterplot according to the classification between predictors and outcome variables which indicates whether CKD is present or not present. The predictors are as follows Red Blood Cell Count, White Blood Cell Count, Urea, Haemoglobin and Packed Cell Volume Sodium. It is represented in Fig.15, Fig. 16 and Fig. 17.
[image:12.612.78.518.401.705.2]Fig. 16. Packed. Cell. Volume VS Haemoglobin
Fig. 17. Blood. Urea VS Sodium
V. CONCLUSION
[image:13.612.144.467.386.657.2]International Journal for Research in Applied Science & Engineering Technology (IJRASET
)
ISSN: 2321-9653; IC Value: 45.98; SJ Impact Factor :6.887 Volume 6 Issue I, January 2018- Available at www.ijraset.com
Classification algorithms such as Naïve Bayes, Random Forest, LDA, QDA, and Logistic Regression were used for the purpose of diagnosing the patients having chronic kidney diseases. Results from all the algorithms performed shows that Random Forest algorithms have’s good accuracy comparing to the other performed algorithms.
The empirical results show that accurate prediction for the chronic kidney patients, these predictive models can be used for the incoming new patients having common symptoms. This analysis will also help in identifying the patients those needed special treatment. The most important attributes for chronic kidney diseases after performing the Chi Square test are as follows Hypertension, Pedal. Enema, Red. Blood. Cells, Appetite and also by considering Gini impurity, predictors that are highly influencing on the target variable are identified as Albumin, Haemoglobin, Packed. Cell. Volume, Serum. Creatinine, Specific. Gravityand finally best relation between predictors and outcome are Red. Blood. Cell. Count, White. Blood. Cell. Count, Blood. Urea, Packed. Cell. Volume, Haemoglobin,
Sodium.
REFERENCES
[1] Israa Ahmed and Mohammad Azzeh published a paper on "Comparative study of predicting heart diseases by using data mining classification"- April 2017. [2] Dr. V Murali Bhaskaran published a paper on “Diabetes disease prediction system using classification techniques”- January 2017
[3] Fadzli Syed Abdullah, Aryati Ahmad published a paper on “Classification of obesity childhood among 6 school children using data mining technique”- January 2017
[4] Rajesh Sharma published a paper on “Automatic classification of cardiac signals by using QDA and LDA analysis”- 2014. [5] Leo Breiman, University of California published a paper on “Random Forests”-January 2001.
[6] Boyu Wang, Chi Man Wong and Feng Wan published a paper on “Comparison of different classification methods for EEG-based brain computer interfaces”-June 2009.
[7] Sadiyah Noor published a paper on “Optimization of Liver Disease classification using the data mining techniques”-2013. [8] Chaitrali S. Dangare published a paper on “prediction of heart disease system using data mining techniques”-June 2012.
[9] Dhivya and Merlin Mercy published a paper on “Classification of heart disease and its morbid condition using weighted principal component analysis and Genetic algorithms”-April 2016.
[10] Dr Vijayarani and Dhayanand published a paper on “Kidney disease prediction using data mining classification algorithms”-August 2015. [11] Basma Boukenze published a paper on “Prediction of Chronic kidney disease failure using data mining techniques”-November 2016. [12] Sureiman Onchiri published a paper on “Conceptual model on application of Chi-square test in education and social science”-May 2013. [13] Kusiak A and Dixon B published a paper on “Predicting survival time for kidney dialysis patients: A data mining approach”-May 2005. [14] Veenita kunwar, Abhay bansal and Sai sabitha published a paper on “Chronic kidney disease analysis using data mining techniques”-July 2016. [15] Ronal A Fisher and Frank Yates published an article “Statistical tables for medical research, agriculture and biological”-1963
[16] Dona L. Hoyert published a paper on “Death preliminary data for 2011: National vital statistics report”-volume 61, November 6. [17] S. Gopika and Dr.M. Vanitha published a paper on “Efficiency of data mining techniques for predicting kidney disease”-November 2017. [18] Wllianallur Ragupathi and Viju Ragupathi published a paper on “Big data analytics in healthcare: promise and potential”-February 2014. [19] Sergio Moro and Paulo Cortez published a paper on “A data driven approach to predict the success of the bank telemarketing”-February 2014. [20] Alice Silva and Paulo Cortez published a paper on “Data mining to predict secondary student performance”.
[21] “Data mining concepts and techniques –second edition” by Jiawei Han and Micheline Kamber. [22] Peters and Steve G published a paper on “Big data and electronic health record”-September 2014. [23] Alan R. Weil published an article “Big data in health: A new era for research and patient care”-July 2014. [24] T. Huang and L. Lan published an article “Promises and challenges of Big data computing in Health sciences”.