Technology (IJRASET)
Segmentation and Classification of MR Images by
DWT and RBF
R. Karunya Packiya Jerry1, V. Josephine Sutha2 1
M.E student, 2AssociateProfessorDepartment of CSE Sardar Raja College of Engineering, Tamilnadu, India
Abstract---Diagnosing brain tumor is a crucial task. Brain which can be affected by number of problems like glioma the most frequent primary brain tumor in adults originating from glial cells, these could cause changes in brains normal structure and its normal behavior. Fusing several methods together based on their hierarchy, a powerful computational tool has been recently developed which is segmenting and classifying brain tumor based on neural networks. This method produces an efficient and automatic way of detecting the suspicious region/tumor in the central nervous system.
Keywords: Odema, MRI, Oncology/Tumor
I. INTRODUCTION
Computer technology has become widespread in medical decision support and ubiquitous across a wide range of medical area such as gastroenterology, brain tumor, cervical cancer etc... The evolution of brain tumor involves, automatic evaluation that are often monitored through MRI imaging system is of growing interest.Glioma is the deadliest form of brain tumor. It has been estimated that over 100,000 people are diagnosed with brain tumor every year.[1] Brain tumor owing to its size, extension and localization tumor structure may vary considerably. All these facts together present a serious challenge to detect the tumor and to find its unique characteristics. To address these problems, a large number of techniques have been implemented. This method focus on early detection and classification of brain tumor in clinical practice.[2]
The proposed method could be used by replacing the oldest and current basis assessment, image processing routines which automatically detect the brain tumor based on neural network. However developing such tool is technically challenging. Neural network which approximates the operation of human brain involves a large number of processors operating in parallel, with its own small sphere of knowledge and access to data in its local memory.[5] Generally neural network is a trained amount of data and rules which can tell the network how to behave and can initiate its activity on its own.
A novel supervised learning system that can efficiently produce high quality segmenters among MR image voxels using the parameters CCL, DWT and F-C segmentation. Finally from the initial classification that are able to capture the exact location of brain tumor and its unique characteristics is discussed.
II. EXISTING METHOD:
Brain tumor quantification has been increased significantly over the past decades. Around a quarter of such studies relies on revealed an automated method for tumor volumetry. Most of the existing algorithms focus on segmenting the glial tumor. Methodologically, many of the algorithm for segmentation are based on the technique of ROI segmentation, registration based, spatial distribution of different tissue types, joint segmentation and registration and so on.[4] While many technologies have been developed and tested for the applicability of tumor detection and classification. There has been some limitations in these algorithm which paved the way for exact detection of tumor region and classifying the tumor type using RBF with certain parametric measures.
III. PROPOSED METHODOLOGIES
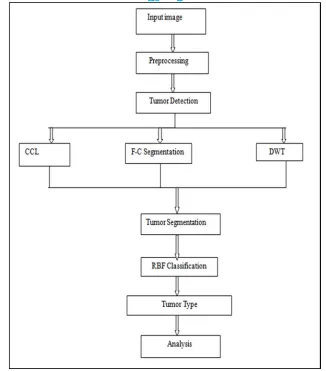
Fig. 1 Architecture of the Proposed System
A. Acquiring an iput:
The tumor model could be reviewed by acquiring normal or abnormal image to extract the nature/feature of the image.
B. Preprocessing
Normalizing the intensity of the individual image is done to enhance the data images by preprocessing. It is also used to remove masking portion and noise in the image.
C. Tumor Segmentation
The absolute determination of brain tumor requires a full 3D segmentation on digital images.[3][6] Given an image the segmentation task can be performed through 1) CCL 2) DWT 3) F-C segmentation.
D. Connected Component Label
It Scans the given image and groups its pixel into a component. In general the connected component shares a homogeneous pixel value. Once the image is grouped it paves the way for determining the gray level or color image.[7]
E. Discrete Wavelet Transforms
Technology (IJRASET)
Fig. 2 Diagrammatic representation of Discrete wavelet transform
F. F-C Segmentation
To analyze images with intelligence, fuzzy logic has been used in number of ways. It makes use of human like rules. In the proposed method a variation of the original fuzzy c means algorithm is used, i.e. it is used to group voxel into homogeneous groups, which gives consistent partition on the images.[8][9]
G. Tumor Classification
Classification of tumor is done through artificial neural network. The important goal of neural netwok is used for decision making operation, when using data outside trained data provides high reliability. The result of performance with neural network classification provides about 100% accuracy. The major component for the classification is RBF.
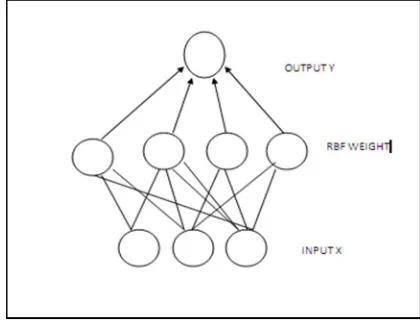
H. Radial Basis Function
RBF is a multilayer perception, given an image either normal or abnormal is to classify the tumor type and to exactly find the total suspicious region.[10] This is done by taking the weighted sum of each neuron in MLP. If the calculated output value is equal to the prototype then the output of RBF neuron will be 1. For each image the weight for the category 2RBF neuron are negative, and the weight of 1RBF neuron are positive.
Fig. 3 Diagrammatic representation of Neural Network
I. Analysis
The proposed method has been implemented on Matlab environment with processor P4,speed 1.6 GHZ.The image data set has been tested which are available at web consisting of normal and abnormal brain images. Generally, performance of each classification is done on the basis of sensitivity, specificity and accuracy. Sensitivity is the measurement of the probability of true positive results so that a person may have tumor. Specificity is themeasurement of probability of true negative results so that the person doesn’t have tumor. Accuracy is the determination of how accurately the results are classified
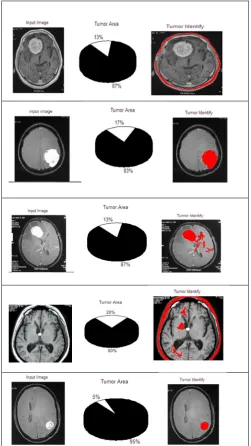
Fig. 4 Tumor region is extracted from the original malignant brain MR image with its area
Technology (IJRASET)
Image 1 Image 2 Image 3
Image 4 Image 5 Image 6 Fig.5 Input images for calculating accuracy
The above table shows the accuracy for the images which are mentioned below. The image 1 which has very low tumor area is found to have benign type tumor and its performance is accurately determined. Image 2, which has no tumor region, is found with 100% accuracy and the most hard type malignant tumor is also found with its accuracy.
Table: 1Performance Analysis of the Proposed Technique
V. CONCLUSION
This paper proposes an automated method for segmentation and classification of brain tumor using neural networks. The main contribution is focused towards detecting the type of the tumor with its characteristics by using the RBF classifier and also to find the exact area of the tumor region with main accuracy. Above all the threshold value gets evaluated with significant performance.
REFERENCES
[1] E. D. Angelini, O. Clatz, E. Mandonnet, E. Konukoglu, L. Capelle,and H. Duffau, “Glioma dynamics and computational models: A review of segmentation, registration, and in silico growth algorithms and their clinical applications,” Curr. Med. Imag. Rev., vol. 3, pp. 262–276, 2007.
[2] S. Bauer, R. Wiest, L.-P. Nolte, and M. Reyes, “A survey of MRI-based medical image analysis for brain tumor studies,” Phys. Med. Biol., vol. 58, no. 13, pp. IMAGE NAME TUMOR AREA TUMOR TYPE ACCURACY
1 2% Benign 98%
2 0% Normal 100%
3 5% Malignant 95%
4 6% Malignant 94%
5 10% Malignant 90%
[4] A. Gooya et al., “GLISTR: Glioma image segmentation and registration,” IEEE Trans. Med. Imag., vol. 31, no. 10, pp. 1941–1954, Oct. 2012. [5] A. Lefohn, J. Cates, and R. Whitaker, “Interactive, GPU-based level sets for 3D brain tumor segmentation,” in Proc.MICCAI, 2003, pp. 564–572. [6] C. Lee, S. Wang, A. Murtha, and R. Greiner, “Segmenting brain tumors using pseudo conditional random fields,” in Proc. MICCAI, 2008, pp. 359–366. [7] T. Riklin-Raviv, K. Van Leemput, B. H. Menze, W. M. Wells, 3rd, and P. Golland, “Segmentation of image ensembles via latent atlases,” Med. Image Anal.,
vol. 14, pp. 654–665, 2010.
[8] N. Subbanna, D. Precup, L. Collins, and T. Arbel, “Hierarchical probabilistic Gabor and MRF segmentation of brain tumours in MRI volumes,” Proc. MICCAI, vol. 8149, pp. 751–758, 2013.
[9] ” Automatic Image Segmentation using Wavelets” H C Sateesh Kumar 1, K B Raja2, Venugopal K R2 and L M Patnaik3 IJCSNS International Journal of Computer Science and Network Security, VOL.9 No.2, February 2009.