S t r o n g e r t o g e t h e r : c o m b i ni n g
a u t o m a t e d cl a s sifi e r s wi t h
m a n u a l p o s t-v ali d a ti o n o p ti miz e s
t h e w o r klo a d v s r e li a bility t r a d
e-off of s p e ci e s id e n tific a tio n in b a t
a c o u s ti c s u r v e y s
Ló p e z-B a u c e ll s, A, To r r e n t , L, Ro c h a , R, Bo b r o wi e c , P ED,
P al m e i ri m , JM a n d M e y er, C FJ
h t t p :// dx. d oi.o r g / 1 0 . 1 0 1 6 /j. e c oi nf. 2 0 1 8 . 1 1 . 0 0 4
T i t l e S t r o n g e r t o g e t h e r : c o m b i ni n g a u t o m a t e d cl a s sifi e r s wi t h m a n u a l p o s t-v ali d a ti o n o p ti miz e s t h e w o r kl o a d v s
r e li a bility t r a d e-off of s p e ci e s id e n tific a tio n in b a t a c o u s ti c s u r v ey s
A u t h o r s Ló p e z-B a u c ells, A, To r r e n t , L, R o c h a , R, Bo b r o wi e c , P ED, P al m e i ri m , JM a n d M e y er, C FJ
Typ e Ar ticl e
U RL T hi s v e r si o n is a v ail a bl e a t :
h t t p :// u sir. s alfo r d . a c . u k /i d/ e p ri n t/ 4 9 0 9 8 / P u b l i s h e d D a t e 2 0 1 8
U S IR is a d i gi t al c oll e c ti o n of t h e r e s e a r c h o u t p u t of t h e U n iv e r si ty of S alfo r d . W h e r e c o p y ri g h t p e r m i t s , f ull t e x t m a t e r i al h el d i n t h e r e p o si t o r y is m a d e f r e ely a v ail a bl e o nli n e a n d c a n b e r e a d , d o w nl o a d e d a n d c o pi e d fo r n o
Stronger together: Combining automated classifiers with manual post-validation
optimizes the workload vs reliability trade-off of species identification in bat acoustic
surveys
Adrià López-Baucells1,2,3*, Laura Torrent2, Ricardo Rocha1,3,4, Paulo E. D. Bobrowiec3, Jorge
M. Palmeirim1, Christoph F. J. Meyer1,3,4
1
University of Lisbon, Centre for Ecology, Evolution and Environmental Changes (cE3c),
Lisbon 1749-016 (Portugal).
2
Granollers Museum of Natural Sciences, Granollers 08402 Catalonia (Spain).
3
Biological Dynamics of Forest Fragments Project (BDFFP), National Institute for
Amazonian Research, Manaus 69011-970 (Brazil).
4
University of Cambridge, Department of Zoology, Conservation Science Group, Cambridge
CB23EJ (United Kingdom).
5
University of Salford, School of Environment and Life Sciences, Salford M54WT (United
Kingdom).
Abstract
Owing to major technological advances, bioacoustics has become a burgeoning field in
ecological research worldwide. Autonomous passive acoustic recorders are becoming widely
used to monitor aerial insectivorous bats, and automatic classifiers have emerged to aid
researchers in the daunting task of analyzing the resulting massive acoustic datasets.
However, the scarcity of comprehensive reference call libraries still hampers their wider
application in highly diverse tropical assemblages. Capitalizing on a unique acoustic dataset
of more than 650,000 bat call sequences collected over a 3-year period in the Brazilian
Amazon, the aims of this study were (a) to assess how pre-identified recordings of free-flying
and hand-released bats could be used to train an automatic classification algorithm (random
forest), and (b) to optimize acoustic analysis protocols by combining automatic classification
with visual validation, whereby we evaluated the proportion of sound files to be
post-validated for different thresholds of classification accuracy. Classifiers were trained at species
or sonotype (group of species with similar calls) level. Random forest models confirmed the
reliability of using calls of both free-flying and hand-released bats to train custom-built
automatic classifiers. To achieve a general classification accuracy of ~85%, random forest
had to be trained with at least 500 pulses per species/sonotype. For seven out of 20 sonotypes,
the most abundant in our dataset, we obtained high classification accuracy (>90%). Adopting
a desired accuracy probability threshold of 95% for the random forest classifier, we found that
the percentage of sound files required for manual post-validation could be reduced by up to
75%, a significant saving in terms of workload. Combining automatic classification with
manual ID through fully customizable classifiers implemented in open-source software as
demonstrated here shows great potential to help overcome the acknowledged risks and biases
associated with the sole reliance on automatic classification.
1. Introduction
Bioacoustics is a rapidly expanding field and of increasing importance for informing
conservation projects. This is largely due to recent technological advances and the rising
number of long-term monitoring programs which are being established for a number of taxa
(Dickinson et al. 2010; Kershenbaum et al. 2014), including birds (Gregory et al. 2005),
reptiles (Sewell et al. 2012), arthropods (Penone et al. 2013) and bats (Barlow et al. 2015).
Interest in bat monitoring has increased over the last decades since bats have been
acknowledged to provide important ecosystem services such as pest control (Boyles et al.
2013; Puig-Montserrat et al. 2015) and have been identified as good bioindicators of
ecosystem health (Jones et al. 2009; Cunto & Bernard 2012).
Autonomous ultrasound detectors have proven essential for optimizing surveys of aerial
insectivorous bats worldwide (Murray et al. 1999; Law et al. 2015). In the Neotropics, in
contrast to phyllostomid bats, aerial insectivores are rarely captured in mist-nets (MacSwiney
et al. 2008) and therefore, although they represent a high proportion of Neotropical bat
diversity (Jung & Kalko 2011), the ecology of many species remains elusive and their
echolocation calls poorly described (e.g. López-Baucells et al. 2014; López-Baucells et al.
2017a). In fact, despite enormous recent advances in recording technology and equipment,
comprehensive regional bat reference call libraries are currently lacking for much of the
tropics (Walters et al. 2013; Madhukumar Menon et al. 2018).
Reference call libraries containing echolocation calls from a wide range of locations and
habitats are crucial to reliably identify bat species acoustically. Although many species have
distinctive echolocation calls, those of others can be very ambiguous due to producing very
similar calls with overlapping characteristics (Russo & Voigt 2016). Moreover, weather
conditions (e.g. Lawrence & Simmons 1982), geographical location (e.g. López-Baucells et
age (e.g. Jones & Kokurewicz 1994), reproductive status (e.g. Jones & Ransome 1993) or
habitat structure (e.g. Pedro & Simonetti 2014) are all factors that contribute to substantial
variation in call structure within species.
Different algorithms such as discriminant function analysis and random forest have already
been used to automatically classify bat pulses (Russo & Jones 2002; MacSwiney et al. 2008;
Armitage & Ober 2010; Walters et al. 2012; Zamora-Gutiérrez et al. 2016). However,
substantial controversy still exists around the trade-off between the use of automatic
classifiers versus manual species identification (Kershenbaum et al. 2014; Russo & Voigt
2016). While the former allows for the rapid analysis of a large number of recordings using an
objective and repeatable protocol, manual identification provides more accurate, yet highly
subjective and non-reproducible results, apart from being considerably more time-consuming
(Kershenbaum et al. 2014). Unfortunately, even though considered a vital analysis step when
relying on automated classifiers, posterior visual cross-checking by an expert is all too often
neglected (Russo & Voigt 2016). Moreover, no study so far has quantified the potential time
savings from using automatic classifiers as a function of the classification accuracy threshold
adopted. Automatic classifiers have been criticised because of the inability to distinguish
amongst species with similar calls, and because their algorithms are typically trained with
calls from hand-released bats (Russo & Voigt 2016). It has been suggested that the use of
hand-release calls can compromise the reliability of species identifications since these calls
might be strongly affected by handling-related stress of the animal (Szewczak 2000).
Given that automatic classifiers are now widely available, there is a substantial risk that
beginners solely rely on automated species identification without proper manual
post-validation, which can result in incorrect identifications and thus wrong management decisions
and negative conservation outcomes (Russo & Voigt 2016). Automatic classifiers were first
acoustic datasets that are now typically accumulated using passive bat recorders (Russo &
Voigt 2016). However, the scarcity of suitable reference call libraries and the controversy
around automatic vs. manual classification still hamper their wider application, especially in
mega-diverse tropical regions.
The present study is the first to attempt to test the suitability of combining automatic
classifiers trained with pre-identified recordings of free-flying bats obtained in the study area
(which are much easier to obtain than reference calls from hand-released bats) with posterior
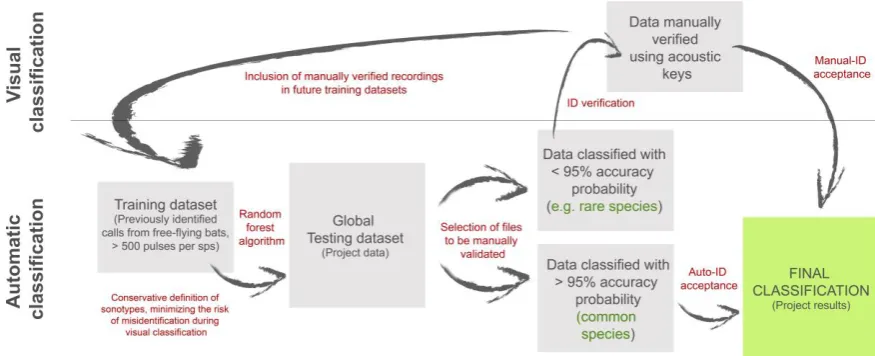
manual validation (Fig. 1). This approach addresses the aforementioned issues of geographic
variability, only classifies calls to the taxonomic level that the researcher can visually confirm
with certainty and gives the user full control and flexibility concerning implementation of the
algorithm. Capitalizing on a unique acoustic dataset collected over a 3-year period in the
Central Amazon, here we use random forest, a machine learning algorithm that has performed
well in previous bat acoustic studies (Zamora-Gutiérrez et al. 2016; Bas et al. 2017), to
automatically classify aerial insectivorous bats. We evaluated the discriminative ability of the
classifier by training it with a) previously identified calls from free-flying bats and those of
hand-released bats; and b) datasets of different sizes of reference echolocation calls. To
effectively combine the advantages of an automatic classifier with those of manual
identification requires establishing a “correct classification probability” threshold below
which a recording will need to be visually post-validated. Thus, to evaluate how acoustic
studies could be optimized in terms of time commitment for the analyses, we also calculated,
for different thresholds, the percentage of sound files from the full dataset that would need to
Figure 1. Diagram illustrating the classification process from automatic classification to
posterior visual validation. Squares represent the datasets and selections of recordings;
arrows and red text represent the analytical processes.
2. Material and Methods
2.1 Study site
The study was conducted at the Biological Dynamics of Forest Fragments Project (BDFFP), a
large-scale fragmentation experiment located ~80 km north of Manaus (Brazil) in the Central
Amazon (2°20’S, 60°6’W), aimed at assessing the impacts of fragmentation on tropical forest
communities (Laurance et al. 2011). Beginning in 1979, the BDFFP established 11
experimental forest fragments, which at the time of isolation were separated from continuous
forest by distances of 80-650 m. Nowadays the fragments are surrounded by a matrix of
secondary forest at varying successional stages (Laurance et al. 2017). The area is currently
composed of a mosaic of unflooded lowland forest (80-160 m a.s.l.), pastures and secondary
to 55 m tall (Laurance et al. 2011). Annual rainfall varies between 1900 and 3500 mm per
year, with a rainy season between November and June and a dry season from July to
November (Ferreira et al. 2017), while mean annual temperature usually oscillates between
26-30 ºC (de Oliveira & Mori 1999).
2.2 Mist-netting and hand-release recordings
Intensive bat sampling was carried out in the context of a larger project assessing
fragmentation effects on bats in the BDFFP landscape over a period of four years
(2011-2014), using both ground- and canopy-level mist-netting. Sampling covered various types of
rainforest habitats including continuous primary forest, forest fragments and secondary
regrowth (Farneda et al. 2015; Rocha et al. 2017a; Rocha et al. 2017b). Sporadic sampling
was also done over temporary lakes, small ponds and streams, as well as campsites, roads,
and pastures (Torrent et al. 2018). Mist-netting was usually conducted from 18:00 to 00:00,
except for some lakes where high capture rates sometimes required closing the nets earlier.
Captured bats were identified using different keys (Lim & Engstrom 2001; Gardner 2007).
Echolocation call recordings of captured aerial insectivorous bats were made with a
Pettersson D1000 bat detector (Pettersson Elektronik, Sweden), using 384 kHz sampling
frequency in full spectrum (16-bit resolution) and no triggers or filters. Release calls were
obtained after hand release of bats in either clearings or open areas within the forest (N=722
individuals). The detector was placed 5-10 m from the point of release (depending on the
species) and once the individual was in flight, the microphone was pointed towards it to
record as many search pulses as possible. For analysis, all pulses recorded immediately after
release were discarded, as were overloaded calls, those too faint (for which it was impossible
to distinct the shape from the background noise), social or stress calls, calls emitted in passive
2.3 Acoustic monitoring dataset
A total of 50 sites across the BDFFP landscape were acoustically surveyed 2012-2014,
including the same sites used for mist-netting as described in Rocha et al (2017a,b). These
comprised different-sized forest fragments (N=8), continuous forest (N=9), forest edges
(N=11), secondary forest (N=11) and forest clearings (N=11). At each recording point, an
automatic SM2Bat detector with an omnidirectional ultrasonic SMX-US microphone
(Wildlife Acoustics, Inc., USA) was placed ca. 1.5 m above the ground. Acoustic surveys
covered both dry and wet seasons and were conducted twice per season. Detectors were set to
automatically record bats from 18:00 to 06:00 in real time with a full spectrum resolution of
16 bit, a high-pass filter set at fs/32 (12 kHz), an adaptive trigger level relative to noise floor
of 18 SNR, and for periods of five consecutive nights per site. All recordings were split into
five-second long sequences. Within such a five-second sound file, a bat pass was defined as a
sequence with a minimum of two recognizable echolocation pulses per species (Millon et al.
2015; Appel et al. 2017; Torrent et al. 2018). This unit was used as a measure of activity
levels. A total of 1,088,940 sound files were acquired during the study period in which
~650,000 bat passes were identified.
2.4 Echolocation call analysis
Kaleidoscope v.4.0.4 software (Wildlife Acoustics Inc., USA) was used to visualize and
manually classify all bat passes from the acoustic monitoring dataset. Call sequences were
manually identified to species/sonotype level as in previous studies (Silva & Bernard 2017;
Torrent et al. 2018). For the purpose of this study, a sonotype was defined as a category that
grouped species with similar calls when it was not possible to clearly assign a call to a
particular species (Table S1). Call identification was based on a series of acoustic features and
standard measurements - call shape (CS), frequency of maximum energy (FME), start (SF),
followed the echolocation key in López-Baucells et al. (2016). Moreover, recordings were
also compared with a local reference call library compiled for the same study area over the
course of the whole 3-year sampling period. Call sequences or pulses that were too faint for
reliable identification (< 10 dB difference in power between background noise and FME of
the echolocation pulses) were discarded from the analysis.
In addition to this manual identification, the same recordings were also subjected to an
automatic identification process whereby pulse measurements were automatically extracted
(~4,788,000 pulses) using SCAN’R (Snapshot Characterization and Analysis Routine) v1.7.4.
(Binary Acoustic Technology, USA). Settings were adjusted as specified in Table S2 to
minimize the confusion between noise and bat calls. The following measurements were
extracted for all pulses: Duration (Dur, ms), Maximum frequency (Fmax, kHz), Minimum
frequency (Fmin, kHz), total bandwidth (BW, ms), Frequency at strongest sound pressure
level (Fdom, kHz; equivalent to FME or Frequency of maximum energy), percentage in
duration of Fdom (Ldom, %), High end of characteristic frequency (HiFc, kHz; equivalent of
the knee frequency), Low end of characteristic frequency (LowFc, kHz), global slope of the
call (Slope, kHz/ms), curvature (Curv) (SCAN'R 2009). After extraction, a Principal
Component Analysis (PCA) was performed, separately for each bat family, in order to
visualise how different species/sonotypes clustered based on the similarity of their acoustic
parameters.
2.5 Supervised machine learning
Supervised classification based on a machine learning algorithm (random forest, RF) was
conducted using the R package “caret” (Classification and Regression Training) (Kuhn 2008).
Random forest has performed well in several bat studies and is currently the preferred
machine learning algorithm for the classification of bat echolocation calls (e.g.
averaging decision tree classifiers that are designed by bootstrapping random samples of the
training dataset (Breiman 2001). Amongst its advantages, random forest is not affected by
heteroscedasticity, is not strongly affected by outliers or low-informative variables, and is
relatively easy to use computationally (Olden et al. 2008), which makes it the method of
choice for large acoustic datasets. In our case we selected three separate 10-fold
cross-validations to tune the training model, with a final value of mtry of 2 (chosen for their highest
accuracy) (Breiman 2001).
Data preparation. All pulse measurements were centred and scaled (Mukherjee & Manna
2006; Kuhn 2008) to make them comparable. The global dataset (~4,178,000 pulses) was split
into different training and testing subsets. Training datasets were composed of 50, 100, 500,
1000 and 2000 reference pulses per species/sonotype, which were randomly selected from all
recordings (except for Rhynchonycteris naso and Furipterus horrens, for which we only had
data from 12 and 1,000 pulses respectively).
Data classification. Using the 1000-pulse training dataset, we evaluated classification
accuracy and predictive power of the RF algorithm. Evaluation of performance of the training
algorithm on the testing datasets was based on the performance metrics accuracy and kappa.
Kappa measures inter-rater agreement for qualitative items (usually considered to be more
robust than other measures as it also takes into account the agreement occurring by chance)
(Viera & Garrett 2005). The same metrics were then additionally assessed for the
different-sized training datasets, ranging from 50 to 2000 pulses/sonotype. Variable (feature)
importance scores were also obtained using the R package caret (Kuhn 2008). The
contribution of each variable is measured as follows: For each tree, the prediction accuracy is
recorded removing each predictor variable. The average of the differences between all
Classification success for each species/sonotype was evaluated using 1) a RF model trained
with the 2000-pulse dataset based on calls of free-flying bats and 2) a RF model trained with
the complete reference call library based on hand-release calls compiled during the whole
3-year study period. The latter unfortunately included less than 2000 pulses for many species
(Table S3) due to the inherent difficulty to capture enough individuals from which to obtain
release calls. Both training datasets were classified using the same species/sonotype labels in
order to make both classifications comparable. Amongst the whole set of metrics commonly
used to evaluate classifiers, we selected sensitivity and positive predictive value (PPV) as the
most conservative for evaluating the performance of the acoustic classification task because
they highlight the true positives in the classification process (Jennings et al. 2008) (Fig. S1).
While sensitivity is the proportion of calls correctly identified as one species/sonotype out of
the total number of calls, positive predictive value is the proportion of calls correctly
identified as one species/sonotype out of the total number of calls identified as such. Other
metrics such as specificity or negative predictive value highlight the certainty of true
negatives, which is quite unreliable in multicategory classifications (Fig. S1).
The estimation of the percentage of recordings that would need to be manually checked
depending on several classification accuracy thresholds was also based on the 2000-pulse
training dataset. Classification accuracy thresholds considered in the analyses ranged from 60
to 95%, in 5% increments.
3. Results
3.1 Acoustic discrimination at family level
A total of 27 aerial insectivorous bat species from six different families were captured and
recorded during the study period, representing 20 different species/sonotypes (Table S1).
extraction often resulted in measurement values coming from different harmonics (Fig. 2).
Pteronotus alitonus and P. rubiginosus clearly separated as distinct clusters and, although less
evident, P. personatus and P. gymnonotus were also quite distinctly separated. Similarly,
species with modulated calls such as vespertilionid or furipterid bats were split in rather
well-defined bands. In contrast, except for Saccopteryx bilineata and S. leptura, emballonurid and
Figure 2. Principal component analyses (PCA) based on measurements of a series of acoustic
parameters (see Methods) that were automatically extracted with SCAN’R, and manually
classified to species/sonotype level following López-Baucells et al. (2016).
3.2 Minimum training dataset size and variable importance
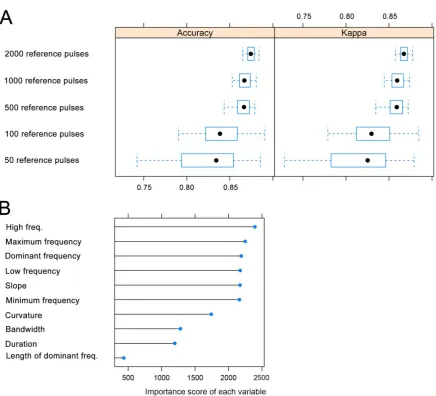
We found that, in order to achieve a minimum general accuracy of ~85%, a training dataset of
more than 500 pulses per species/sonotype was required (Fig. 3A). Classifications undertaken
with training datasets based on only 50 pulses showed large variation in accuracy, reaching
values below 75%. Classification performance was consistent between accuracy and kappa
metrics. “High end of characteristic frequency” (equivalent to the frequency of the knee) was
the most important variable in the RF model, followed by “Maximum frequency” and
“Dominant frequency” (equivalent to the frequency of maximum energy). However, except
for “Length of the dominant frequency”, “Duration”, “Bandwidth” and “Curvature”, all the
Figure 3. A) Classifier performance, evaluated as general accuracy and kappa, for a random
forest model built with different-sized training datasets (50 to 2000 pulses/sonotype). The
x-axis has been scaled to allow better visualization. Dots are medians, boxes 25% and 75%
quartiles and whiskers denote the range. B) Importance of each variable in the random forest
model trained with 2000 reference pulses per species/sonotype.
3.3 Classifier performance at species/sonotype level
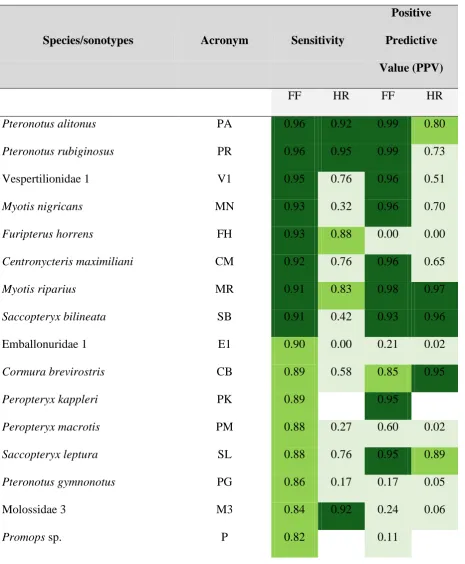
Algorithm performance varied substantially among species/sonotypes (Table S4). Seven had
values above 90% for both sensitivity and PPV (P. alitonus, P. rubiginosus, Vespertilionidae
[image:16.595.75.512.89.485.2]not only that most of the recordings were correctly assigned, but also that few other
recordings were confused with these species (Table 1, Table S4). On the other hand, for other
species such as Furipterus horrens, Emballonuridae 1, P. gymnonotus, Molossidae 3,
Promops spp. and P. personatus there were considerable differences between metrics. For
these, we found a low number of false negatives but a large number of false positives (low
PPV). Molossidae 1 and 2 were the sonotypes with poorest levels of correct identifications,
and R. naso (for which we had a very limited number of recordings) was the only species for
which the classifier completely failed. Comparing the RF models trained with calls from
free-flying vs. hand-released bats, the former nearly always outperformed the latter (Table 1).
Pteronotus alitonus and P. rubiginosus obtained a similar proportion of correct identifications
in both HR and FF algorithms, and Molossidae 3 was the only sonotype for which higher
sensitivity scores were obtained using calls from hand-released bats, although it also had
Table 1. Performance of the random forest classifier for each species/sonotype based on calls
from either free-flying (FF) or hand-released (HR) bats. Classification performance is ranked
according to sensitivity and positive predictive value (see Methods for an explanation of the
rationale underpinning this selection) as > 90% (dark green), 80 - 90% (olive green), and <
80% (light green).
Species/sonotypes Acronym Sensitivity
Positive
Predictive
Value (PPV)
FF HR FF HR
Pteronotus alitonus PA 0.96 0.92 0.99 0.80
Pteronotus rubiginosus PR 0.96 0.95 0.99 0.73
Vespertilionidae 1 V1 0.95 0.76 0.96 0.51
Myotis nigricans MN 0.93 0.32 0.96 0.70
Furipterus horrens FH 0.93 0.88 0.00 0.00
Centronycteris maximiliani CM 0.92 0.76 0.96 0.65
Myotis riparius MR 0.91 0.83 0.98 0.97
Saccopteryx bilineata SB 0.91 0.42 0.93 0.96
Emballonuridae 1 E1 0.90 0.00 0.21 0.02
Cormura brevirostris CB 0.89 0.58 0.85 0.95
Peropteryx kappleri PK 0.89 0.95
Peropteryx macrotis PM 0.88 0.27 0.60 0.02
Saccopteryx leptura SL 0.88 0.76 0.95 0.89
Pteronotus gymnonotus PG 0.86 0.17 0.17 0.05
Molossidae 3 M3 0.84 0.92 0.24 0.06
Pteronotus personatus PP 0.80 0.01 0.09 0.81
Molossidae 1 M1 0.71 0.01 0.37 0.01
Molossidae 2 M2 0.59 0.27 0.44 0.17
Rhynchonycteris naso RN 0.00 0.00 0.00 0.00
3.4 Combining automatic classification with manual post-validation
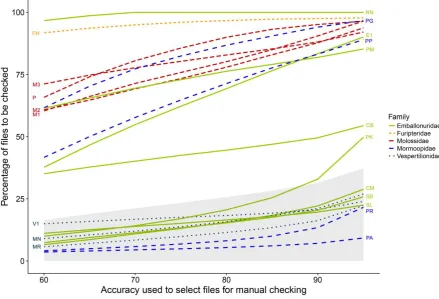
The total number of files to be visually confirmed after automatic classification ranged from
~20%, when the desired accuracy threshold was set to 60%, to ~30%, when it was set to 95%
(Fig. 4). Following the same pattern found for species/sonotype-specific predictive
performance (Table 1), for some categories the number of files to be post-validated did not
differ substantially for the different accuracy thresholds mentioned previously, while for
others, this percentage varied up to 30%. Only in few cases was there marked variation
depending on the chosen accuracy threshold (from 40 to 90% for Emballonuridae 1 and P.
Figure 4. Percentage of files requiring visual post-validation as a function of the desired
accuracy threshold for identification acceptance. Shaded area: Percentage of the whole
dataset. Coloured lines: Percentage for each family; Species acronyms are as given in Table 1.
Analysis was based on a random forest model, trained with 2000 pulses per species/sonotype
(with the exception of Rhynchonycteris naso and Furipterus horrens, for which we had fewer
[image:20.595.75.515.72.371.2]4. Discussion
Our analyses suggest an inexpensive and relatively user-friendly approach (Fig. 1) to
automatically classify large amounts of bat echolocation data, followed by visual
post-validation of a reduced proportion of the original acoustic dataset. This approach overcomes
the acknowledged risks and biases associated with the exclusive reliance on current automatic
classifiers (Russo & Voigt 2016). Using recordings obtained under real field conditions from
a 3-year-long study in the Central Amazon, we confirmed the reliability of using
locally-recorded echolocation calls from free-flying bats to train a custom-built classifier that
automatically identifies the calls of a large subset of the species/sonotypes in the local
assemblage with high accuracy (>90%) and leaves the rest to be manually classified. This
automatic pre-classification reduces the total number of recordings to be visually inspected,
therefore optimizing the classification process. This equates to considerable time savings,
especially in the case of projects that accumulate massive acoustic data. However, due to the
customizable nature of this approach, the advantages of using recordings from free-flying bats
hinge on manually pre-identifying a decent amount of calls from free-flying bats using release
calls as references, literature and echolocation keys. This obviously entails the risk of
including misidentified calls as a source for training the algorithm, a problem we overcame by
restricting the classification of the recordings to easily distinguishable species/sonotypes,
therefore avoiding misidentifications.
Being non-intrusive, automated recording systems and soundscape studies have recently
become very popular, and have considerably improved our knowledge about the natural
history of elusive bat species, anthropogenic impacts and wildlife conservation in habitats
where sampling by traditional methods such as mist-netting would be inefficient or unfeasible
(Kubista & Bruckner 2017). However, in developing countries where funding is particularly
cost-effective alternatives need to be found quickly. This has inspired a new trend towards
developing user-friendly detectors and automatic classifiers which are fully customizable at
reduced cost (Whytock et al. 2017; Hill et al. 2018). Reliance on self-built classification
algorithms could greatly contribute to studies in regions for which no automatic classifier is
available as part of commercially available software packages.
4.1 Minimum training dataset size and variable importance
We identified the minimum number of pulses that should be used in the training dataset in
order to achieve general accuracy levels between 75 and 95%. Our results show that training
the algorithm with 500 pulses per species/sonotype results in average classifier performance >
85%. However, this reference value should be interpreted carefully as it depends on whether
the species that are most frequently detected in a region are also those whose echolocation call
characteristics are more clearly distinct and thus the species more easily identifiable or not. In
our case, the most common species (P. rubiginosus, Myotis nigricans and M. riparius), all
easy to identify, might be positively biasing general accuracy, thus masking lower accuracies
for the remaining categories (Biscardi et al. 2004).
The variables that contribute most to separating species may not be the same in all
assemblages. For example, Monadjem et al. (2017) found that call duration represented one of
the most relevant parameters to distinguish between species, while in our study, we obtained
higher importance weights for several other variables. This probably reflects the diversity of
pulse shapes and structures found in Neotropical aerial insectivorous bats. By including
different variables in the algorithm, one can probably achieve better classification
performance in such highly diverse areas (Walters et al. 2013).
Random forest performed very well with our dataset, confirming its potential use for
analysing bat acoustic datasets. Among the available machine learning algorithms, random
forest has already been successfully used in automatic species classification for bats
(Armitage & Ober 2010; Zamora-Gutiérrez et al. 2016) and other taxa such as birds (Briggs et
al. 2009) and dolphins (Barkley et al. 2011). We obtained similar mean accuracies to those
found in previous studies, although results varied among species and families (e.g.
MacSwiney et al. 2008; Pio et al. 2010; Britzke et al. 2011; Zamora-Gutiérrez et al. 2016).
For Neotropical bats, large variability in predictive power is found for Vespertilionidae and
Molossidae, while Emballonuridae and Mormoopidae are usually more accurately identified
(Zamora-Gutiérrez et al. 2016). Previous studies have evaluated the performance of automatic
algorithms for classifying bat calls at species, genus, family or guild level (Zamora-Gutiérrez
et al. 2016; Vassilios et al. 2017). However, it is now widely accepted in the scientific
community that automatic classification must be used cautiously (Russo & Jones 2002; Russo
& Voigt 2016; Monadjem et al. 2017). In this study, we aimed to optimize the classifiers not
at species level but using sonotypes. Although classifying all calls to species level would be
ideal, using sonotypes may be sufficient in most cases, obviously depending on a project’s
specific aims (Redgwell et al. 2009; Armitage & Ober 2010).
For seven out of 20 species/sonotypes we obtained very high values (>90%) for both
sensitivity and PPV, proving that our random forest algorithm could be used with great
confidence to detect and automatically classify them in our recordings. Very few false
positives and false negatives were found, indicating that our classifier neither gets them
wrong, nor ignores them when they are present (see Table 1). These species are also the most
predominant in our dataset, which turns our classifier into a great tool due to its potential to
greatly reduce the number of files to be manually analysed (Andreassen et al. 2014). One of
of SCAN’R to detect and characterize pulses of different lengths (our SCAN’R pulse
detection settings were more suitable for long pulses). This will certainly improve soon with
new technological advances, or alternatively, could be better implemented through R sound
packages. Previous studies have exclusively used accuracy as a means of evaluating algorithm
performance and predictive capacity (i.e. Wordley et al. 2014; Zamora-Gutiérrez et al. 2016).
However, other more conservative metrics such as positive predictive value and sensitivity
are often neglected. We encourage developers of algorithms and researchers to better
scrutinize classifier performance by focusing on these more reliable metrics.
4.3 Classifier trained with calls from free-flying versus hand-released bats
We compared the performance of the random forest classifier trained with calls from
free-flying versus hand-released bats, using only data collected during the 3-year-period of the
project. Classifier performance was substantially better using recordings from free-flying bats,
probably due to the low number of recordings from hand-released bats for most of the species.
In this regard it is important to mention that the effort required to compile complete reference
call libraries of good quality using hand-released bats and which cover different
environmental situations is titanic (O'Farrell et al. 1999). In fact, this has probably
discouraged many researchers from developing their own classifiers so far.
Globally, echolocation call libraries are incomplete, especially in understudied regions such
as most of the tropics (Aguilar 2017). Due to species elusiveness, whispering behaviour or
rarity, call libraries are usually only built with calls from a few hand-released individuals
(Gager et al. 2016; Zamora-Gutiérrez et al. 2016; Monadjem et al. 2017). Although some
studies have not found marked differences in automatic classifiers trained with data from
distant regions (e.g. Zamora-Gutiérrez et al. 2016), other authors highlight the importance of
taking these differences into consideration (Thomas et al. 1987; Barclay et al. 1999; O'Farrell
comprehensive reference call libraries, our study suggests that training automatic classifiers
with manually identified free-flying bats is a very valid option if it is cautiously used in
conjunction with conservative classification criteria. As stressed by Jakobsen et al. (2013), it
is of vital importance to record calls from naturally behaving bats in the wild and use these
recordings to improve classifier performances.
4.4 Combining automatic classifiers with manual post-validation
No classifier has proved to provide 100% accuracy so far (Russo & Voigt 2016). Therefore,
some authors have recommended to manually validate all sound files (Kubista & Bruckner
2017), which inevitably annihilates or at least greatly reduces the advantages of having
automatic algorithms. In other cases, posterior cross-validation is completely neglected,
which greatly affects the reliability of the study. According to our findings, even when aiming
for an accuracy threshold of 95%, the remaining amount of data to be visually validated could
be reduced by up to 75%. This represents a substantial saving in terms of workload.
Different acoustic analysis software with automatic classifiers has been released on the
market in the last decades: batIdent (ecoObs, GmbH, Nürnberg, Germany), Kaleidoscope
(Wildlife Acoustics, USA), Sonochiro (Sonochiro, France), Sonobat (Sonobat, USA),
SCAN’R (Binary Acoustic Technology, USA) and more recently Tadarida (Bas et al. 2017),
multiplying the options available to researchers to use technological advances to aid acoustic
species identification. The best option for analysing the massive amounts of acoustic data
generated by the latest recording devices without compromising the reliability of results,
inevitably, lies in finding the right balance between automatic classification and manual
cross-validation. This is especially true for threatened or rare species for which false positives
will have greater conservation impact (Clement et al. 2014).
Our approach, while highly versatile, requires that researchers must: A) have good knowledge
about the bat fauna of the region (avoiding novice errors that result in misidentifications or
passive acceptance of the results from any classifier and acknowledging regional and habitat
variation), B) work together with experts on local call libraries and manual identifications, C)
be skilled in programming in R or similar software packages, thus being able to adjust
machine learning algorithms to particular situations, D) take into consideration both
sensitivity and positive predictive values rather than global accuracies, E) define their own
sonotypes conservatively (preventing classification to taxonomic levels that are not even
visually distinguishable). We also recommend to base selection criteria on the PPV as the
most conservative metric of performance (Armitage & Ober 2010) since false negatives are
always better than false positives.
5. Conclusions
Further research should focus on isolating and analysing individual call sequences instead of
pulses, and analyse the whole sonogram rather than the pulses one by one (Ren et al. 2009;
Damoulas et al. 2010; Kershenbaum et al. 2014). Our study shows how open-source
statistical tools and software can be used to develop algorithms attaining similar levels of
accuracy as commercial classifiers. However, their potential for wider application should be
further explored with echolocation datasets from other regions. We also demonstrated that
training algorithms with recordings from free-flying bats is possible and advisable if designed
to classify recordings at sonotype level. This approach is not conceived to replace the use of
calls from hand-released bats, but to aid in data management and classification with massive
datasets. Combined with the availability of new low-cost automatic detectors and powerful
supervised machine-learning algorithms, our analysis approach opens new opportunities for
long-term monitoring programs to be undertaken by researchers in megadiverse regions
monitoring is urgently needed, and fortunately, the technical and analytical tools are now at
6. Acknowledgements
We would like to thank Oriol Massana, Diogo Ferreira, Marta Acácio, Fabio Farneda,
Madalena Boto, Maria Mas, Gilberto Fernández and Eva Sánchez for fieldwork assistance
and José Luis Camargo, Rosely Hipólito, Ary Jorge Ferreira, Luiz Quiroz, Leo and Josimar
for logistical support. We thank two anonymous reviewers for helpful comments on an earlier
version of the manuscript. Xavier Puig-Montserrat and Carles Flaquer also deserve special
mention for their contribution to the discussion and continuous support. This work was
supported by the Portuguese Foundation for Science and Technology under grants
[PTDC/BIABIC/111184/2009] (CM), [SFRH/BD/80488/2011] (RR), [PD/BD/52597/2014]
(ALB) and by the Foundation for Research Support of the State of Amazonas [FAPEAM
062.01173/2015] (PEDB). Additional funding was provided by a Bat Conservation
International student research fellowship to ALB and RR. This is publication XXX in the
References
Aguilar, A.P.A. (2017). Morcegos insetívoros aéreos Neotropicais: identificação acústica e
padrões de estruturação de assembleias Universidade Federal do Rio Grande do Sul.
Porto Alegre. 135pp
Andreassen, T., Surlykke, A. & Hallam, J. (2014). Semi-automatic long-term acoustic
surveying: A case study with bats. Ecological Informatics 21, 13-24.
http://dx.doi.org/10.1016/j.ecoinf.2013.12.010
Appel, G., López-Baucells, A., Magnusson, E. & Bobrowiec, P.E.D. (2017). Aerial
insectivorous bat activity in relation to moonlight intensity. Mammalian Biology 85,
37-46. http://dx.doi.org/10.1016/j.mambio.2016.11.005
Armitage, D.W. & Ober, H.K. (2010). A comparison of supervised learning techniques in the
classification of bat echolocation calls. Ecological Informatics 5, 465-473.
http://dx.doi.org/10.1016/j.ecoinf.2010.08.001
Barclay, R.M.R., Fullard, J.H. & Jacobs, D.S. (1999). Variation in the echolocation calls of
the hoary bat (Lasiurus cinereus): influence of body size, habitat structure, and
geographic location. Canadian Journal of Zoology 77, 530-534.
http://doi.org/10.1139/z99-008
Barkley, Y., Oswald, J.N., Carretta, J.V., Rankin, S., Rudd, A. & Lammers, M.O. (2011).
Comparison of real-time and post-cruise acoustic species identification of dolphin
whistles using ROCCA (real-time odontocete call classification algorithm).
Department of Commerce. California
Barlow, K.E., Briggs, P.A., Haysom, K.A., Hutson, A.M., Lechiara, N.L., Racey, P.A. et al.
(2015). Citizen science reveals trends in bat populations: The National Bat Monitoring
Programme in Great Britain. Biological Conservation 182, 14-26.
Bas, Y., Bas, D. & Julien, J.-F. (2017). Tadarida: A toolbox for animal detection on acoustic
recordings. Journal of Open Research Software 5, 6.
http://dx.doi.org/10.5334/jors.154
Biscardi, S., Orprecio, J., Fenton, M.B., Tsoar, A. & Ratcliffe, J.M. (2004). Data, sample
sizes and statistics affect the recognition of species of bats by their echolocation calls.
Acta Chiropterologica 6, 347-363. http://doi.org/10.3161/001.006.0212
Boyles, J.G., Sole, C.L., Cryan, P.M. & McCracken, G.F. (2013). On estimating the economic
value of insectivorous bats: prospects and priorities for biologists. In: Bat Evolution,
Ecology, and Conservation New York, pp. 501-515.
Breiman, L. (2001). Random forests. Machine Learning 45, 5-32.
Briggs, F., Fern, X. & Raich, R. (2009). Acoustic classification of bird species from syllables:
an empirical study Oregon State University
Britzke, E.R., Duchamp, J.E., Murray, K.L., Swihart, R.K. & Robbins, L.W. (2011). Acoustic
identification of bats in the eastern United States: A comparison of parametric and
nonparametric methods. The Journal of Wildlife Management 75, 660-667.
http://dx.doi.org/10.1002/jwmg.68
Clement, M.J., Rodhouse, T.J., Ormsbee, P.C., Szewczak, J.M. & Nichols, J.D. (2014).
Accounting for false-positive acoustic detections of bats using occupancy models.
Journal of Applied Ecology 51, 1460-1467. 10.1111/1365-2664.12303
Cunto, G.C. & Bernard, E. (2012). Neotropical bats as indicators of environmental
disturbance: What is the emerging message? Acta Chiropterologica 14, 143-151.
http://dx.doi.org/10.3161/150811012X654358
Damoulas, T., Henry, S., Farnsworth, A., Lanzone, M. & Gomes, C. (2010). Bayesian
Proceedings of the Ninth International Conference on Machine Learning and
Applications, pp. 424-429.
de Oliveira, A.A. & Mori, S.A. (1999). A central Amazonian terra firme forest. I. High tree
species richness on poor soils. Biodiversity and Conservation 8, 1219-1244.
http://dx.doi.org/10.1023/A:1008908615271
Dickinson, J.L., Zuckerberg, B. & Bonter, D.N. (2010). Citizen science as an ecological
research tool: challenges and benefits. Annual Review of Ecology and Systematics 41,
149-172. http://doi.org/10.1146/annurev-ecolsys-102209-144636
Farneda, F.Z., Rocha, R., López-Baucells, A., Groenenberg, M., Silva, I., Palmeirim, J.M. et
al. (2015). Trait-related responses to habitat fragmentation in Amazonian bats.
Journal of Applied Ecology 52, 1381-1391.
http://dx.doi.org/10.1111/1365-2664.12490
Ferreira, D.F., Rocha, R., López-Baucells, A., Farneda, F.Z., Carreiras, J.M.B., Palmeirim,
J.M. et al. (2017). Season-modulated responses of Neotropical bats to forest
fragmentation. Ecology and Evolution 7, 4059-4071.
http://dx.doi.org/10.1002/ece3.3005
Gager, Y., Tarland, E., Lieckfeldt, D., Menage, M., Botero-Castro, F., Rossiter, S.J. et al.
(2016). The value of molecular vs. morphometric and acoustic information for species
identification using sympatric molossid bats. PLoS ONE 11, e0150780.
http://dx.doi.org/10.1371/journal.pone.0150780
Gardner, A.L. (2007). Mammals of South America 1: marsupials, xenarthrans, shrews, and
bats. University of Chicago Press. Chicago. 690pp
Gregory, R.D., Van Strien, A., Vorisek, P., Meyling, A.W.G., Noble, D.G., Foppen, R.P. et
the Royal Society of London Series B-Biological Sciences 360, 269-288.
http://dx.doi.org/10.1098/rstb.2004.1602
Hill, A.P., Prince, P., Covarrubias, E.P., Doncaster, C.P., Snaddon, J.L. & Rogers, A. (2018).
AudioMoth: Evaluation of a smart open acoustic device for monitoring biodiversity
and the environment. Methods in Ecology and Evolution, Online preview.
http://dx.doi.org/10.1111/2041-210X.12955
Jakobsen, L., Brinkløv, S. & Surlykke, A. (2013). Intensity and directionality of bat
echolocation signals. Frontiers in Physiology 4, 89.
http://dx.doi.org/10.3389/fphys.2013.00089
Jennings, N., Parsons, S. & Pocock, M.J.O. (2008). Human vs. machine: identification of bat
species from their echolocation calls by humans and by artificial neural networks.
Canadian Journal of Zoology 86, 371-377. 10.1139/z08-009
Jones, G., Jacobs, D.S., Kunz, T.H., Willig, M.R. & Racey, P.A. (2009). Carpe noctem: the
importance of bats as bioindicators. Endangered Species Research 8, 93-115.
http://dx.doi.org/10.3354/esr00182
Jones, G. & Kokurewicz, T. (1994). Sex and age variation in echoloction calls and flight
morphology of Daubenton's bats Myotis daubentonii. Mammalia 58, 41-50.
http://dx.doi.org/10.1515/mamm.1994.58.1.41
Jones, G. & Ransome, R.D. (1993). Echolocation calls of bats are influenced by maternal
effects and change over lifetime. Proceedings of the Royal Society - Biological
Sciences 252, 125-128. http://dx.doi.org/10.1098/rspb.1993.0055
Jung, K. & Kalko, E.K.V. (2011). Adaptability and vulnerability of high flying Neotropical
aerial insectivorous bats to urbanization. Diversity and distributions 17, 262-274.
Kershenbaum, A., Blumstein, D.T., Roch, M.A., Akcay, C., Backus, G., Bee, M.A. et al.
(2014). Acoustic sequences in non-human animals: a tutorial review and prospectus.
Biological Reviews of the Cambridge Philosophical Society 91, 13-52.
http://dx.doi.org/10.1111/brv.12160
Kubista, C.E. & Bruckner, A. (2017). Within-site variability of field recordings from
stationary, passively working detectors. Acta Chiropterologica 19, 189-197.
http://dx.doi.org/10.3161/15081109acc2017.19.1.015
Kuhn, M. (2008). Caret package. Journal of Statistical Software 28, 1-26.
Laurance, W.F., Camargo, J.L.C., Fearnside, P.M., Lovejoy, T.E., Williamson, G.B.,
Mesquita, R.C.G. et al. (2017). An Amazonian rainforest and its fragments as a
laboratory of global change. Biological Reviews of the Cambridge Philosophical
Society 93, 223-247. http://dx.doi.org/10.1111/brv.12343
Laurance, W.F., Camargo, J.L.C., Luizao, R.C.C., Laurance, S.G., Pimm, S.L., Bruna, E.M.
et al. (2011). The fate of Amazonian forest fragments: A 32-year investigation.
Biological Conservation 144, 56–67. http://dx.doi.org/10.1016/j.biocon.2010.09.021
Law, B., Gonsalves, L., Tap, P., Penman, T. & Chidel, M. (2015). Optimizing ultrasonic
sampling effort for monitoring forest bats. Austral Ecology 40, 886–897.
http://dx.doi.org/10.1111/aec.12269
Lawrence, B.D. & Simmons, J.A. (1982). Measurements of atmospheric attenuation at
ultrasonic frequencies and the significance for echolocation by bats. Journal of the
Acoustical Society of America 71, 585-590. http://dx.doi.org/10.1121/1.387529
Lim, B.K. & Engstrom, M.D. (2001). Bat community structure at Iwokrama Forest, Guyana.
Journal of Tropical Ecology 17, 647-665.
López-Baucells, A., Rocha, R., Bobrowiec, P.E.D., Bernard, E., Palmeirim, J. & Meyer, C.
(2016). Field Guide to Amazonian Bats. INPA. Manaus. 174pp
López-Baucells, A., Rocha, R., Fernández-Arellano, G., Bobrowiec, P.E.D., Palmeirim, J.M.
& Meyer, C.F.J. (2014). Echolocation of the big red bat Lasiurus egregius
(Chiroptera: Vespertilionidae) and first record from the Central Brazilian Amazon.
Studies on Neotropical Fauna and Environment 49, 18-25.
http://dx.doi.org/10.1080/01650521.2014.907600
López-Baucells, A., Rocha, R., Tavares, V.C., Mora, L., Bobrowiec, P.E.D., Silva, S.E. et al.
(2017a). Molecular, morphological and acoustic identification of Eumops maurus and
E. hansae (Chiroptera: Molossidae) with new reports from Central Amazonia.
Tropical Zoology. http://doi.org/10.1080/03946975.2017.1382284
López-Baucells, A., Torrent, L., Rocha, R., Pavan, A.C., Bobrowiec, P.E.D. & Meyer, C.F.J.
(2017b). Geographical variation in the high-duty cycle echolocation of the cryptic
common mustached bat Pteronotus cf. rubiginosus (Mormoopidae). Bioacoustics,
1-17. http://dx.doi.org/10.1080/09524622.201-17.1357145
MacSwiney, G.C., Clarke, F.M. & Racey, P.A. (2008). What you see is not what you get: the
role of ultrasonic detectors in increasing inventory completeness in Neotropical bat
assemblages. Journal of Applied Ecology 45, 1364-1371.
http://dx.doi.org/10.1111/j.1365-2664.2008.01531.x
Madhukumar Menon, A., João Ramos Pereira, M. & Moura de Souza Aguiar, L. (2018). Are
automated acoustic identification software reliable for bat surveys in the Neotropical
region? PeerJ. 10.7287/peerj.preprints.26712v1
Millon, L., Julien, J.-F., Julliard, R. & Kerbiriou, C. (2015). Bat activity in intensively farmed
landscapes with wind turbines and offset measures. Ecological Engineering 75,
Monadjem, A., Shapiro, J.T., Mtsetfwa, F., Reside, A.E. & McCleery, R.A. (2017). Acoustic
call library and detection distances for bats of swaziland. Acta Chiropterologica 19,
175-187. http://dx.doi.org/10.3161/15081109acc2017.19.1.014
Mukherjee, G. & Manna, S.S. (2006). Weighted scale-free networks in Euclidean space using
local selection rule. Physical Review E 74, 036111.
http://doi.org/10.1103/PhysRevE.74.036111
Murray, K.L., Britzke, E.R., Hadley, B.M. & Robbins, L.W. (1999). Surveying bat
communities: a comparison between mist nets and the Anabat II bat detector system.
Acta Chiropterologica 1, 105-112.
O'Farrell, M.J., Corben, C. & Gannon, W.L. (2000). Geographic variation in the echolocation
calls of the hoary bat (Lasiurus cinereus). Acta Chiropterologica 2, 185-196.
O'Farrell, M.J., Miller, B.W. & Gannon, W.L. (1999). Qualitative identification of free-flying
bats using the Anabat detector. Journal of Mammalogy 80, 11-23.
http://dx.doi.org/10.2307/1383203
Olden, J.D., Lawler, J.J. & Poff, N.L. (2008). Machine learning methods without tears: a
primer for ecologists. The Quarterly review of biology 83, 171-193.
http://doi.org/10.1086/587826
Pedro, A.R.-S. & Simonetti, J.A. (2014). Variation in search-phase calls of Lasiurus varius
(Chiroptera: Vespertilionidae) in response to different foraging habitats. Journal of
Mammalogy 95, 1004-1010. http://doi.org/10.1644/13-MAMM-A-327
Penone, C., Le Viol, I., Pellissier, V., Julien, J.-F., Bas, Y. & Kerbiriou, C. (2013). Use of
large‐scale acoustic monitoring to assess anthropogenic pressures on orthoptera
Pio, D.V., Clarke, F.M., Mackie, I. & Racey, P.A. (2010). Echolocation calls of the bats of
Trinidad, West Indies: is guild membership reflected in echolocation signal design?
Acta Chiropterologica 12, 217-229. http://doi.org/10.3161/150811010X504716
Puechmaille, S.J., Borissov, I.M., Zsebok, S., Allegrini, B., Hizem, M., Kuenzel, S. et al.
(2014). Female mate choice can drive the evolution of high frequency echolocation in
bats: A case study with Rhinolophus mehelyi. PLoS ONE 9, e103452.
http://dx.doi.org/10.1371/journal.pone.0103452
Puig-Montserrat, X., Torre, I., López-Baucells, A., Guerrieri, E., Monti, M.M., Rafols-Garcia,
R. et al. (2015). Pest control service provided by bats in Mediterranean rice paddies:
linking agroecosystems structure to ecological functions. Mammalian Biology 80,
237-245. http://doi.org/10.1016/j.mambio.2015.03.008
Redgwell, R.D., Szewczak, J.M., Jones, G. & Parsons, S. (2009). Classification of
echolocation calls from 14 species of bat by support vector machines and ensembles
of neural networks. Algorithms 2, 907-924. http://dx.doi.org/10.3390/a2030907
Ren, Y., Johnson, M.T., Clemins, P.J., Darre, M., Glaeser, S.S., Osiejuk, T.S. et al. (2009). A
framework for bioacoustic vocalization analysis using hidden markov models.
Algorithms 2, 1410-1428. http://dx.doi.org/10.3390/a2041410
Rocha, R., López-Baucells, A., Farneda, F.Z., Groenenberg, M., Bobrowiec, P.E.D., Cabeza,
M. et al. (2017a). Consequences of a large-scale fragmentation experiment for
Neotropical bats: disentangling the relative importance of local and landscape-scale
effects. Landscape Ecology 32, 31–45. http://dx.doi.org/10.1007/s10980-016-0425-3
Rocha, R., Ovaskainen, O., López-Baucells, A., Farneda, F.Z., Ferreira, D.F., Bobrowiec,
P.E.D. et al. (2017b). Design matters: An evaluation of the impact of small man-made
forest clearings on tropical bats using a before-after-control-impact design. Forest
Russo, D. & Jones, G. (2002). Identification of twenty-two bat species (Mammalia:
Chiroptera) from Italy by analysis of time-expanded recordings of echolocation calls.
Journal of Zoology 258, 91–103. http://dx.doi.org/10.1017/S0952836902001231
Russo, D. & Voigt, C.C. (2016). The use of automated identification of bat echolocation calls
in acoustic monitoring: A cautionary note for a sound analysis. Ecological Indicators
66, 598-602. http://dx.doi.org/10.1016/j.ecolind.2016.02.036
SCAN'R (2009). SCAN’R Snapshot Characterization and Analysis Software manual. Binary
Acoustic Technology, p. 35.
Sewell, D., Guillera-Arroita, G., Griffiths, R.A. & Beebee, T.J. (2012). When is a species
declining? Optimizing survey effort to detect population changes in reptiles. PLoS
ONE 7, e43387. http://doi.org/10.1371/journal.pone.0043387
Silva, C.R. & Bernard, E. (2017). Bioacoustics as an Important Complementary Tool in Bat
Inventories in the Caatinga Drylands of Brazil. Acta Chiropterologica 19, 409-418.
10.3161/15081109acc2017.19.2.017
Szewczak, J. (2000). A tethered zip-line arrangement for reliably collecting bat echolocation
reference calls. Bat Research News 41, 142.
Thomas, D.W., Bell, G.P. & Fenton, M.B. (1987). Variation in echolocation call frequencies
recorded from North American vespertilionid bats: A cautionary note. Journal of
Mammalogy 68, 842-847. http://dx.doi.org/10.2307/1381562
Torrent, L., López-Baucells, A., Rocha, R., Bobrowiec, P.E.D., Meyer, C.F.J., Pettorelli, N. et
al. (2018). The importance of lakes for bat conservation in Amazonian rainforests: an
assessment using autonomous recorders. Remote Sensing in Ecology and
Vassilios, S., Veronica, Z.-G., E., J.K. & Mark, G. (2017). Bat echolocation call identification
for biodiversity monitoring: a probabilistic approach. Journal of the Royal Statistical
Society: Series C (Applied Statistics) 67, 165-183. doi:10.1111/rssc.12217
Viera, A.J. & Garrett, J.M. (2005). Understanding Interobserver Agreement: The Kappa
Statistic. Research Series 37, 360.
Vihinen, M. (2012). How to evaluate performance of prediction methods? Measures and their
interpretation in variation effect analysis. In: BMC genomics. BioMed Central, p. S2.
Walters, C.L., Collen, A., Lucas, T., Mroz, K., Sayer, C.A. & Jones, K.E. (2013). Challenges
of using bioacoustics to globally monitor bats. In: Bat Evolution, Ecology, and
Conservation. Springer, pp. 479-499.
Walters, C.L., Freeman, R., Collen, A., Dietz, C., Fenton, M.B., Jones, G. et al. (2012). A
continental-scale tool for acoustic identification of European bats. Journal of Applied
Ecology 49, 1064-1074. http://dx.doi.org/10.1111/j.1365-2664.2012.02182.x
Whytock, R.C., Christie, J. & Jones, K. (2017). Solo: an open source, customizable and
inexpensive audio recorder for bioacoustic research. Methods in Ecology and
Evolution 8, 308-312. http://dx.doi.org/10.1111/2041-210x.12678
Wordley, C.F.R., Foui, E.K., Mudappa, D., Sankaran, M. & Altringham, J.D. (2014).
Acoustic identification of bats in the Southern Western Ghats, India. Acta
Chiropterologica 16, 213-222. http://dx.doi.org/10.3161/150811014x683408
Zamora-Gutiérrez, V., López-Gonzalez, C., MacSwiney González, M.C., Fenton, B., Jones,
G., Kalko, E.K.V. et al. (2016). Acoustic identification of Mexican bats based on
taxonomic and ecological constraints on call design. Methods in Ecology and