© 2015, IRJET ISO 9001:2008 Certified Journal Page 497
Implementation of Lossless Huffman Coding: Image compression using
K-Means algorithm and comparison vs. Random numbers and Message
source
Ali Tariq Bhatti
1, Dr. Jung Kim
21,2
Department of Electrical & Computer engineering, NC A&T State University, Greensboro NC USA
Email:
1[email protected], [email protected], [email protected],
---***---Abstract -
In this research paper, the analysis ofHuffman coding to do compression using MATLAB programming software in three ways such as (1)Huffman coder to do the compression for the source of the 5 random number assumptions for A = {a1, a2, a3, a4, a5}, with p(a1)=p(a3)=0.2, p(a2)=0.4, and p(a4)=p(a5)=0. Before compression, assume that each letter takes 3 bits to transmit. Performance metrics used as to compute the entropy, the theoretical average word length after compression, and compression ratio. (2) Huffman coder to do the compression for the message source which lies in the 26 English letters. Its probabilities of occurrence are assumed to be taken randomly. Before compression, assume that each letter takes 5 bits to transmit. (3) Image compression is applied for lossless Huffman coding using K-Means algorithm for default threshold of 0.2 of block size ’M’ and codebook size ‘N’ to decompress it. The following performance metrics used as to compute the entropy, the theoretical average word length after compression, and compression ratio for three different ways to see which one of the way is better. Also, compute the actual average word length for the message, “The process of using the panchromatic band to improve the low spatial resolution and preserve the spectral information is called pansharpening.” In this research paper, performance metrics for three different ways notifies that more the compression ratio of Huffman coding , the lesser will be the entropy and average length as by if increasing the threshold value or not. In addition, the Huffman coding using random numbers show less entropy result as compare to Message display using 26 alphabet characters, and image compression using K-Means algorithm.
Key Words:- Huffman Coding, K-Means algorithm, Compression Ratio, Entropy, Average Length.
1. Introduction
Compression is the art of representing the information in a compact form rather than its original or uncompressed form [1]. Lossless compression techniques are used to compress medical images, text and images preserved for legal reasons, computer executable file and so on [5]. Lossy compression techniques reconstruct the original message with loss of some information. It is not possible to reconstruct the original message using the decoding process, and is called irreversible compression [6].
1.1 Huffman Coding
Huffman coding is regarded as one of the most successful loseless compression techniques. Huffman coding [2] is based on the frequency of occurrence of a data item (pixel in images). The key is to have both encoder and decoder to use exactly the same initialization and update model routines. Update model does two things: (a) increment the count, (b) update the Huffman tree [3]. It is used commonly for compression of both audio and images. Huffman coding is an entropy encoding algorithm used for lossless data compression. It provides the least amount of information bits per source symbol.
© 2015, IRJET ISO 9001:2008 Certified Journal Page 498 symbol. Huffman codes, with the shortest codes assigned
to the characters with the greatest frequency.
As in this paper, a Huffman coder will go through the source text file, convert each character into its appropriate binary Huffman code, and dump the resulting bits to the output file. The Huffman codes won't get mixed up in decoding. The best way to see that is to envision the decoder cycling through the tree structure, guided by the encoded bits it reads, moving from top to bottom and then back to the top.
Huffman coding gives a great deal of compression gain. In fact that Huffman coding is lossless, makes it a very attractive option for any high coder compression rate with no degradation in quality. The main disadvantage of Huffman coding is that it requires more computational power and time. For a set of symbols with a uniform probability distribution and a number of members which is a power of two, Huffman coding is equivalent to simple binary block encoding [4] e.g., ASCII coding.
(a) Entropy
Entropy can be defined as the average number of binary symbols needed to encode the output of the source. So, entropy is
(b)Average Length
Average Length is the summation of each probability multiplied by number of bits in the word. The code-word for each symbol is obtained traversing the binary tree from its root to the leaf corresponding to the symbol. Symbols with the highest frequencies end up at the top of the tree, and result in the shortest codes [7]. The average length of the code is given by the average of the product of probability of the symbol and number of bits used to encode it. More information can found in [8] [9]. So, Average length= L= ∑ P(ai) n(ai)
(c)Compression Ratio
Compression Ratio is the ratio of compressed size ‘No’ to the uncompressed size ‘Nc’. It is given as: Compression Ratio =No/Nc.
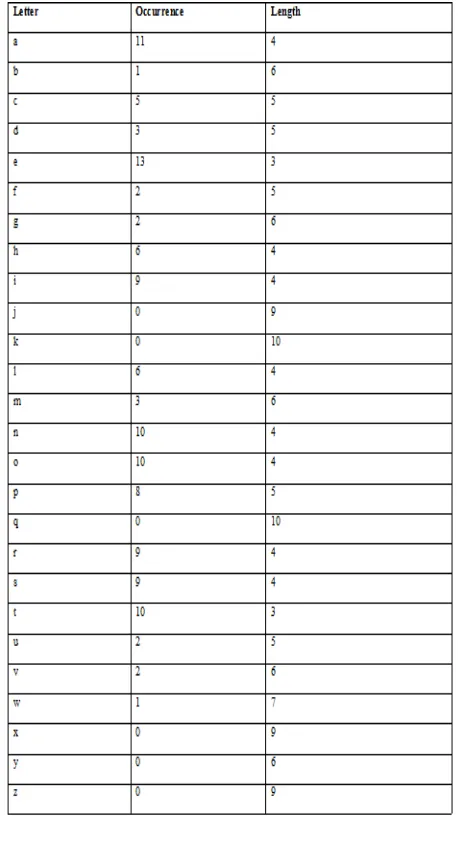
(d)Actual Average Word Length
Actual Average Word Length is defined as ∑Oi * Li/∑Oi.
Where Li represents the bit length associated with the
corresponding letter and Oi is the number of occurrences
of each letter.
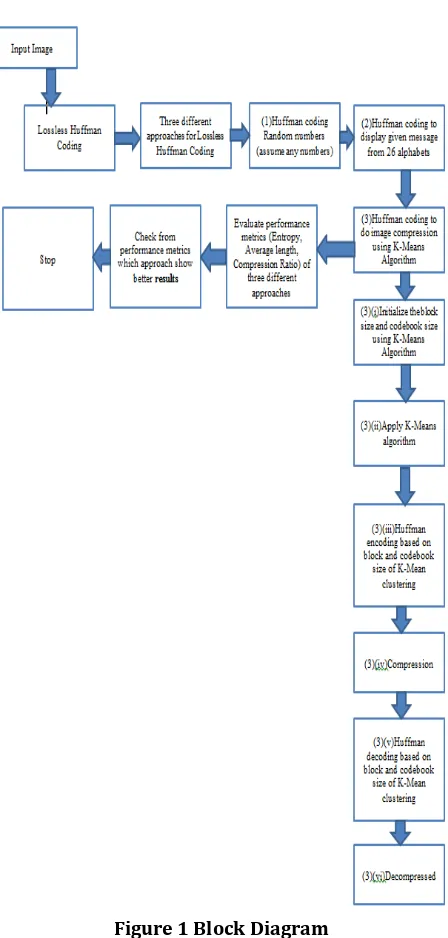
[image:2.595.323.547.209.678.2]2.
Block Diagram ImplementationFigure 1 Block Diagram
© 2015, IRJET ISO 9001:2008 Certified Journal Page 499 3. Analysis of Results using MATLAB
From block diagram implementation, following steps are used in this research paper.
(a)Huffman coding using 5 random numbers
The following 5 random number sets are used for Huffman coder to do the compression such as assume A = {a1, a2, a3, a4, a5}, with p(a1)=p(a3)=0.2, p(a2)=0.4, and p(a4)=p(a5)=0.1
Results Code-word 0 1
1
0 0 0
0 0 1 0
0 0 1 1
Entropy is: 2.12 Average length is: 2.20 Compression ratio is: 1.36
(b)Huffman coding using message source
Assume the following message is as “The process of using the panchromatic band to improve the low spatial resolution and preserve the spectral information is called pansharpening”. Also assume the probabilities of 26 alphabet characters are as
p=[0.057305,0.014876,0.025775,0.026811,0.112578 ,0.022875,0.009523,0.042915,0.053474,0.002031,0. 001016,0.031403,0.015892,0.056035,0.058215,0.02 1034,0.000973,0.048819,0.060289,0.078085,0.0184 74,0.009882,0.007576,0.002264,0.011702,0.001502 ]';
The sum of all probability is:0.79. The scale probabilities implemented from MATLAB is scaled =
0.0724 0.0188 0.0326
0.0339 0.1423 0.0289 0.0120 0.0542 0.0676 0.0026 0.0013 0.0397 0.0201 0.0708 0.0736 0.0266 0.0012 0.0617 0.0762 0.0987 0.0233 0.0125 0.0096 0.0029 0.0148 0.0019
sum of all probability of scaled table is: 1.00 Code-word
0 0 1 1
1 0 0 0 0 0
1 0 0 0 1
0 0 1 0 1
0 1 0
1 0 1 0 0
1 1 1 0 0 1
1 0 1 1
0 1 1 1
0 0 1 0 0 1 0 0 1
0 0 1 0 0 1 0 1 0 0
1 1 1 1
© 2015, IRJET ISO 9001:2008 Certified Journal Page 500 0 1 1 0
0 0 0 1
1 0 1 0 1
0 0 1 0 0 1 0 1 0 1
1 0 0 1
0 0 0 0
1 1 0
1 1 1 0 1
1 1 1 0 0 0
0 0 1 0 0 1 1
0 0 1 0 0 1 0 0 0
1 0 0 0 0 1
0 0 1 0 0 1 0 1 1
Entropy is: 4.12 Average length is: 4.14 Compression ratio is: 1.21
Actual average word length is: 4.13
Results with probability, scaled probability, code-word, and calculated length
© 2015, IRJET ISO 9001:2008 Certified Journal Page 501 Table 2
(c) Image Compression using K-Means algorithm
(i) K-Means Algorithm:
K-Means Algorithm is the Clustering algorithm that
follows a simple way to classify a given data set through a certain number of clusters. The main idea behind K-Means Algorithm is to define ‘K’ centroids in K-Means algorithm, one for each cluster. These centroids should be placed in the best way, so they are much as possible far away from each other. One of the disadvantages of K-Means Algorithm is to
ignore measurement errors, or uncertainty,
associated with the data and it is also known as Error based Clustering.
Quantization is the process of limiting real numbers to discrete integer values. Vector quantization is a lossy compression technique based on block coding. It maps a vector to a codeword drawn from a predesigned codebook with the goal of minimizing distortion. K-Means is an unsupervised machine learning technique. The basic idea of the K-means cluster is to place N data points in an l-dimensional space into K clusters.
Step 1: Initialization of the size of block ‘M’ and size of codebook ‘N’ for different scenarios
Step 2: Quantizing K- Mean clustering for an image There are 4 cases to use K-Mean Algorithm, which are as:
(a) Initialize a set of training vectors with any variable as ‘X’ and we need a codebook of size N as in this case.
(b) Second case is to randomly choose M dimensional or block vectors as the initial set of code words in the codebook.
(c) Third case is to search for nearest neighbor for each training vector. This will allow finding the codeword in the current codebook which seems to be closest in terms of spectral distance and assign that vector to the corresponding cell.
(d) Finally update the Centroid for the code word in each cell using the training vectors assigned to that cell. In this case 4, repeat case 2 and 3 again and again until the procedure converges or Average distance falls below a preset threshold.
(ii) Huffman Encoding
© 2015, IRJET ISO 9001:2008 Certified Journal Page 502 (iii) Huffman Decoding
Before starting the compression of a data file, the encoder has to determine the codes. It does that based on the probabilities of frequencies of occurrence of the symbols. The probabilities or frequencies have to be written, as side information, on the output, so that any Huffman decoder will be able to decompress the data. This is easy, because the frequencies are integers and the probabilities can be written as scaled integers. It normally adds just a few hundred bytes to the output. It is also possible to write the variable-length codes themselves on the output, but this may be awkward, because the codes have different sizes. It is also possible to write the Huffman tree on the output [11], but this may require more space than just the frequencies. In any case, the decoder must know what is at the start of the compressed file, read it, and construct the Huffman tree for the alphabet. Only then can it read and decode the rest of its input. The algorithm for decoding is simple. Start at the root and read the first bit off the input (the compressed file). If it is zero, follow the bottom edge of the tree; if it is one, follow the top edge. Read the next bit and move another edge toward the leaves of the tree. When the decoder arrives at a leaf, it finds there the original, uncompressed symbol, and that code is emitted by the decoder. The process starts again at the root with the next bit.
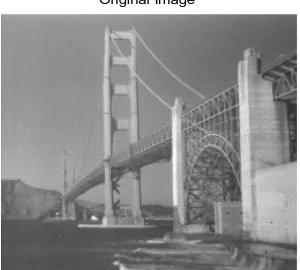
[image:6.595.321.543.237.437.2]Original Image
Figure 2 Original Image
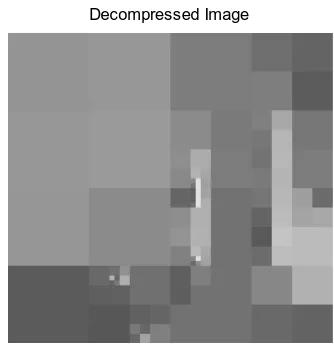
Scenario1:
When size of block ‘M’=16 Size of codebook ‘N’=50 Entropy is: 3.02
Average length is: 5.50
Time taken for compression = 41.832703 seconds compression ratio= 25.244992
Time taken for Decompression = 7.075164 seconds PSNR= 24.877438
[image:6.595.87.237.557.692.2]
Figure 3 Decompressed Image of M=16 and N=50
If increasing the threshold to 0.5 for M=16 and N=50 Entropy is: 3.96
Average length is: 0.25
Time taken for compression = 41.010946 seconds compression ratio= 139.772861
© 2015, IRJET ISO 9001:2008 Certified Journal Page 503
[image:7.595.84.251.101.273.2]Decompressed Image
Figure 4 Decompressed Image of M=16 and N=50 for threshold=0.5
Scenario2:
When size of block ‘M’=1024 Size of codebook ‘N’=25 Entropy is: 2.83
Average length is: 3.75
Time taken for compression = 8.941803 seconds compression ratio= 25.505351
[image:7.595.360.533.234.411.2]Time taken for Decompression = 7.501819 seconds PSNR= 23.320906
Figure 5 Decompressed Image of M=1024 and N=25
If increasing the threshold to 0.5 for M=1024 and N=25
Entropy is: 5.31 Average length is: 1.75
Time taken for compression = 8.127326 seconds compression ratio= 173.893201
Time taken for Decompression = 0.575687 seconds PSNR= 20.957704
Decompressed Image
Figure 6 Decompressed Image of M=1024 and N=25 for threshold=0.5
As, we see that scenario 1 from figure 2 is showing better result
4. Conclusion: Review of Calculated Results
(a)Results of Entropy:
To calculate entropy of first part of this research paper is given as:
H = - ∑ P(ai) log2 P(ai)
H = -[0.2 log2 0.2 + 0.4 log2 0.4 + 0.2 log2 0.2 + 0.1
log2 0.1 + 0.1 log2 0.1] = 2.1219 bits/symbol .
[image:7.595.42.282.540.708.2]© 2015, IRJET ISO 9001:2008 Certified Journal Page 504 (b)Results of Average Length:
L= ∑ P(ai) n(ai) = [0.4*1 + 0.2*2 +0.2*3 + 0.1*4 +0.1*4] = 2.20 bits/symbol. Similarly, Average length=L=4.14 for second part of the paper. Average length for image compression for two scenarios is 5.50 and 3.75. If threshold is increased to 0.5, average length will be getting smaller and smaller.
(c)Results of Compression Ratio:
In first part, Compression Ratio=3/2.2=1.3636.
Similarly, Compression Ratio=5/4.14=1.21 for
second part of this paper. Compression ratios of image compression for two scenarios are 25.244992 and 25.505351. If threshold is increased to 0.5, compression ratio will be getting bigger and bigger.
(d)Results of Actual Average Word Length:
Actual Average Word Length can be calculated for
second part of this paper by ∑Oi * Li/∑Oi.=4.13
Binary Tree Results for first part of Huffman Coding:
Therefore, code-word for A1 is 01, A2 is 1, A3 is 000, A4 is 0010, and A5 is 0011.
In this research paper, the Huffman coding analysis from provided results with the help of MATLAB implementation using random numbers, message display lies in between for 26 English alphabets, and image compression via K-Means technique based on performance metrics that more the compression ratio of Huffman coding, the lesser will be the entropy and average length as by if increasing the threshold value or not. Furthermore, the Huffman coding
using random numbers show less entropy result as compare to Message display using 26 alphabet characters, and image compression using K-Means algorithm. Lesser the entropy, so better will be the image compression using K-Mean algorithm technique for Huffman coding.
5. Future work
The implementation of different image compression applications will be used for Huffman coding to be use in the electrical field.
Acknowledgement
I want to thanks Dr. Jung H. Kim as an advisor for his support and giving technical views for various aspects to used image compression in various fields.
References:
[1] Pu, I.M., 2006, Fundamental Data Compression, Elsevier, Britain.
[2] http://en.wikipedia.org/wiki/Huffman_coding [3]http://en.wikipedia.org/wiki/Adaptive_Huffman_codin g
[4] http://en.wikipedia.org/wiki/Block_code
[5] Blelloch, E., 2002. Introduction to Data Compression, Computer Science Department, Carnegie Mellon University.
[6] Kesheng, W., J. Otoo and S. Arie, 2006. Optimizing bitmap indices with efficient compression, ACM Trans. Database Systems, 31: 1-38. authors can acknowledge any person/authorities in this section. This is not mandatory. [7]http://www.webopedia.com/TERM/H/Huffman_comp ression.html
[8] Gupta, K., Verma, R.L. and Sanawer Alam, Md. (2013) Lossless Medical Image Compression Using Predictive Coding and Integer Wavele Transform based on Minimum Entropy Criteriat. International Journal of Application or Innovation in Engineering & Management (IJAIEM), 2, 98-106.
[9] Mishra, K., Verma, R.L., Alam, S. and Vikram, H. (2013) Hybrid Image Compression Technique using Huffman Coding Algorithm. International Journal of Research in Electronics & Communication Technology, 1, 37-45. [10] H.B.Kekre, Tanuja K Sarode, Sanjay R Sange(2011) “ Image reconstruction using Fast Inverse Halftone & Huffman coding Technique”, IJCA,volume 27-No 6, pp.34-40.
© 2015, IRJET ISO 9001:2008 Certified Journal Page 505 Biographies
Ali Tariq Bhatti
received his
Associate degree in Information System Security (Highest
Honors) from
Rockingham Community College, NC USA, B.Sc. in Software engineering (Honors) from UET Taxila, Pakistan, M.Sc in Electrical engineering (Honors) from North Carolina A&T State University, NC USA, and currently pursuing PhD in Electrical engineering from North Carolina A&T State University. Working as a researcher in campus and working off-campus too. His area of interests and current research includes Coding Algorithm, Networking Security, Mobile Telecommunication, Biosensors, Genetic Algorithm, Swarm Algorithm, Health, Bioinformatics, Systems Biology, Control system, Power, Software development, Software Quality Assurance, Communication, and Signal Processing. For more information, contact Ali Tariq Bhatti at [email protected].
Dr. Jung H. Kim is a
professor in