© 2016, IRJET | Impact Factor value: 4.45 | ISO 9001:2008 Certified Journal
| Page 36
Productivity Improvement in Steering Knuckle Machining Line Using
Lean Techniques-A Case Study
M.Ashiq Hyder
1, D.Ranjith
2, R.Jayachitra
3, R.R.Pradeep
41
UG Student, Department of Mechanical Engineering, PSG College of Technology, Coimbatore 641004, India
2UG Student, Department of Mechanical Engineering, PSG College of Technology, Coimbatore 641004, India
3
Assistant Professor, Department of Mechanical Engineering, PSG College of Technology, Coimbatore 641004,
India
4
PG Student, Department of Mechanical Engineering, PSG College of Technology, Coimbatore 641004, India
---***---Abstract -
In today’s competitive manufacturingenvironment, companies are constantly looking for ways to improve. Because of this, many companies are striving to become “lean” by implementing lean tools, which is a difficult process. Simulation was used to aid in the implementation of lean manufacturing to reduce the trial-and-error period of lean manufacturing and find to optimum approach to implement the lean manufacturing principles. In this research, a case study of implementing level loading of the steering knuckle machining line is examined. To implement level loading, process study of machining line was conducted and bottleneck process was identified. The load on the bottleneck machine whose cycle time was double the Takt time was leveled by sharing the work done by that machine with another machine which having lesser cycle time than the Takt time. The simulation is performed to compare the present and level balanced process. The time and motion study is performed to identify the non-value added activities of workers and non-value added activities are reduced. In order to reduce the motion wastes and unwanted transportation, a new material handling system has been designed and developed.
Key Words: Value stream mapping, Line balancing, Work
study, Gravity Feeder.
1.INTRODUCTION
Customers have numerous choices when it comes to buy their product. Having choices available to the consumer and expectation of shorter order fulfilment lead times, customers have become more fickle in their purchasing decisions and less loyal to their old long-standing business relationships. Products with similar features and price offered by multiple manufacturers begin to approach commodity market. Products can be produced in many ways. They can be manufactured by lean methodology or in batch quantities routed through traditional work centres. It depends on many situations, to choose lean or batch manufacturing such as the quantities, cost, manpower and others. Lean manufacturing is a proven technique that allows work to be performed without bottlenecks or delays. In the lean
environment, these activities do not add value to the product and considered a waste. The lean manufacturing methodologies eliminate the wasteful activities by linking and balancing equal amounts of work steps together and enabling products to be consume directly into the next step through the process of one piece at a time until completed. The sum of the work time minus the added queue and wait time required to progress through the manufacturing processes is always shorter than the time required to route products through a batch manufacturing.
2. LITERATURE SURVEY
Abdulmalek and Rajagopal[1] applied lean manufacturing principles to improve a process at a steel mill. Value stream mapping is been used to map the several scenarios. Their paper also described simulation models to explain potential benefits of reduced lead time and reduced WIP inventory. McDonald et.al.[2] have explained wasteful steps that to be eliminated and flow can be introduced in the remaining value-added processes. The concept of flow is to make parts ideally one piece at a time from raw materials to finished goods and to move them one by one to the next workstation with no waiting time in between. K.Hemanand et al. [3] designed and developed the gravity feeder for the material handling system which have been used to reduce the motion and transportation wastes. K.Hemanand et al. [3] identified the problems in the current layout of Bearing cap machining line and analyzed through simulation. Then the layout is modified, simulated and the results are compared with the current layout. Ganesh kumar N et al. [4] have done time and motion study of T-shirt manufacturing process and used two handed process chart to eliminated non-value added activities of workers thereby reducing the cycle time of the process.
3. METHODOLOGY
© 2016, IRJET | Impact Factor value: 4.45 | ISO 9001:2008 Certified Journal
| Page 37
Fig -1: Methodology4. DATA COLLECTION
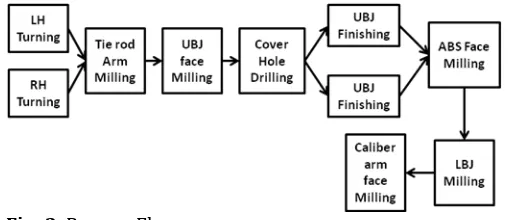
The process flow of steering knuckle is given in Figure-2.
Fig -2: Process Flow
The stop clock approach is employed for observing time for each activities while worker involved in manufacturing the component. The cycle time and worker allocation to each machining process is given in the Table-1.The machines 3, 4, 5, 6& 9 are double palette machines hence their set up times are considered as zero.
Calculation of Takt time:
1)Demand per day =558 components 2)Demand per shift =186 components 3)Available time per shift =420min
[image:2.595.37.283.107.331.2]4)Takt time = Available time/ Customer demand =420/186=2.25min=135sec
Table -1: Cycle time for each machining process
S.No Machine No
Machine
type Operation
Operator No
Machine time(Sec)
Setup time(Sec)
Total Cycle time
1 1 Turning Centre LH knuckle main bore turning
1
127 17 154
2 2 Turning Centre RH knuckle main bore
turning
135 17 144
3 3 HMC
Tire rod arm milling and
taper hole drilling
2 120 0 120
4 4 HMC UBJ milling & rough
boring 3 130 0 130
5 5 HMC
Cover hole drilling
and tapping
4 135 0 135
6 6 HMC
UBJ finishing,
side milling, chamfering
& slitting 5
271 0 271
7 7 HMC
UBJ finishing,
side milling, chamfering
& slitting
271 17 288
8 8 VMC
ABS face milling, drilling &
tapping
6 120 15 135
9 9 VMC
LBJ milling & taper
hole drilling
7 135 0 135
10 10 VMC
Caliber arm face
milling, drilling &
tapping
8 119 15 134
5. LINE BALANCING
The takt time of the machining is found to be 135sec or 2.25 min. Except the machines 3, 6, 7, 8, all other machines having the cycle time closer to the takt time. So these machines are to be balanced to the takt time in-order to facilitate one piece flow and to reduce work in progress inventory and therefore productivity found to be increased.
No of stations required are calculated as follows, Total Machining time = 20.295 mins
No of stations required for line balancing =Total machining time/Takt time =20.295/2.25=9 mins
[image:2.595.309.584.134.534.2] [image:2.595.33.288.377.487.2]© 2016, IRJET | Impact Factor value: 4.45 | ISO 9001:2008 Certified Journal
| Page 38
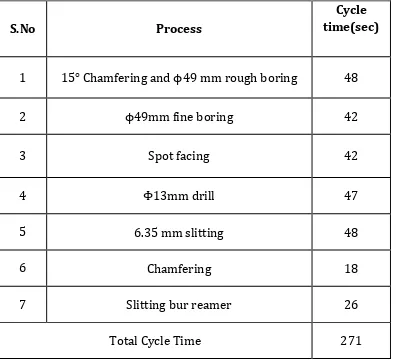
machines 6&7 are performing same operation, there is queue [image:3.595.64.262.173.353.2]of components ahead of these machines. The list of process involved in the machine 6&7 and their respective cycle time are given in the table-2.
Table -2: Bottleneck machining process
S.No Process
Cycle time(sec)
1 15° Chamfering and ϕ49 mm rough boring 48
2 ϕ49mm fine boring 42
3 Spot facing 42
4 Φ13mm drill 47
5 6.35 mm slitting 48
6 Chamfering 18
7 Slitting bur reamer 26
Total Cycle Time 271
[image:3.595.334.533.217.304.2]The total number of process taken place in these machines are segregated based on takt time and assigned to machines 6 & 7. The table 3 and 4 shows the process assigned to machines 6 & 7 respectively.
Table -3: Assigned operation to machine 6
S.No Process
Cycle time(sec)
1 15° Chamfering and ϕ49 mm rough boring 48
2 ϕ49mm fine boring 42
3 Φ13mm drill 47
4 Set up time(Double pallet) 0
Total Cycle Time 137
Table -4: Assigned operation to machine 7
S.No Process
Cycle time(sec)
1 Spot facing 42
2 6.35 mm slitting 48
3 Chamfering 18
4 Slitting bur reamer 26
5 Setup time 19
Total Cycle Time 153
Even after sharing the tasks machine 7 having cycle time higher than that of takt time is found to be mainly because of its set up time. This machine can further balanced by interchanging its tasks with machine 3 which is a double palette machine and having cycle time (120 sec) lesser than the takt time. Now the balanced cycle time of machine 3 & 7 are given in the table-5 and 6 respectively. The comparison of takt time before and after line balancing is given in Chart-1. Table -5: Balanced cycle time of machine 3
S.No Process
Cycle time(sec)
1 Machining Time 120
2 Setup Time 19
[image:3.595.334.573.337.650.2]Total Cycle Time 139
Table -6: Balanced cycle time of machine 7
S.No Process
Cycle time(sec)
1 Spot facing 42
2 6.35mm slitting 48
Chamfering 18
Slitting bur reamer 26
Total Cycle Time 134
M/C 1 M/C 2 M/C 3 M/C 4 M/C 5 M/C 6 M/C 7 M/C 8 M/C 9 M/C 10
Before 2.5 2.4 2 2.1 2.2 4.5 4.8 2.2 2.2 2.2 After 2.2 2.2 2.2 2.1 2.2 2.2 2.2 2.2 2.2 2.2
1 1.251.5 1.752 2.252.5 2.753 3.253.5 3.754 4.254.5 4.755 C yc le ti me (m in)
Chart -1: Comparison of takt time before and after line balancing
5. SIMULATION MODEL
[image:3.595.62.261.438.564.2]© 2016, IRJET | Impact Factor value: 4.45 | ISO 9001:2008 Certified Journal
| Page 39
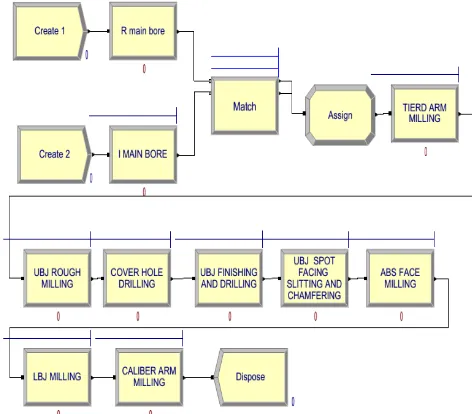
future state. Before evaluating the future state, considerableeffort was expended to verify and validate the model for the current system. Verification is the process that ensures that the simulation model mimics the real system [5]. A detailed animation was used to further verify that the model sufficiently replicated the real system. Validation of the model calls for comparing outputs of the simulation to those from the actual system. Measures that included were inventory at the finishing mill and the total time in the system, with actual data. The simulation model run for a day period, so that the model can be validated when it is in steady state. It should be noted that the figures represent average values. From the table it is clear that the numerical outputs from the simulation are all within the range of the actual data. Simulation is non-terminating, but initial conditions do influence the initial dynamics of the system. Starting with an empty system at time zero, a transient (warm up) period was used for the system to load itself with entities and subsequently reach steady state. The warm up period for our simulation model was established by carrying out ten replications with each having a run length of one shift (480 min). The ten replications examined successive observations of various performance measures. The warm up period is found to be 48 min. Figure-3 shows simulation model of balanced machining line.
Fig -3: Simulation model of balanced line
5. WORK STUDY
The time and motion study is performed to remove the non- value added activities of worker. The two handed process chart as shown in Figure-4 is drawn to find non value added activities and useful movement of worker. Figure-5 shows value added movement for man 1and man machine chart for man 1 as shown in Figure-6 is drawn to define cycle of operation of worker and to improve their utilization. Similarly the chart is drawn for other operators.
Fig -4: Two handed process chart(Before implementation)
Fig -5: Two handed process chart(After implementation)
Fig -6: Man machine chart
[image:4.595.307.559.77.280.2] [image:4.595.307.555.317.476.2] [image:4.595.38.274.392.599.2] [image:4.595.307.555.510.694.2]© 2016, IRJET | Impact Factor value: 4.45 | ISO 9001:2008 Certified Journal
| Page 40
before and after the work study are shown in the table-7 andtable-8 respectively.
Table -7: Worker utilization (Before)
Operator 1 2 3 4 5 6 7 8
Working time
(Sec) 114 40 45 39 150 42 23 62
Idle time(Sec) 30 80 85 96 121 93 112 58
Cycle
time(Sec) 144 120 130 135 271 135 135 120
[image:5.595.331.515.197.353.2]Utilization(%) 79.1 33.6 34.6 28.8 55.3 31.1 17 51.6
Table -8: Worker utilization (After)
Operator 1 2 3 4 5
Working time
(Sec) 78 80 77 80 84
Idle time(Sec) 66 69 58 55 51
Cycle
time(Sec) 144 149 135 135 135
Utilization(%) 54.16 53 57 59.2 62.3
6. GRAVITY FEEDER DESIGN
The component after machined from Machine 8 is transported to Machine 9 by trolley. In this transportation, Buffer type is followed. Labours spend their idle time for material transportation. And it will increase the fatigue of labour. The transportation of material is shown in Figure-7.
Fig -7: Material Flow
6.1 Design of Material gravity feeder
A gravity operated feeder has been designed for the suitable material handling of steering knuckle. The main aim of this
gravity feeder is to reduce material handling time and transportation in between two machines.
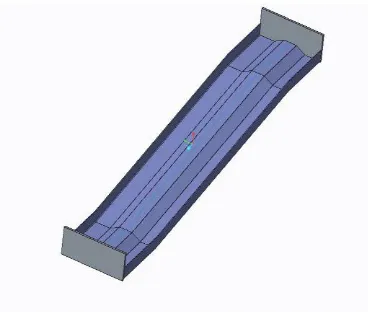
The feeder is made up of 3 mm structural steel sheet. The 3D view of the feeder to is shown in Figure-8. This model can carry about 3pairs of steering knuckle per meter in the feeder. The Steering Knuckle weight varies from minimum 7.25kg to maximum of 8kg. So the maximum weight 8 kg is selected.
Fig -8: Model of Gravity Feeder.
6.2 Structural Analysis of Feeder
The gravity feeder model is analyzed using ANSYS 15.0 to ensure the design is able to withstand the maximum loading condition .The model is completely meshed with Fine mesh and 5mm is given for element size. The meshing of the feeder model is shown in Figure-9. The Figure-10 shows the deformation of feeder for maximum loading condition. From the analysis, the maximum deformation is found to be 0.0002597mm, which is reasonably negligible. So the design of gravity feeder is safe.
[image:5.595.69.257.285.395.2] [image:5.595.41.560.532.685.2]© 2016, IRJET | Impact Factor value: 4.45 | ISO 9001:2008 Certified Journal
| Page 41
Fig -10: Deformation of gravity feederThe implementation of gravity feeder in between work stations reduces the motion waste and effort of the labours. It enhances the labour’s job satisfaction.
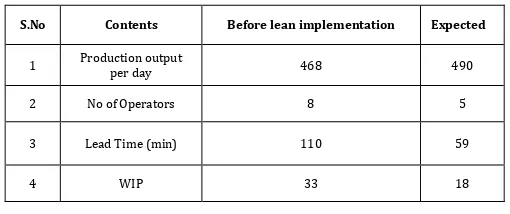
7. RESULTS AND INFERENCE
Line balancing will increase total number of components per day by 22 from present day production of 468 components.
Time and motion study reduces 3 workers and improves each worker’s utilization by 14%. Gravity feeder will reduce the worker’s fatigue. The As-Is analysis of the work is given in the table-9.
Table -9: As-Is analysis
S.No Contents Before lean implementation Expected
1 Production output per day 468 490
2 No of Operators 8 5
3 Lead Time (min) 110 59
4 WIP 33 18
REFERENCES
[1] A.Fawaz , Abdulmalek and Jayant Rajgopal, “Analyzing
the benefits of lean manufacturing and value stream mapping via simulation: A process sector case study”, Int. J. Production Economics,2007,107, pp. 223–236.
[2] T. E. McDonald, V. Aken and R. Butler, “Integration of
Simulation and Value Stream Mapping in
Transformation to Lean Production”, 2010, IIE Annual Conference.
[3] K. Hemanand, D. Amuthuselvan, S. Chidambara Raja, G.
Sundararaja, “ Improving Productivity Of Manufacturing Division Using Lean Concepts And Development Of Material Gravity Feeder–A Case Study” , International Journal of Lean Thinking, December 2012, Volume 3, Issue 2.
[4] K. Dharun Lingam, K. Sakthi Ganesh, N. Ganesh Kumar,
“Cycle Time Reduction for T-Shirt Manufacturing in a Textile Industry using Lean Tools”, 2015, IEEE Sponsored, 2nd International Conference on Innovations in Information, Embedded and Communication systems (ICIIECS).
[5] W. David Kelton, Randall P. Sadowski, Deborah A.
Sadowski, “Simulation with Arena” second edition, Pg No 596.
[6] 0. P. Khanna, “WORK STUDY (TIME AND MOTION
[image:6.595.34.289.473.580.2]