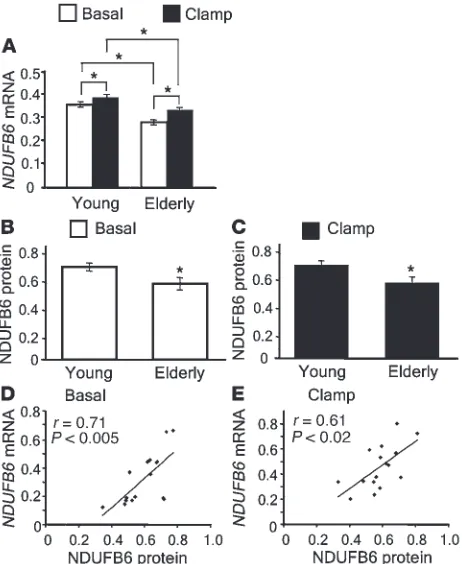
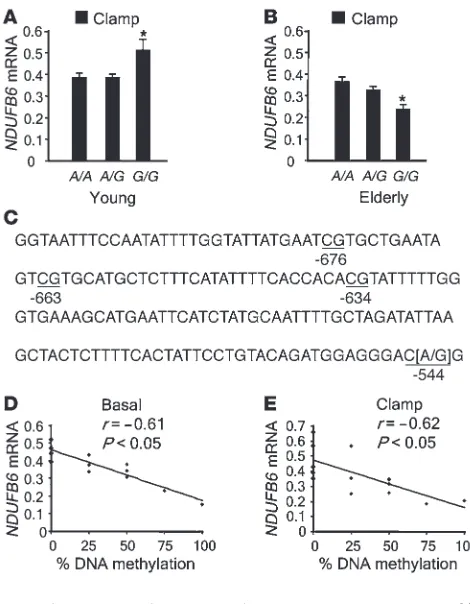
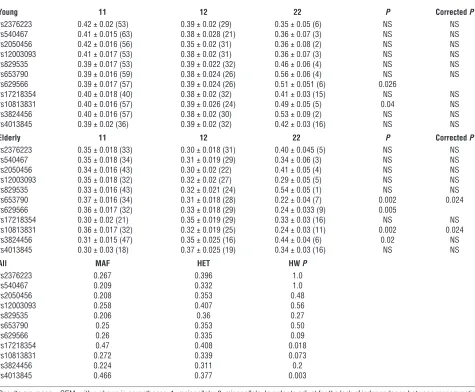
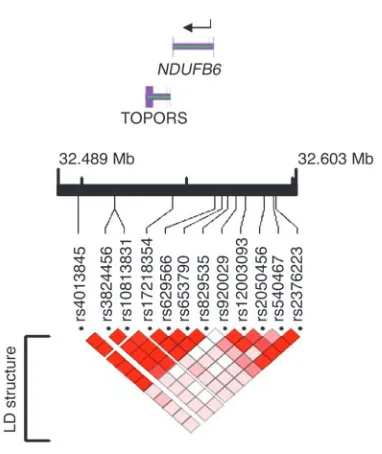
Genetic and epigenetic factors are associated with expression of respiratory chain component NDUFB6 in human skeletal muscle
Full text
Figure

Related documents
“Information Technology Acceptance in the Internal Audit Profession: Impact of Technology Features and Technology Complexity,” International Journal of Accounting Information
However, studies on comparison between the different anode and cathode Al electrode systems in both for the removal of phosphorus from wastewater and the characterization of
The objectives of this study were to de- scribe the prevalence of vulnerability to functional decline and explore profiles of vulnerability related to physical ac- tivity performance
An overall increased frequency of chromosomal aberrations in male and female partners of couples referred for intracytoplasmic sperm injection has been observed
In the same paper the authors examined the properties of various types of fuzzy cycles, fuzzy trees, fuzzy bridges, and fuzzy cut nodes in fuzzy graphs.. Nagoor Gani and Basheer
5.11 Solutions cost percentage differences for 5 minutes time scale, spike traffic and high noise... LIST
During the initial period attention was given to: the preparation of implementation plans, assigning responsibility to the accounting officer for all funds of the
To incentivize horizontal integration, the federal government will pay 90 percent of the costs of design, development, and implementation of health coverage eligibility systems,
![Chloro[hydrotris(pyrazol 1 yl)borato]oxo(1H pyrazole)vanadium(IV)](data:image/gif;base64,R0lGODlhAQABAIAAAP///wAAACH5BAEAAAAALAAAAAABAAEAAAICRAEAOw==)