© 2016, IRJET | Impact Factor value: 4.45 | ISO 9001:2008 Certified Journal | Page 2152
FILTERED- BACK PROJECTION ALGORITHM ON COMPUTED
TOMOGRAPHY (CT) SCAN
Ranjit Kumar
1, Shikha Hans
2Satya College of Engineering & Technology, Palwal, Haryana, India-121105
Dept. of Computer Science & Engineering (M.Tech)
: [email protected], [email protected]
---***---Abstract -
This project has done to learn how to performfiltered-back projection algorithm on computed tomography (CT) projection data of a Shepp-Logan head phantom to reconstruct image. Based on a given data file containing fan-beam x-ray data, a program has been created to perform CT Reconstruction on the data. Filtered back projection algorithm has been used to reconstruct CT data and two spatial domain image processing algorithms histogram equalization and gamma correction have been used to enhance the image.
Key Words: Computed tomography (CT), Shepp-Logan head
phantom, Fan-beam Projection, X-ray, Histogram equalization, Gamma correction.
1. INTRODUCTION
The main focus of this object is to study the algorithms of fan beam projection of computed tomography and to reconstruct the image from the projection datas using back projection algorithms. This project has been completed using 100 angles of projection (from ), each angle of projection consisting 127 rays. Whole project has been accomplished through three main steps.
First, every single projection data R (pixel value) of 127 rays in the each of 100 angles has been changed to intermediate projection values R’.
Second, Designing a modified Ram-Lak Filter (tapped by a hamming window) and filtering the intermediate data with this filter.
Third, result of the second step is a filtered projection data Q of 127 rays for each of the 100 rotation angles. Now to reconstruct in a XY 2D domain, for every combination pixel value has been calculated by back projection algorithm using the Q values. In the following chapters, this report will introduce a brief background of related technologies, detailed steps of project implementation, introduction of project results and conclusion.
2. BACKGROUND
X-ray computed tomography (X-ray CT) is a technology that uses computer-processed X- rays to produce tomographic images (virtual ’slices’) of specific areas of a scanned object, allowing the user to see inside the object without cutting [?]. Two types of projections are being used:
(a) Parallel beam and (b) Fan beam projections.
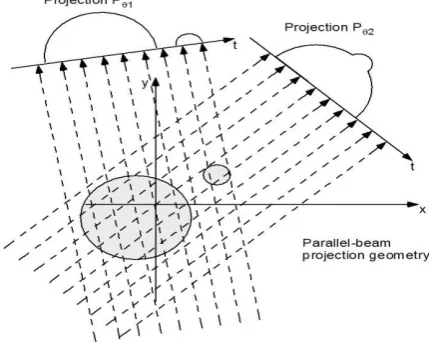
[image:1.595.331.546.467.638.2]In parallel projections, a source-detector combination has to linearly scan over the length of a projection, rotate through a certain angular interval, and then scan linearly over the length of the next projection [1]. This is actually slower process since it takes time to collect all the data.
Figure 1: Parallel-beam projection
© 2016, IRJET | Impact Factor value: 4.45 | ISO 9001:2008 Certified Journal | Page 2153 There are two types of fan projections
[image:2.595.309.566.56.294.2]depending upon whether a projection is sampled at equiangular or equispaced intervals [1].
Figure 2: Fan-beam projection
In this project, equiangular fan beam projection data have been used where all the rays for a single rotation angle maintains equal angle difference among them. Reconstructed image of just using projection data results into blur image due to distortion. To avoid this effect projection data need to be filtered before back projection [2]. This is the reason to name this method filtered back projection algorithm
3. METHODS
For this project, the input is a matrix R. Each column of this matrix contains projection data of
rays for every rotation angle .
The rays are counted from to where
is central ray. So for a particular rotation angle (column), top most element is projection data is for
and the bottom most one is for numbered ray.
The whole implementation steps of the project can be
written as below: The whole implementation steps of
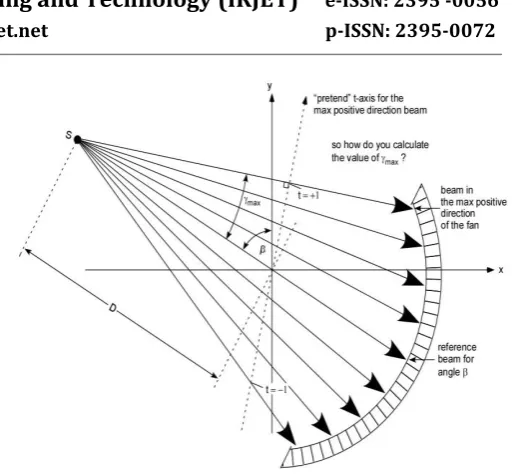
Step 1: To calculate the angular distance α between two consecutive rays for any rotation angle. To do that, maximum angle has to be calculated, which is the angle between central and or numbered
ray, using the formula .
[image:2.595.58.284.154.357.2]Then dividing by 63 gives .
Figure 3: Geometry for calculating γmax
Step 2: To calculate intermediate projection data from
by using . The matrix
size is . It has been zero padded to new size then has to be shifted to frequency domain by FFT to be convolved with the filter (explained in next step).1
Step 3: To design a 256 size modified Ram-Lak filter (cite) to filter the R’ data and smooth it with a Hamming window. The equation for filter is
Step 4: To obtain filtered projection data Q for each ray (corresponds to ) of each rotation angle by multiplying
by tapped by hamming filter.
Then Q datas have been taken to spatial domain by IFFT and then has been cropped to 127*100 to get back to the original size.
© 2016, IRJET | Impact Factor value: 4.45 | ISO 9001:2008 Certified Journal | Page 2154
Step 5: Now Q datas are used to reconstruct an image of 256 ∗256 size of space. Both x and y are chosen from range -1 to 1. Then for every combination, the pixel has been calculated.
But, before that for each , two entities has to be calculated for every rotation angle . One is angle between the central beam and line from the beam source to particular position. Other one is distance L from the beam source to that . Following equations will return these two values.
Now for each , all the 100 rotation angles have returned 100 and . But Q (127*100) matrix has 127 elements for each rotation angle corresponding to their angular distance from reference beam varying
from to . can be aligned
to either of these rays or not. To overcome this issue, for a particular rotation angle has been calculated by interpolation of adjacent 2 values of for that particular rotation angle .
Then, for every position pixel value has been calculated with the following equation.
Here term has been summed for all 100 rotation angles for individual .
Step 6: At last Pixel datas from previous step have been gone through two image enhancement techniques histogram equalization and gamma correction.
4. RESULTS
This project has used fan beam CT projection datas of Shepp-Logan head phantom. If the reconstructions steps work properly, reconstructed image should show
some high pixel values due to tumors (in ). A
[image:3.595.334.561.292.469.2]dataset also has been produced for fixed to verify the result properly.
Figure 4: Pixel values plot against x for constant
Figure5: Reconstructed image in space
5. CONCLUSION
This project gives a great knowledge about various CT projection systems and reconstruction of projection datas using Back Filtered Projection algorithm. Some key issues have to be maintained in the working progress of this project. First, properly zero padding, second, proper shifting of filters and hamming windows, third, properly interpolating Q values. Some other image enhancement algorithms may return better quality image.
© 2016, IRJET | Impact Factor value: 4.45 | ISO 9001:2008 Certified Journal | Page 2155
REFERENCES
[1] A. Rosenfield and A. Kak, Digital Picture Processing. Academic press, 1982.
[2] C. Wright, Lecturer slides EE5630. University of Wyoming.
[3] M. Bertram, J. Wiegert, D. Schafer, T. Aach, and G. Rose. Directional view interpolation for compensation of sparse angular sampling in cone-beam ct. 28(7):1011{1022, July 2009.
[4] D.Sc. David J. Brenner, Ph.D. and D.Sc. Eric J. Hall, D.Phil. Computed tomography: An increasing source of radiation exposure. 2008.
[5] Paul Hurst Eric Shieh, Wayne Current and Iskender Agi. A high-speed radon transform and back projection processor. IEEE International Symposium on Circuits and Systems, 1:234-237, 1990.
[6] Ze Liu Xiao-hong Qin Jun-qing Geng Yan-ping Zhang1 Gui-hua Yao Yun Zhang Feng-rong Sun, Yan-ling Li. Model and simulation for three-dimensional medical image reconstruction of spiral ct. 2008.
[7] Paul Gopi. Reconstruction of an image using the filltered back projection method, 2004.
[8] S. Horbelt, M. Liebling, and M. Unser. Filter design for filltered back-projection guided by the interpolation model. In M. Sonka and J.M. Fitzpatrick, editors, Progress in Biomedical Optics and Imaging, vol. 3, no. 22, volume 4684, Part II of Proceedings of the SPIE International Symposium on Medical Imaging: Image Processing (MI'02), pages 806{813, San Diego CA, USA, February 24-28, 2002. Best poster award.
[9] Bio Imaging. Our industrial ct is more than ndt. 2009.
[10]A.K. Louis. Combining image reconstruction and image analysis with an application to two-dimensional tomography. 1(2):188{208, 2008.
[11] Julien Noel. Advantages of ct in 3d scanning of industrial parts. 2008.
[12]A.Lynn Abbott Calvin J.Ribbens Raman P.V. Rao, Ronald D.Kriz. Parallel implementationof the _ltered back projection algorithm for tomographic imaging, 1995.
[13] High-Resolution X ray Computed Tomography Facility. About high-resolution x-ray ct. 2009.
[14] C. Riddell and Y. Trousset. Recti_cation for cone-beam projection and backprojection. 25(7):950{962, July 2006.
[15] B. Sahiner and A.E. Yagle. A fast algorithm for back projection with linear interpolation. 2(4):547{550, October 1993.
[16] Several Sources. Image reconstruction from projections. Biomedical Imaging and Emerging Technologies, 2003.
[17] Several Sources. Information about bilinear
interpolation, http:=en:wilipedia.org=wiki=
bilinearinterpolation, 2009a.
[18] Several Sources. Linear camera information, http: ==www:infaimon:com=catalog=catalog:php?cat = 65, 2009b.
[19] Several Sources Matlab help
'http://www.mathworks.com/access/helpdesk/help/toolbo x /images/index.html?/2009c.
[20] Several Sources More effect information, http: ==www: molinaripixel.com:ar=notes=moire:htm, 2009d.
© 2016, IRJET | Impact Factor value: 4.45 | ISO 9001:2008 Certified Journal | Page 2156 [22] X-View. Our fastest CT system delivered to boeing.
2009a.
[23] X-View. X-view CT: Industrial computed tomography systems. 2009b.
[24] Y. Zhang O'Connor and J.A. Fessler. Fast predictions of variance images for fan-beam transmission tomography with quadratic regularization. 26(3):335{346, March 2007.