© 2016, IRJET | Impact Factor value: 4.45 | ISO 9001:2008 Certified Journal | Page 985
TO OPTIMIZE THE COST OF SEAT STRUCTURE BY ANALYZING THE
ACCURACY OF MECHANICAL PROPERTIES BETWEEN FEA
ANALYSIS AND EXPERIMENTAL RESULTS
Akshay S Nadagouda, Mahesh V M
Department of Mechanical Engineering, M. S. Ramaiah Institute of technology. Bengaluru, Karnataka, India.
---***---Abstract – This project is aimed to provide an experimental
and finite element study of mechanical behaviour of IS 513D and E34 materials under tensile testing. The mechanical properties of material, limits the application of such material in an automobile industry. It is because one cannot use low strength material in load carrying parts, on the event of an accident these parts are subjected to breakage which is a threat to the safety of the passenger. The main motto of any automobile industry is to ensure the safety of the passenger in the event of an accident. So it is necessary to test materials and be aware of their mechanical properties before using them in the manufacturing of the vehicle.This project is focused on the tensile testing of IS 513D and E34 materials used in manufacturing of car seats. Physical test is carried out for three different thickness of 2mm, 2.5mm and 3mm for E34 material and same test was carried for 3 different thickness of 1.2mm, 1.5mm and 2mm for IS513D material at different orientation such as horizontal, vertical and 450 to the grain lines. Specimen was prepared as per E8 standard. The equipment used for tensile testing is Instron UTM Model 5582. Load cell of 100kN capacity and Extensometer with 50mm original gauge length. Then same test was carried out using LS-Dyna software with same specimen specifications for the purpose of comparison with the results obtained by UTM test. Initially a CAD model was prepared according to ASTM E8 standard. Then this prepared CAD model was meshed in ANSA software. Model preparation was done in ANSA. Physical tests were validated by results obtained from LS dyna tool.
Key Words: IS 513D, E34, tensile test, ASTM E8 standard, Instron UTM Model 5582, Extensometer, LS-Dyna software, ANSA software.
1. INTRODUCTION
The materials used in automotive industry need to fulfil many criteria before being approved. Some of the criteria are related to regulation and legislation with the environmental and safety concerns and some are the requirements according to the customers. In many occasions different factors are conflicting and therefore a successful design would only be possible through an optimized and balanced solution
1) Lightweight
As there is a high preference on reducing greenhouse gas and improving the fuel efficiency in the transportation sector, all car manufacturers, component producers, assemblers, and suppliers are investing significantly in the research and development of lightweight materials. The main obstacle in application of lightweight materials is their high cost, priority is given to activities to reduce costs through development of new materials, manufacturing processes and forming technologies.
2) Cost
One of the most important consumer driven factors in automotive industry is the cost. Since the cost of a new material is always compared to that present material used in the product, it is one of the most important factor that determines whether any new material has an opportunity to be applied for a vehicle component. Cost includes three components: actual cost of raw materials, cost to design, cost of manufacturing value and testing of the product. This test cost can be large since it is only through successful vehicle testing that the product and manufacturing engineers can achieve a ‘level of comfort” to choose newer materials for application in a high-volume production program.
3) Crashworthiness
The ability to absorb impact energy and be survivable for the passengers is called the ‘‘crashworthiness’’ of the structure in vehicle. Apart from the test will be done during the design stage, there are more tests that has be performed during the product evaluation stage. To determine crashworthiness — how well a vehicle protects its occupants in a crash — the Institute of highway safety rates vehicles good, acceptable, marginal, or poor based on performance in high-speed front and side crash tests, a rollover test, plus evaluations of seat/head restraints for protection against neck injuries in rear impacts. To earn Top Safety Pick for 2010 a vehicle must have good ratings in all four Institute tests. In addition, the winning vehicles must offer electronic stability control. [Insurance institute of highway safety, 2010].
The different tests performed to analyse the crashworthiness of the material are:-
1) Frontal offset crash test details
© 2016, IRJET | Impact Factor value: 4.45 | ISO 9001:2008 Certified Journal | Page 986 3) Rollover evaluations
4) Rear crash protection
If a head restraint isn't behind and close to the back of an occupant's head, it can't prevent a "whiplash" injury in a rear-end collision.
4) Recycling and life cycle considerations
One of the major growing concerns in all the industries including automotive, is an increased awareness for environment. Issues such as ‘protection of resources’, ‘reduction of CO2 emissions’, and ‘recycling’ are increasing the topics of consideration. As the results of the new legislations, no discussion of new materials in the automotive industry should conclude without a consideration of recycling. Considerable R&D efforts are now focused on developing materials with greater potential of recycling and use or developing ways of recycling and re-use of the current materials.
2.EXPERIMENTALDETAILS
Materials used
1) IS 513 CR2 D_MIN
TABLE 2.1: DESIGNATIONS OF IS 513
[image:2.595.318.549.118.287.2]The standard size of the sheet metal is 5000mm*2000mm. In 5000m*2000mm sheet a sample size of 400mm*400mm was machined for the purpose of testing. The size of 400mm*400mm was decided after confirming with the cad layout of different orientation which is explained below. 400mm*400mm sheet of 3 different thickness were obtained such as 1.2mm, 1.5mm, 2mm.The above materials were obtained from matrix solution, bhosari Pune.
TABLE 2.2: CONSTITUENTS OF IS 513
[image:2.595.314.559.365.577.2]A layout of different orientation of specimen was prepared in solid edge software to determine the size of the sheet required from which three different orientation specimens and for each specimen 2 samples could be prepared and there would be no wastage of materials.
Figure 2.1: layout of different orientation of specimens
2) E 34 Material
The hot rolled products include austenitic, ferritic and low nickel grades of stainless steels and carbon steels of drawing quality, structural quality, high strength-low alloy steels and weathering steels.
© 2016, IRJET | Impact Factor value: 4.45 | ISO 9001:2008 Certified Journal | Page 987 3. METHODOLOGY
1. Test Piece: The cross section of the test piece may be square, circular, and rectangular or in special cases of any other form. . Mark the gauge length as per standards and record it accurately. The gauge length should be symmetrical with the length of the bar.
2. Grip the specimen vertically and firmly in the jaw of the Universal testing machine and adjust the machine to read zero. Select the required Chart range by turning the capacity change wheel with the ram at the bottom of its stroke. Raise the ram a few mm by the quick setting control and set zero. Note that the zero will change as the ram rises due to the weight of the column of oil in the cylinder. Note that the grips do not protrude through the grip holders and insert the specimen not lesser than two thirds of the way into each pair of grips.
3. Attach the extensometer firmly to the specimen and adjust it to read zero.
4. Increase the load gradually to 250 kg, read the extensometer and record the reading on data sheet.
5. Continue loading at increments of 250 kg each time and record the extensometer reading at each increment of loading. This loading should be continued till yield point is reached. This is indicated by extensometer showing high values of extension. Record the load at the yield point. This may not be at a 250 kg increment.
6. At this point remove the extensometer and continue the loading. With the help of the venire of the machine, or by using dividers, record the extension at different values of load at intervals of 250 kg until fracture.
7. Note and record the maximum load attained and the breaking load.
8. Remove the broken pieces from the machine, and note and record the type of fracture. Fit the pieces together, measure the final length between the gauge marks and record as L, on data sheet. Measure the final diameter at the neck and record.
4. FEA ANALYSIS
All finite element packages require the user to go through these steps in one form to another
1) Specifying Geometry- First the geometry of the structure to be analyzed is defined this can be done either by entering the geometric information in the finite element package through the keyboard or mouse or by importing the model from a solid modeller like Pro-ENGINEER.
2) Specify Element Type and Material Properties- Next, the material properties are defined. In an elastic analysis of an isotropic solid these consist of the Young’s modulus and Poisson’s ratio of the material.
3) Mesh the Object-Then the structure is meshed into small elements. This involves defining the types of elements into which the structure will be broken, as well as Specifying how the structure will be subdivided into elements.
4) Apply Boundary conditions and External Loads- Next, the boundary conditions e.g. .location of supports and the external loads are specified.
5) Generate a solution- Then the solution is generated based on the previously input parameters.
6) Post processing- Based on the initial conditions and applied loads, data is returned after a solution is processed. This data can be viewed in a variety of graphs and displays.
7) Refine the Mesh- Finite element methods are approximate methods and, in General, the accuracy of the approximation increases with the number of elements Used. The number of elements needed for an accurate model depends on the Problem and the specific results to be extracted from it. Thus, in order to judge the number of elements in the object and see if or how the results change.
[image:3.595.308.561.532.702.2]8) Interpreting Results- This step is perhaps the most critical step in the entire Knowledge of mechanics to interpret and understand the output of the model. This is critical for applying correct results to solve real engineering problems and in identifying when modelling mistakes have been made.
© 2016, IRJET | Impact Factor value: 4.45 | ISO 9001:2008 Certified Journal | Page 988
5.RESULTSANDDISCUSSION
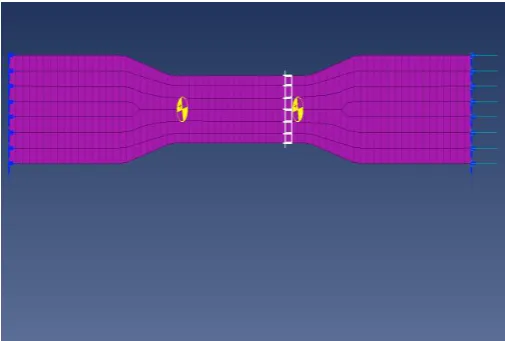
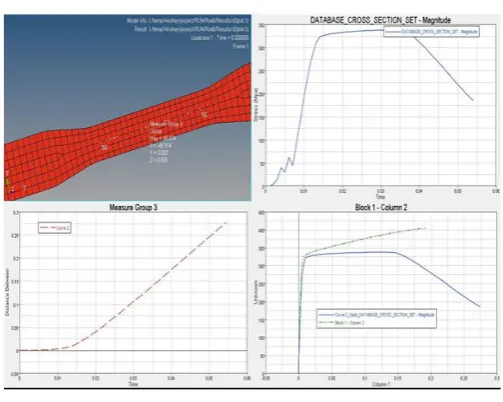
[image:4.595.307.559.119.320.2]A. E34
Figure 5.1: Results of E34
The different windows in the above figure represents 1) Animation of tensile testing when load is applied 2) Stress v/s time graph
3) Strain v/s time graph 4) Stress v/s strain graph
[image:4.595.36.280.131.340.2]
Figure 5.2: comparison between FEA and experimental results of E34 material.
The true stress v/s true strain graph obtained from FEA analysis is compared with the true stress vs true strain graph obtained from experimental results.
From the graph we can conclude that the graph obtained from FEA analysis and the graph obtained from experiment matches with less than 1% error so FEA results can be applied in the materials of the seat structure
[image:4.595.318.570.428.607.2]
B. IS 513D
Figure 5.3: Results of IS 513
The different windows in the above figure represents 1) Animation of tensile testing when load is applied 2) Stress v/s time graph
3) Strain v/s time graph 4) Stress v/s strain graph
Figure 5.4: comparison between FEA and experimental results of IS 513 material.
The true stress v/s true strain graph obtained from FEA analysis is compared with the true stress v/s true strain graph obtained from experimental results.
1 From the graph above we can conclude that up to a point in a graph the error between the 2 graphs is less than 1%
[image:4.595.36.289.443.630.2]© 2016, IRJET | Impact Factor value: 4.45 | ISO 9001:2008 Certified Journal | Page 989
6.CONCLUSIONS
1) From the current study it is evident that FEA methods can be used effectively to validate and model Material properties accurately.
2) Validated FEA material curve can be used to improve analysis accuracy, which helps reducing Engineering development cost by reducing number of Prototypes and Physical test.
3) It is observed from the material test that average minimum material strength parameters are higher than the given in IS-513 specification.
4) The change in orientation of grain lines do not affect the strength significantly, however further verification is required to assess impact on mechanical properties related to manufacturability.
5) It is also observed from the test data that change in thickness do not affect the strength parameter significantly, however there is a minor change in Yield strength.
6) The yield strength of E34 material is greater than IS 513 material.
7) The Ultimate tensile strength of E34 material is greater than IS 513 material.
8) The change in orientation of grain lines of the specimen did not cause a significant change in the mechanical properties of the material.
9) The elongation of both materials are almost similar to each other.
7. REFERENCES
1. Edgar Jose, Tom Anto, “Analysis of Tensile Test of Mild Steel using Finite Element Method”. International journal of innovation in engineerinsg and technology. Volume 5 Issue 4 August 2015 pg no 247-251.
2. Amit Kumar Tanwer “Effect of Various Heat Treatment
Processes on Mechanical Properties of Mild Steel and Stainless Steel” American International Journal of Research in Science, Technology, Engineering & Mathematics. November 2014 pg no 57-61.
3. Khalid Kotresh Sardar, Dr. K. Veeresh, Manjunatha Gowda. “Characterization and Investigation of Tensile Test on Kenaf Fiber Reinforced Polyester Composite Material”, International Journal of Recent Development in Engineering and Technology, Volume 2, Issue 6, June 2014 pg no 104-112.
4. M. Riaz, N. Atiqah, “A Study On The Mechanical Properties of S45c Medium Type Carbon Steel Specimens Under Lathe Machining And Quenching Conditions”, International Journal of Research in Engineering and Technology, Volume:3 Issue:12 December 2014 pg no 121-130.
5. Rakesh Singh, S.L. Ahirwar, Sunil Kumar Tiwari,“Designing of High Comfort, Reliable and Economical Driver Car Seat”, International Journal of Emerging Technology and Advanced Engineering.
6. K. Senthilkumar, I. Siva, J.T. Winowlin Jappes M.Vikneshwararaj, P. Karthick, P. Devakumar, “Influence Of Orientation On Tensile And Flexural Properties Of Sisal Fiber Po Journal of Chemical and Pharmaceutical Sciences lyester Composite”. Special issue 7: 2015 pg no 171-174.
7. M. R. Ayatollahi, E. Alishahi, S. Shadlou, “Mechanical Behavior of Nanodiamond/Epoxynanocomposites”, Int J Fract (2011) 170:95–100.
8. Halil İbrahim Kurt , Ramazan Samur, “Study on Microstructure, Tensile Test and Hardness 304 Stainless Steel Jointed by TIG Welding”. International Journal of Science and Technology Volume 2 No. 2, February, 2013.