International Journal of Emerging Technology and Advanced Engineering
Website: www.ijetae.com (
ISSN 2250-2459
, Volume 2, Issue 10, October 2012)
212
SELECTION OF MIXED SAMPLING PLAN WITH
CONDITIONAL REPETITIVE GROUP SAMPLING PLAN
AS ATTRIBUTE PLAN INDEXED THROUGH MAPD
AND IQL USING IRPD
R. Sampath Kumar
1, R. Vijaya Kumar
2, R. Radhakrishnan
31
Assistant Professor, Department of Statistics, Government Arts College, Coimbatore – 641 018, Tamilnadu, India.
2Assistant Professor, Department of Statistics, SSM College of Arts and Science, Komarapalayam, Namakkal – 638 143,
Tamil Nadu, India.
3
Associate Professor, Department of Statistics, PSG College of Arts and Science, Coimbatore – 641 014, Tamilnadu, India.
Abstract - This paper presents the procedure for the construction and selection of mixed sampling plan (MSP) using Intervened Random effect Poisson Distribution (IRPD) as a baseline distribution. Having the Conditional Repetitive Group Sampling plan as attribute plan, the plans are constructed through indifference quality level (IQL) and maximum allowable percent defective (MAPD). Tables are constructed for easy selection of the plan
Keywords and phrases
-
indifference quality level, intervention, mixed sampling plan, maximum allowable percent defective, operating characteristic, poisson, intervened random effect poisson distribution.AMS (2000) Subject Classification Number: Primary: 62P30 Secondary: 62D05
I.
I
NTRODUCTIONMixed sampling plan is a two stage sampling
procedure involving variables inspection in the first stage
and attributes inspection in the second stage. Use of
variables on the first sample with attributes on the second
sample combines the economy of variables for quick
acceptance on the first sample with broad nonparametric
protection of attributes sampling when a questionable lot
requires second sample. Mixed sampling plans are of
two types, which are independent and dependent plans.
Independent mixed plans do not incorporate first sample
results in the assessment of the second sample.
Dependent mixed plans combine the results of the first
and second samples in making a decision if a second
sample is necessary.
Schilling (1967) proposed a method for determining
the operating characteristics of mixed variables –
attributes sampling plans, single sided specification and
standard
deviation
known
using
the
normal
approximation. Sherman (1965) has introduced a new
acceptance sampling called Repetitive Group Sampling
(RGS).
Kuralmani (1992) made some contribution on
Repetitive Group and certain related conditional
sampling plans. Radhakrishnan (2002) constructed tables
for conditional RGS using MAPD and MAAOQ.
Devaarul (2003) has studied the mixed sampling plans
and reliability based sampling plans. Sampath Kumar
(2007) has constructed mixed variables – attributes
sampling plans indexed through various parameters.
Sampath Kumar et.al (2012)
have made contributions to
mixed sampling plans for independent case
In the product control, the defective units are either
rebuilt or replaced by new units during the sampling
period. Quality engineers are always interested in
improving the quality level of product to enhance the
satisfaction of the customers and hence, they keep
making changes in the production process. These actions
trigger a change in the expected incidence of defective
items in the remaining observational period. Any action
for reducing the number of defectives during the
sampling period is called an intervention and such
intervention parameter ranges from 0 to 1.
In Intervened Random effect Poisson Distribution
(IRPD), Poisson parameter is modified in two ways:
one method is multiplying an intervention parameter ρ (a
constant) and secondly, multiplying an unobserved
random effect which follows Gamma probability
distribution. The IRPD can be very useful to the quality
and reliability engineers, who always make changes in
the production system in the observational period of
quality checking to ensure reliability of the system,
because, the failure rate of the components may vary in
different time intervals. The other areas of application of
IRPD are queuing, demographic studies and process
control and so on.
International Journal of Emerging Technology and Advanced Engineering
Website: www.ijetae.com (
ISSN 2250-2459
, Volume 2, Issue 10, October 2012)
213
Radhakrishnan and Sekkizhar (2007a, b, and c)
introduced
Intervened
Random
effect
Poisson
Distribution in the place of Poisson distribution for the
construction of attribute sampling plans.
In this paper, using the operating procedure of mixed
sampling plan (independent case) with conditional
repetitive group sampling plan as attribute plan, tables
are constructed using IRPD as a baseline distribution.
The tables are constructed for mixed sampling plan
(MSP) indexed through i) IQL ii) MAPD. The plan
indexed through MAPD is compared with the plan
indexed through IQL.
II.
C
ONDITIONSF
ORA
PPLICATIONSO
FIRPD
-
M
IXEDS
AMPLINGP
LAN
Production process is modified during the sampling
inspection by an intervention.
Lots are submitted substantially in the order of their
production.
Inspection is by variable in the first stage and
attribute in the second stage with quality defined as
the fraction defective.
Lot quality variation exists.
III.
G
LOSSARYO
FS
YMBOLSThe symbols used in this paper are as follows:
p
: submitted quality of lot or process
P p
a( )
: probability of acceptance for given quality
„
p
‟
p
0: submitted quality such that P
a(
p
0) = 0.50
(also called IQL)
p
*: maximum allowable percent defective
(MAPD)
n : sample size for each lot
n
1: sample size for variable sampling plan
n
2: sample size for attribute sampling plan
c
1: first attributes acceptance number
c
2: second attributes acceptance number
d
: number of defectives in the sample
j: probability of acceptance for the lot quality
„
p
j‟
j
: probability of acceptance under variables plan
for percent defective „
p
j‟(with sample size
n
1)
j
: probability of acceptance under attributes plan
for percent defective „
p
j‟(with sample size
n
2)
z (j) : „z‟ value for the j
thordered observation
k : variable factor such that a lot is accepted if
X
L k
IV.
O
PERATINGP
ROCEDUREO
FM
IXEDS
AMPLINGP
LANH
AVINGC
ONDITIONALR
EPETITIVEG
ROUPS
AMPLINGP
LANA
SA
TTRIBUTEP
LANSchilling (1967) has given the following procedure for
the independent mixed sampling plan with lower
specification limit (L) and standard deviation (
).
Determine the parameters of the mixed sampling
plan n
1, n
2, k, c
1and c
2
Take a random sample of size n
1from the lot
If a sample average
X
L k
, accept the
lot
If a sample average
X
<
L k
, go to step
(i)
Take another sample of size n
2
Count the number of defectives „d‟ in the sample
If d ≤ c
1, accept the lot
If d > c
2, reject the lot
If c
1< d ≤ c
2, utilize the information of the next
preceding „i‟ successive lots (i.e.,) the current lot
is accepted if the preceding „i‟ successive lots
result shows d ≤ c
1in the sample, otherwise reject
the lot.
V.
C
ONSTRUCTIONO
FM
IXEDS
AMPLINGP
LANH
AVINGC
ONDITIONALR
EPETITIVEG
ROUPS
AMPLINGP
LANA
SA
TTRIBUTEP
LANU
SINGIRPD.
Schilling (1967) has given the OC function of mixed
sampling plan as
( )
L p
= Pn
1(
X
A) + Pn
1(
X
>A)
2
0;
cj
p j n
(1)
The above expression is given as
j
=
j+ (1-
j)
j
(2)
International Journal of Emerging Technology and Advanced Engineering
Website: www.ijetae.com (
ISSN 2250-2459
, Volume 2, Issue 10, October 2012)
214
By symmetry, a parallel discussion can be made for
lower specification limits. The procedure for the
construction of mixed variables – attributes sampling
plans is provided by Schilling (1967) for a given „n
1‟, „k‟
and a point „
p
j‟ on the OC curve is given below.
Assume that the mixed sampling plans are
independent
Split
the
probability
of
acceptance
(
j
)
determining the probability of acceptance that will
be assigned to the first stage. Let it be
j
Decide the sample size n
1(for variable sampling
plan) to be used
Calculate the acceptance limit for the variable
sampling plan as
1
[ (
j) { (
j) /
}]
L k
L
z p
z
n
,
where L is the lower specification limit and z (t) is
the standard normal variate corresponding to „t‟ such that
t =
( )
1
2
z t
u2/ 2e
du
Determine the sample average
X
. If a sample
average
X
<
L k
, take a second stage
sample size „n
2‟ using attribute sampling plan.
Split the probability of acceptance
j
as
j
and
j
,
such
that
j
=
j
+
(1-
j
)
j
and fix the value of
j
.
Now determine
j
, the probability of
acceptance assigned to the attributes plan
associated with the second stage sample as
j
=(
j
-
j
)/(1-
j
)
Determine the appropriate second stage sample
size „n
2‟ from
P p
a( )
=
j
for
p
=
p
jUsing the above procedure, tables can be constructed
to facilitate easy selection of mixed sampling plan with
conditional repetitive group sampling plan as attribute
plan using IRPD as a baseline distribution indexed
through MAPD and AQL.
Radhakrishnan and Sekkizhar (2007a, b, and c)
suggested the probability mass function of the IRPD as
P p
a( )
=
1 1 3
1
P
P P
-
(3)
where
1P
=
1 0 01 !
1
!
!
1 !
1
l
c x x
x l
l
e
l x
l
,
=
, α=1,
2
P
=
2 0 01 !
1
1
!
!
1 !
1
l
c x x
x l
l
e
l x
l
3P
=
1
-
P
1-
P
2Using the above procedure, tables can be constructed
to facilitate easy selection of MSP using IRPD as a
baseline distribution. The tables furnished in this paper
are for the case when α=1.
VI.
C
ONSTRUCTIONO
FM
IXEDS
AMPLINGP
LANSI
NDEXEDT
HROUGHMAPD
A
NDMAAOQ
MAPD, introduced by Mayer (1967) and studied by
Soundararajan (1975) is the quality level corresponding
to the inflection point of the OC curve. The degree of
sharpness of inspection about this quality level „
p
*‟ is
measured by „
p
t‟, the point at which the tangent to the
OC curve at the inflection point cuts the proportion
defective axis.
For designing, Soundararajan (1975) proposed a
selection procedure for single sampling plan indexed
with MAPD and K=
p
tp
*.
Using the probability mass function of the IRPD,
given in expression (3), the inflection point (
p
*) is
obtained by using
2 2
( )
0
a
d P p
dp
=
and
3 3
( )
a
d P p
dp
≠0. The
n
2MAPD values are calculated for different values of c
1,
c
2and ρ=0.5 for
*
0.24 using c++ program and
presented in Table 1.
The
MAAOQ
(Maximum
Allowable
Average
Outgoing Quality) of a sampling plan is defined as the
Average Outgoing Quality (AOQ) at the MAPD.
By definition AOQ =
p
P p
a( )
and MAAOQ =
p
**
(
)
aInternational Journal of Emerging Technology and Advanced Engineering
Website: www.ijetae.com (
ISSN 2250-2459
, Volume 2, Issue 10, October 2012)
215
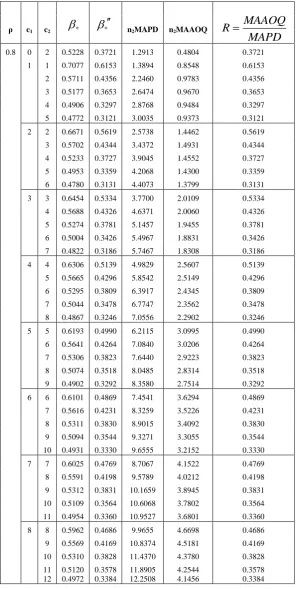
The values of MAPD and MAAOQ are calculated for
different values of c
1, c
2and ρ for
*
0.24 and the
ratio
R
MAAOQ
MAPD
is presented in Table 1.
Selection of the plan
For the given values of ρ,
*
, MAPD and MAAOQ,
the ratio
R
MAAOQ
MAPD
is found and the nearest value
of R is located in Table 1. The corresponding c
1, c
2and
n
2MAPD values are noted and the value of n
2is obtained
using
2 2n MAPD
n
MAPD
.
Example 1:
Given ρ=0.5,
*
0.24
,
MAPD=0.0470
and
MAAOQ=0.0102,
the
ratio
0.0102
0.2170
0.0470
MAAOQ
R
MAPD
is computed. In
Table 1 the nearest R value is 0.2173 which is
corresponding to c
1=5, c
2=8. The value of
n
2MAPD=8.8761 is found and hence the value of n
2is
determined as
n
2n MAPD
2MAPD
8.8761
189
0.0470
.
Thus n
2=189, c
1=5 and c
2=8 are the parameters of
mixed sampling plan having conditional RGS as attribute
plan using IRPD as a baseline distribution for the given
values of ρ=0.5, MAPD=0.0470 and MAAOQ =0.0102.
VII.
C
ONSTRUCTIONO
FM
IXEDS
AMPLINGP
LANSI
NDEXEDT
HROUGHIQL
The procedure given in section 5 is used for
constructing the mixed sampling plan indexed through
IQL (
p
0). By assuming the probability of acceptance of
the lot be
0=0.50 and
0
0.24
, the
n p
2 0values
are calculated for different values of c
1, c
2and „ρ‟ using
c++ program and is presented in Table 2.
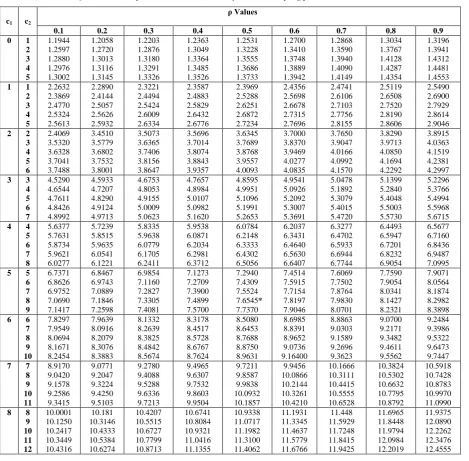
Selection of the plan
Table 2 is used to construct the plans when
p
0, ρ, c
1,
and c
2are given. For any given values of
p
0, ρ, c
1, and
c
2one can determine n
2value using
2 0 2
0
n p
n
p
.
Example 2:
Given ρ=0.5,
p
0=0.0346, c
1=5
,c
2=8,
0
0.24
.
Using
Table
2,
find
2 2 00
7.6545
221
0.0346
n p
n
p
.
For
a
fixed
0
0.24
, the mixed sampling plan with
conditional RGS as attribute plan is n
2=221, ρ=0.5, c
1=5
and c
2=8.
VIII.
C
OMPARISONO
FM
IXEDS
AMPLINGP
LANI
NDEXEDT
HROUGHMAPD
A
NDIQL
In this section MSP indexed through MAPD is
compared with MSP indexed through IQL by fixing the
parameters c
1, c
2and
j
.
For the specified values of ρ, MAPD and MAAOQ
with the assumption for
*
0.24
one can find the
values of c
1and c
2indexed through MAPD. By fixing
the values of c
1and c
2find the value of
p
0by
equating
P p
a( )
=
0=0.50. For
0
0.24
,
c
1and c
2one can find the values of n
2using
2 2 0 0n p
n
p
from
Table 2. For different combinations of ρ, MAPD and
MAAOQ the values of c
1, c
2, and n
2(indexed through
MAPD) and c
1, c
2, and n
2(indexed through IQL) are
calculated and presented in Table 3.
Construction of OC curve
The OC curves for the plan ρ=0.5, n
2=189, c
1=5, c
2=8
(indexed through MAPD) and n
2=221, c
1=5, c
2=8
(indexed through IQL) based on the different values of
„n
2p
0‟ and
P p
a( )
are presented in Figure 1.
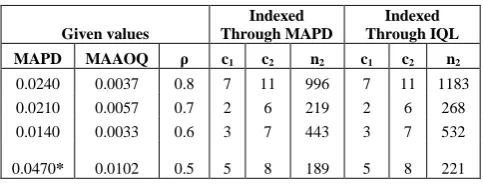
Table III Comparison of the Plans
Given values
Indexed Through MAPD
Indexed Through IQL
MAPD MAAOQ ρ c1 c2 n2 c1 c2 n2
0.0240 0.0037 0.8 7 11 996 7 11 1183 0.0210 0.0057 0.7 2 6 219 2 6 268 0.0140 0.0033 0.6 3 7 443 3 7 532
[image:4.595.312.554.612.704.2]
International Journal of Emerging Technology and Advanced Engineering
Website: www.ijetae.com (
ISSN 2250-2459
, Volume 2, Issue 10, October 2012)
216
*
OC curves are drawn
Fig1: OC curves for the plans (ρ=0.5, c1=5, c2=8, n2=189) and
(ρ=0.5, c1=5, c2=8, n2=221)
IX.
C
ONCLUSIONIn this paper the construction of mixed sampling plan
with conditional repetitive group sampling plan as
attribute plan indexed through the parameters MAPD and
IQL are presented by taking IRPD as a baseline
distribution. Further the plan indexed through MAPD is
compared with the plan indexed through IQL. It is
concluded from the study that the second stage sample
size required for conditional repetitive group sampling
plan indexed through MAPD is less than that of second
stage sample size of the conditional repetitive group
sampling plan indexed through IQL. If the floor
engineers know the levels of MAPD or IQL, they can
have their sampling plans on the floor itself by referring
to the tables. This provides the flexibility to the floor
engineers in deciding their sampling plans.
Various plans can also be constructed to make the
system user friendly by changing the first stage
probabilities (
*
,
0
) and can also be compared for
their efficiency.
REFERENCES
[1 ] Devaarul, S. Certain Studies Relating to Mixed Sampling Plans and Reliability Based Sampling Plans, Ph.D., Dissertation, Bharathiar University, Coimbatore, Tamil Nadu, India, 2003. [2 ] Kuralmani, V. Studies on Designing Minimum Inspection
Attribute Acceptance Sampling Plans, Ph.D., Thesis, Department of Statistics, Bharathiar University, Coimbatore, Tamilnadu, India, 1992.
[3 ] Mayer, P.L. “A note on sum of Poisson probabilities and an application,” Annals of Institute of Statistical Mathematics, Vol.19, pp.537-542, 1967.
[4 ] Radhakrishnan, R. Contribution to the Study on Selection of Certain Acceptance Sampling Plans, Ph.D., Dissertation, Bharathiar University, Tamilnadu, India, 2002.
[5 ] Radhakrishnan, R. and Sekkizhar, J. “Construction of sampling plans using intervened random effect Poisson distribution,” The International Journal of Statistics and Management Systems, Vol.2, 1-2, pp 88-97, 2007a.
[6 ] Radhakrishnan, R. and Sekkizhar, J. Construction of conditional double sampling plans using intervened random effect Poisson distribution, Proceedings volume of SJYSDNS-2005, Acharya Nagarjuna University, Guntur. pp.57-61. 2007b.
[7 ] Radhakrishnan, R. and Sekkizhar, J. “Application of intervened random effect Poisson distribution in process control plans,” International Journal of Statistics and Systems. Vol. 2. No.1. pp.29-39, 2007c.
[8 ] Sampath Kumar, R. Construction and Selection of Mixed Variables – Attributes Sampling Plans, Ph.D., Dissertation, Bharathiar University, Coimbatore, Tamil Nadu, India, 2007. [9 ] Sampath Kumar, R., Indra, M., and Radhakrishnan, R. “Selection
of mixed sampling plans with QSS-1(n;cN,cT) plan as attribute
plan indexed through MAPD and AQL,” Indian Journal of Science and Technology, Vol.5, No.2, Feb 2012, pp. 2096- 2099, 2012.
[10 ]Sampath Kumar, R., Kiruthika, R., and Radhakrishnan, R. “Construction of mixed sampling plans indexed through MAPD and LQL with Double sampling plan as attribute plan using Weighted Poisson distribution,” International Journal of Electronics and Communication Engineering, Vol.5, No.3, pp. 39-47, 2012.
[11 ]Sampath Kumar, R., Sumithra, S., and Radhakrishnan, R. “Selection of mixed sampling plan with chsp-1 plan as attribute plan indexed through MAPD and MAAOQ,” International Journal of Applied Computational Science and Mathematics, Vol.1, No.1, pp. 37- 44, 2012.Sampath Kumar, R., Vijayakumar, R. and Radhakrishnan, R. “Selection of Mixed Sampling plan with double Sampling Plan as Attribute Plan Indexed through MAPD and IQL Using intervened random effect Poisson distribution,” International Journal of Industries Engineering and Technology. Vol.4, No.1, Jan- June 2012,pp.29-36, 2012. [12 ]Sampath Kumar, R., Vijayakumar, R. and Radhakrishnan, R.
“Selection of Mixed Sampling plan with Conditional Double Sampling Plan as Attribute Plan Indexed through MAPD and LQL using IRPD,” International Journal of Computational Engineering Research. Vol.2, No.2, Mar-Apr 2012, pp.306-313, 2012.
[13 ]Schilling, E.G. A General Method for Determining the Operating Charateristics of Mixed Variables –Attribute Sampling Plans Single Side Specifications, S.D. known, Ph.D., Dissertation – Rutgers – The State University, New Brunswick, New Jersy, 1967.
[14 ]Shanmugam, R. “An intervened Poisson distribution and its medical applications,” Biometrics, 41, 1025-1029, 1985. [15 ]Sherman, R.E. “Design and evaluation of a repetitive group
sampling plan,” Technometrics, Vol.7, No.1, pp.11-21, 1965. [16 ]Soundararajan, V. “Maximum allowable percent defective
International Journal of Emerging Technology and Advanced Engineering
Website: www.ijetae.com (
ISSN 2250-2459
, Volume 2, Issue 10, October 2012)
[image:6.595.150.448.160.750.2]217
Table In2MAPD and n2MAAOQ values for a specified values of c1, c2 and different values of ρ for mixed sampling plan when 0.24
ρ c1 c2
*
*
n2MAPD n2MAAOQ
MAAOQ
R
MAPD
International Journal of Emerging Technology and Advanced Engineering
Website: www.ijetae.com (
ISSN 2250-2459
, Volume 2, Issue 10, October 2012)
218
ρ c1 c2
*
*
n2MAPD n2MAAOQ
MAAOQ
R
MAPD
International Journal of Emerging Technology and Advanced Engineering
Website: www.ijetae.com (
ISSN 2250-2459
, Volume 2, Issue 10, October 2012)
219
ρ c1 c2
*
*
n2MAPD n2MAAOQ
MAAOQ
R
MAPD
International Journal of Emerging Technology and Advanced Engineering
Website: www.ijetae.com (
ISSN 2250-2459
, Volume 2, Issue 10, October 2012)
220
ρ c1 c2
*
*
n2MAPD n2MAAOQ
MAAOQ
R
MAPD
0.5 1 3 0.4188 0.2352 3.1599 0.7432 0.2352 4 0.3973 0.2069 3.3911 0.7016 0.2069 5 0.3879 0.1946 3.5085 0.6827 0.1946 2 2 0.5370 0.3907 3.3485 1.3082 0.3907 3 0.4600 0.2894 4.0902 1.1837 0.2894 4 0.4213 0.2385 4.5308 1.0805 0.2385 5 0.3984 0.2084 4.8273 1.0060 0.2084 6 0.3849 0.1906 5.0225 0.9572 0.1906 3 3 0.5169 0.3643 4.6995 1.7120 0.3643 4 0.4574 0.2860 5.4063 1.5462 0.2860 5 0.4234 0.2413 5.8646 1.4151 0.2413 6 0.4012 0.2121 6.1967 1.3143 0.2121 7 0.3867 0.1930 6.4348 1.2419 0.1930 4 4 0.5035 0.3467 6.0397 2.0939 0.3467 5 0.4546 0.2823 6.7222 1.8976 0.2823 6 0.4244 0.2426 7.1891 1.7440 0.2426 7 0.4035 0.2151 7.5420 1.6222 0.2151 8 0.3889 0.1959 7.8086 1.5297 0.1959 5 5 0.4932 0.3331 7.3802 2.4583 0.3331 6 0.4517 0.2785 8.0408 2.2393 0.2785 7 0.4246 0.2428 8.5124 2.0668 0.2428 8 0.4052 0.2173 8.8761 1.9287 0.2173*
International Journal of Emerging Technology and Advanced Engineering
Website: www.ijetae.com (
ISSN 2250-2459
, Volume 2, Issue 10, October 2012)
[image:10.595.67.537.156.617.2]221
Table IIn2 IQL values for a specified values of c1, c2 and ρ of mixed sampling plan when =0.50 and =0.24
ρ Values
c1 c2
0.1 0.2 0.3 0.4 0.5 0.6 0.7 0.8 0.9
0 1 1.1944 1.2058 1.2203 1.2363 1.2531 1.2700 1.2868 1.3034 1.3196
2 1.2597 1.2720 1.2876 1.3049 1.3228 1.3410 1.3590 1.3767 1.3941
3 1.2880 1.3013 1.3180 1.3364 1.3555 1.3748 1.3940 1.4128 1.4312
4 1.2976 1.3116 1.3291 1.3485 1.3686 1.3889 1.4090 1.4287 1.4481
5 1.3002 1.3145 1.3326 1.3526 1.3733 1.3942 1.4149 1.4354 1.4553
1 1 2.2632 2.2890 2.3221 2.3587 2.3969 2.4356 2.4741 2.5119 2.5490
2 2.3869 2.4144 2.4494 2.4883 2.5288 2.5698 2.6106 2.6508 2.6900
3 2.4770 2.5057 2.5424 2.5829 2.6251 2.6678 2.7103 2.7520 2.7929
4 2.5324 2.5626 2.6009 2.6432 2.6872 2.7315 2.7756 2.8190 2.8614
5 2.5613 2.5932 2.6334 2.6776 2.7234 2.7696 2.8155 2.8606 2.9046
2 2 2.4069 3.4510 3.5073 3.5696 3.6345 3.7000 3.7650 3.8290 3.8915
3 3.5320 3.5779 3.6365 3.7014 3.7689 3.8370 3.9047 3.9713 4.0363
4 3.6328 3.6802 3.7406 3.8074 3.8768 3.9469 4.0166 4.0850 4.1519
5 3.7041 3.7532 3.8156 3.8843 3.9557 4.0277 4.0992 4.1694 4.2381
6 3.7488 3.8001 3.8647 3.9357 4.0093 4.0835 4.1570 4.2292 4.2997
3 3 4.5290 4.5933 4.6753 4.7657 4.8595 4.9541 5.0478 5.1399 5.2296
4 4.6544 4.7207 4.8053 4.8984 4.9951 5.0926 5.1892 5.2840 5.3766
5 4.7611 4.8290 4.9155 5.0107 5.1096 5.2092 5.3079 5.4048 5.4994
6 4.8426 4.9124 5.0009 5.0982 5.1991 5.3007 5.4015 5.5003 5.5968
7 4.8992 4.9713 5.0623 5.1620 5.2653 5.3691 5.4720 5.5730 5.6715
4 4 5.6377 5.7239 5.8335 5.9538 6.0784 6.2037 6.3277 6.4493 6.5677
5 5.7631 5.8515 5.9638 6.0871 6.2148 6.3431 6.4702 6.5947 6.7160
6 5.8734 5.9635 6.0779 6.2034 6.3333 6.4640 6.5933 6.7201 6.8436
7 5.9621 6.0541 6.1705 6.2981 6.4302 6.5630 6.6944 6.8232 6.9487
8 6.0277 6.1221 6.2411 6.3712 6.5056 6.6407 6.7744 6.9054 7.0995
5 5 6.7371 6.8467 6.9854 7.1273 7.2940 7.4514 7.6069 7.7590 7.9071
6 6.8626 6.9743 7.1160 7.2709 7.4309 7.5915 7.7502 7.9054 8.0564
7 6.9752 7.0889 7.2827 7.3900 7.5524 7.7154 7.8764 8.0341 8.1874
8 7.0690 7.1846 7.3305 7.4899 7.6545* 7.8197 7.9830 8.1427 8.2982
9 7.1417 7.2598 7.4081 7.5700 7.7370 7.9046 8.0701 8.2321 8.3898
6 6 7.8297 7.9639 8.1332 8.3178 8.5080 8.6985 8.8863 9.0700 9.2484
7 7.9549 8.0916 8.2639 8.4517 8.6453 8.8391 9.0303 9.2171 9.3986
8 8.0694 8.2079 8.3825 8.5728 8.7688 8.9652 9.1589 9.3482 9.5322
9 8.1671 8.3076 8.4842 8.6767 8.8750 9.0736 9.2696 9.4611 9.6473
10 8.2454 8.3883 8.5674 8.7624 8.9631 9.16400 9.3623 9.5562 9.7447
7 7 8.9170 9.0771 9.2780 9.4965 9.7211 9.9456 10.1666 10.3824 10.5918
8 9.0420 9.2047 9.4088 9.6307 9.8587 10.0866 10.3111 10.5302 10.7428
9 9.1578 9.3224 9.5288 9.7532 9.9838 10.2144 10.4415 10.6632 10.8783
10 9.2586 9.4250 9.6336 9.8603 10.0932 10.3261 10.5555 10.7795 10.9970
11 9.3415 9.5103 9.7213 9.9504 10.1857 10.4210 10.6528 10.8792 11.0990
8 8 10.0001 10.181 10.4207 10.6741 10.9338 11.1931 11.448 11.6965 11.9375
9 10.1250 10.3146 10.5515 10.8084 11.0717 11.3345 11.5929 11.8448 12.0890
10 10.2417 10.4333 10.6727 10.9321 11.1982 11.4637 11.7248 11.9794 12.2262
11 10.3449 10.5384 10.7799 11.0416 11.3100 11.5779 11.8415 12.0984 12.3476