SIMULATION AND EXPERIMENTAL STUDY OF DOUBLE HOLES FILM COOLING
MOHD HAZIM FADLI BIN AMINNUDDIN
A project report submitted in
fulfillment of the requirement for the award of the Degree of Master of Mechanical Engineering
Faculty of Mechanical Engineering and Manufacture University Tun Hussein Onn Malaysia
ACKNOWLEDGEMENT
In the name of Allah I shall begin.
Through the worst and the best out of me, He kept me going forward to achieve what had been fated in this long journey. I shall not stop to reach out the true meaning for the steps that I have taken from the very beginning.
With all my respect and sincerely gratitude to Dr. Mohammad Kamil Abdullah for every words, wisdom, jokes, idea and everything that he thought me during my whole thesis writing and experiment session. Throughout the year we had, so much constraint we had been going through without a single hesitation in decision making. Such a great supervisor.
Special thanks to my beloved housemate Haswira for everything that we had fought and shared before. For every knowledge and ideas, thank you for such memories.
ABSTRACT
ABSTRAK
CONTENTS
TITLE i
DECLARATION ii
ACKNOWLEDGEMENT iv
ABSTRACT v
ABSTRAK vi
CONTENTS vii
LIST OF TABLES ix
LIST OF FIGURES x
LIST OF SYMBOLS AND ABBREVIATIONS xvii
LIST OF APPENDICES xviii
CHAPTER 1 INTRODUCTION 1
1.1 Introduction 1
1.2 Background of Study 5
1.3 Problem Statement 5
1.4 Importance of Research 6
1.5 Objectives 6
1.6 Scope of studies 6
CHAPTER 2 LITERATURE REVIEW 8
2.1 Introduction 8
2.2 Film cooling and counter rotating vortex pair
concepts 9
2.3 Previous Research 11
2.3.1 Early development of cooling holes 11
2.3.2 Upstream ramp effects 13
2.3.3 Advanced film cooling 14
2.3.4.2 Influence of turbulence intensity 17
CHAPTER 3 METHODOLOGY 19
3.1 Introduction 19
3.2 Flow chart 20
3.3 Simulation study 22
3.3.1 Computational domain 22
3.2.2 Mesh dependency test 23
3.2.3 Boundary condition and simulation setup 26
3.2.4 Performances indicator 30
3.4 Experimental study 32
CHAPTER 4 RESULT AND DISCUSSION 38
4.1 Introduction 38
4.2 Mesh dependency test 39
4.3 CFD results validation 41
4.4 Effects of turbulence intensities on film cooling
effectiveness 45
4.5 Effects of pitch distance on film cooling
effectiveness 53
4.6 Effects of length between holes (LoD) on film
cooling effectiveness 60
4.7 Effects of compound angle on film cooling
effectiveness 67
4.8 Effect of turbulence intensities on film cooling
effectiveness 74
4.9 Area averaged effectiveness vs total pressure loss
coefficient 83
CHAPTER 5 CONCLUSION AND RECOMMENDATION 88
5.1 Conclusion 88
5.2 Recommendation for Future Work 89
REFERENCES 91
LIST OF TABLES
3.1 Flow parameters details 27
3.2 Single cylindrical hole (SCH) coolant mass flow rate
28
3.3 Double cylindrical hole (DCH) coolant mass flow rate
28
3.4 Details of simulation setup 29
3.5 Parameter and apparatus for experimental measurement
36
4.1 The number of nodes and elements for coarse, medium and fine mesh.
LIST OF FIGURES
1.1 Gas-turbine engine layout 2
1.2 T-s diagram and P-v diagram 2
1.3 The cooling air passages inside the blade and the others internal cooling hole embedded in turbine blades
4
1.4 Illustration of the geometrical parameters of the present study
7
2.1 The chart of specific core power of gas turbine 9 2.2 Formation of the CRVP by the single
cylindrical cooling hole
10
2.3 Formation of vortices produced by the combined hole
10
2.4 Cylindrical hole, Fan-shaped hole, and Laidback fan-shaped hole details
12
2.5 Example of trenched film cooling hole geometry
12
2.6 Test model schematic diagram 14
2.7 Single cylindrical hole arrangement, fan-shaped laidback hole, and double cylindrical holes
15
2.8 Graph of film cooling effectiveness, η versus streamwise location, x/Ms0 for varying
blowing ratio
16
2.9 Comparison of blowing ratios on film cooling effectiveness, η and streamwise location, x/d
from the experimental result of Ligrani and Lee
2.10 The vorticity contour produced for M = 1 and M = 2 at plane y/D versus x/D
17
2.11 Influence of turbulence intensity on centerline of film cooling effectiveness, η at different streamwise location, x/D for M=0.5 and M=1.7
18
2.12 Film cooling effectiveness at low and high turbulence at plane z/D versus x/D
18
3.1 The flowchart details 20
3.2 The flow of components in ANSYS CFX 22
3.3 Isometric view for SCH and DCH 23
3.4 Sample of computational domain 23
3.5(a) Upstream ramp dimension details; Rectangular ramp
24
3.5(b) Upstream ramp dimension details; Triangular ramp
24
3.6 Computational domain meshes 25
3.7 Inflation for DCH mesh at the cooling hole 25
3.8 Details of boundary conditions 26
3.9 Experimental layout 32
3.10 The dimension of the flat plate 35
3.11 The location of infrared thermography camera, valves and flat plate
35
3.12(a) Valve 1 open and Valve 2 closed 34
3.12(b) Valve 1 closed and Valve 2 open 34
3.13 Graph of y/δ versus u/U∞ of the velocity profile
comparison
35
3.14 Contoured IR Thermography images imported into the Excel grids
37
4.1 Mesh dependency test 40
4.2 Results of the present experiment of case 2D45 on different blowing ratios
4.3 Laterally averaged film cooling effectiveness, ƞlat.avg at different location, x/D comparison at
M = 0.5
42
4.4 Laterally averaged film cooling effectiveness, ƞlat.avg at different location, x/D comparison at
M = 1.0
42
4.5 Laterally averaged film cooling effectiveness, ƞlat.avg at different location, x/D comparison at
M = 1.5
43
4.6 All blowing ratio and turbulence intensities for 2D45 at x/D and z/D plane
45
4.7 Temperature distribution contour at y/D and z/D plane for turbulence intensities cases at blowing ratio, M = 0.5
46
4.8 Temperature distribution contour at y/D and z/D plane for turbulence intensities cases at blowing ratio, M = 1.0
46
4.9 Temperature distribution contour at y/D and z/D plane for turbulence intensities cases at blowing ratio, M = 1.5
47
4.10 Laterally averaged film cooling effectiveness, ƞlat.avg at different location, x/D for turbulence
intensities cases at M = 0.5
48
4.11 Laterally averaged film cooling effectiveness, ƞlat.avg at different location, x/D for turbulence
intensities cases at M = 1.0
49
4.12 Laterally averaged film cooling effectiveness, ƞlat.avg at different location, x/D for turbulence
intensities cases at M = 1.5
49
4.13 Type of the vortices formed 50
4.14 The isosurface of the vortices formed 51 4.15 Vorticity contour plot comparison at y/D and
z/D plane for turbulence intensities cases
4.16 Film cooling distribution PoD and compound angle cases at M = 0.5, 1.0 and 1.5 at x/D and z/D plane
53
4.17 Temperature distribution contour for PoD cases at blowing ratio, M = 0.5 at y/D and z/D plane
54
4.18 Temperature distribution contour for PoD cases at blowing ratio, M = 1.0 at y/D and z/D plane
54
4.19 Temperature distribution contour for PoD cases at blowing ratio, M = 1.5 at y/D and z/D plane
55
4.20 Lateral average film cooling effectiveness, ƞlat.avg at different location, x/D of PoD cases at
M = 0.5
56
4.21 Lateral average film cooling effectiveness, ƞlat.avg at different location, x/D of PoD cases at
M = 1.0
57
4.22 Lateral average film cooling effectiveness, ƞlat.avg at different location, x/D of PoD cases at
M = 1.5
57
4.23 Detachment and reattachment for 4D35 case at M = 1.5
58
4.24 Vorticity contour plot for 2D35, 3D35 and 4D35 for all blowing ratios at x/D = 5 on y/D and z/D plane
59
4.25 Film cooling effectiveness contour of LoD cases on x/D and z/D plane at M = 0.5
60
4.26 Temperature distribution contour for LoD cases at blowing ratio, M = 0.5 on y/D and z/D plane
4.27 Temperature distribution contour for LoD cases at blowing ratio, M = 1.0 on y/D and z/D plane
62
4.28 Temperature distribution contour for LoD cases at blowing ratio, M = 1.5 on y/D and z/D plane
62
4.29 Laterally averaged film cooling effectiveness, ƞlat.avg at different location, x/D for LoD cases
at M = 0.5
64
4.30 Laterally averaged film cooling effectiveness, ƞlat.avg at different location, x/D for LoD cases
at M = 1.0
64
4.31 Laterally averaged film cooling effectiveness, ƞlat.avg at different location, x/D for LoD cases
at M = 1.5
65
4.32 Vorticity contour plot comparison for LoD cases on y/D and z/D plane
66
4.33 Film cooling distribution for case 3D35, 3D40 and 3D45 at M=0.5, 1.0 and 1.5 on x/D and z/D plane
67
4.34 Temperature distribution contour for compound angle cases at blowing ratio, M = 0.5 on y/D and z/D plane
68
4.35 Temperature distribution contour for compound angle cases at blowing ratio, M = 1.0 on y/D and z/D plane
68
4.36 Temperature distribution contour for compound angle cases at blowing ratio, M = 1.5 on y/D and z/D plane
69
4.37 Laterally averaged film cooling effectiveness, ƞlat.avg at different location, x/D for compound
angle cases at M = 0.5
4.38 Laterally averaged film cooling effectiveness, ƞlat.avg at different location, x/D for compound
angle cases at M = 1.0
71
4.39 Laterally averaged film cooling effectiveness, ƞlat.avg at different location, x/D for compound
angle cases at M = 1.5
72
4.40 Vorticity contour plot for 3D35, 3D40 and 3D45 for all blowing ratios at x/D = 5 on y/D and z/D plane
73
4.41 Comparison of film cooling effectiveness contour between 2D35 and 2D35 upstream ramp cases.
74
4.42 Backflow velocity vector of case 2D35 Rec Ramp at M = 1.5
75
4.43 Temperature distribution contour for upstream ramp cases at blowing ratio, M = 0.5 on y/D and z/D plane
76
4.44 Temperature distribution contour for upstream ramp cases at blowing ratio, M = 1.0 on y/D and z/D plane
76
4.45 Temperature distribution contour for upstream ramp cases at blowing ratio, M = 1.5 on y/D and z/D plane
77
4.46 Laterally averaged film cooling effectiveness for upstream ramp cases M=0.5
78
4.47 Laterally averaged film cooling effectiveness for upstream ramp cases M=1.0
78
4.48 Laterally averaged film cooling effectiveness for upstream ramp cases M=1.5
79
4.49 Velocity profile of upstream ramp cases located at x/D = -1 and z/D = 0 on blowing ratio 0.5
4.50 Velocity profile of upstream ramp cases located at x/D = 0 and z/D = 0 on blowing ratio 0.5
80
4.51 Velocity profile of upstream ramp cases located at x/D = 1 and z/D = 0 on blowing ratio 0.5
81
4.52 Vorticity contour plot comparison for upstream ramp cases on y/D and z/D plane at different blowing ratio, M
81
4.53 Area averaged effectiveness for all cases 83 4.54 Total pressure loses graph for all cases 85 4.55 Normalize total pressure loss coefficient vs
normalize area averaged effectiveness at M = 0.5
86
4.56 Normalize total pressure loss coefficient vs normalize area averaged effectiveness at M = 1.0
86
4.57 Normalize total pressure loss coefficient vs normalize area averaged effectiveness at M = 1.5
LIST OF SYMBOLS AND ABBREAVIATIONS
A - Area
CRVP - Counter Rotating Vortex Pair D,d - Diameter
DCH - Double Cooling Holes DR - Density Ratio
LoD - Distance between holes in streamwise direction M - Blowing ratio
PoD - Pitch distance
RANS - Reynolds Averaged Navier Stokes Re - Reynolds number
SCH - Single cooling hole
T - Temperature
Tjet - Coolant temperature
T∞ - Mainstream temperature
Taw - Surface temperature
Tu - Turbulence intensities ujet - Coolant velocity
u∞ - Mainstream velocity
Ԑ - Dimensionless temperature θ - Inclination angle
Ƞ - Film cooling effectiveness
α - Compound angle
ṁ - Mass flow rate
ρ - Density
ρjet - Coolant density
LIST OF APPENDICES
APPENDIX TITLE PAGE
A Gantt chart 87
B Cases matrix 88
INTRODUCTION
CHAPTER 1
1.1 Introduction
Gas turbine engine are widely used in land based power plant and aircraft making its overall efficiency has been a key research topic in the turbo machinery industry. Gas turbine generates power by the burning of gasoline, oil, or other fuel which produces hot gases that will be expanded while producing work. At the early stage of its introduction, gas turbines have been used mainly in the aviation industry to power the aircraft. The history starts when Frank Whittle patented the first gas turbine which involved a compressor unit with two axial stages, followed by a centrifugal stage, an axial cannular combustor with fuel nozzle and two stages axial turbine in 1930 [1]. On 12 April 1937, Whittle has successfully tested the world’s first kerosene-fueled jet engine known as Whittle Unit (W.U).
Figure 1.1: Gas-turbine engine layout. (Adapted from [2]).
Figure 1.2: T-s diagram and P-v diagram [3].
Figure 1.2 shows the temperature versus entropy, T-s and pressure versus volume, P-v diagrams for gas turbine. Ideally, gas turbine operates in a Brayton’s cycle involving four main process [3]. At stage 1-2, fresh ambient air will be drawn in by the compressor and been compressed to a higher temperature and pressure before entering the next stage of 2-3. In this stage, these high pressure air then are sent into a combustion chamber along with the injected fuel, where it is burned at constant pressure, Qin. Meanwhile in stage 3-4, the high temperature gas will flow through the
turbine resulting it to expand to the ambient pressure while producing power, Wout.
Finally at stage 4-1, the exhaust gases leave the turbine with constant pressure heat rejection, Qout. The overall thermal efficiency of the Brayton’s cycle as in standard
η
th,Brayton=
𝑤𝑛𝑒𝑡𝑡
𝑞𝑖𝑛
=
1 −
𝑇4𝑇3
(1.1)
Equation 1.1 shows that the efficiency of the gas turbine is proportional towards the turbine inlet temperature (TIT), T3, where higher TITwill produce higher
cycle efficiency, which has been the approach in development of the modern gas turbine. In comparison with the early stage of gas turbine operation, the modern gas turbines are now operating at temperature exceeding 1800 ̊C. This high TIT is considered as a significant progress in comparison with the initial TIT of the Whittle’s gas turbine which operating at 760 ̊C [4]. The improvement has been made possible by the progress made in material development and the introduction of thermal cooling system.
In the conventional jet engines, the limiting factor is on the performance of the material used for hot section (e.g.: combustor and turbine). The need for better materials spurred much research in the field of alloys and manufacturing techniques, and resulted in a long list of new materials and methods that make modern gas turbines possible. In the 1940s and 1950s, superalloys and vacuum induction melting which is the new processing methods have been developed and greatly increased the turbine blades temperature capabilities [5]. In modern turbine blade, the material that often used is nickel-based superalloys that incorporate chromium, cobalt and rhenium. Another major improvement to turbine blade material technology was the development of thermal barrier coatings (TBC). As the temperature increases, these TBCs will improvise the blade corrosion and oxidation resistance. The first TBCs applied was on 1970s using aluminide coating and in 1980s the coating has been improved into ceramic coating [5]. These coatings improve the turbine blade temperature capabilities nearly 90 ̊C and also doubling the life of the blades in some cases.
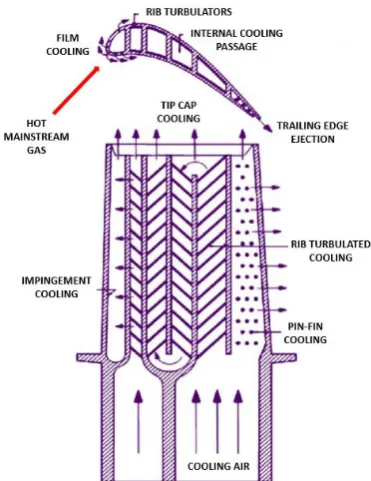
known as the convection cooling. As the coolant pick-up the heat along the passages, some of the coolant will be released through the film cooling. As for external cooling in the gas turbine, several cooling techniques (impingement cooling, pin fin cooling, rib turbulated cooling and tip cap cooling) have been applied and the present study is focusing on the most common technique, film cooling.
1.2 Background of study
The film cooling technique is achieved by allowing the coolant to be injected out from the turbine blade's body through cooling holes. The injected coolant will form a thin cool layer that covering the blade surface. Most of the available film cooling is using a single hole cylindrical or shaped holes. A lot of researches have been done to improve the performance of the film cooling [6]. The film cooling effectiveness produced by a cylindrical hole is exposed to the Counter Rotating Vortex Pair (CRVP) phenomena [7]. This CRVP will affect the film cooling effectiveness, which will further discuss later on in this writing. The present research trend shows a lot of efforts have been made on proposing new cooling hole geometry to reduce the formation of CRVP effect which includes trenched hole and anti-vortex hole. Although the shaped hole known to produce better film cooling effectiveness, single hole is still been used extensively due to its manufacturability. Wright et al. [8] have proposed a new geometry of film cooling known as double cylindrical hole. This geometry utilizes a pair of cylindrical film cooling of approximately the same diameter. Effective utilization of cylindrical hole arrangement will be able to reduce the manufacturing cost associated with shaped hole.
1.3 Problem statements
1.4 Importance of research
The importance of the present research is to provide extended information on double cylindrical hole film cooling effectiveness at various geometrical and flow parameters. The study will also provides information on the flow field of the double cylindrical hole which could be crucial for future study.
1.5 Objectives
The objectives of the study are:-
a) To validate the film cooling effectiveness prediction by the experimental. b) To predict the film cooling effectiveness of DCH based on the effects of
various geometrical and flow parameters
c) To clarify the performance of upstream ramp in improving the film cooling effectiveness
1.6 Scope of studies
This section will describe on the scope of the study involving the geometrical parameters and flow parameters.
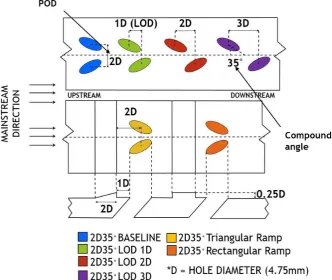
As shown in Figure 1.4, the scope for geometrical parameters of the present study are;
a) Three compound angle, α are considered; α = 35°, 40° and 45°. b) The pitch distance, PoD = 2D, 3D and 4D.
c) The distance between holes in streamwise direction, LoD = 1D, 2D and 3D. d) Two types of upstream ramps; Triangular ramp and Rectangular ramp.
Meanwhile, the scope for flow parameters of the present study; a) Three blowing ratios, M = 0.5, 1.0 and 1.5
CHAPTER 2
LITERATURE REVIEW
2.1 Introduction
Figure 2.1: The chart of specific core power of gas turbine [9]
2.2 Film cooling and counter rotating vortex pair concepts
the effectiveness of the film cooling. In the present study, there are two single cylindrical holes facing each other with specific angles, which will be discuss in detail later in the methodology.
Figure 2.2: Formation of the CRVP by the single cylindrical cooling hole. [10]
[image:27.595.195.443.414.716.2]2.3 Previous research
2.3.1 Early development of cooling holes
Figure 2.4: Cylindrical hole, Fan-shaped hole, and Laidback fan-shaped hole. [15]
Islami et al. [17] have proposed a new arrangement of film cooling known as a trenched hole. This study presents a comparative-numerical investigation of film cooling from a row of simple and compound-angle holes injected at 35° on a flat plate with four film cooling arrangements: (1) cylindrical film hole; (2) 15° forward diffused film hole; (3) trenched cylindrical film hole; (4) trenched 15° forward-diffused film hole. All the simulations are at a fixed density ratio of 1.6, blowing ratio of 1.25, diameter L/D = 4 and pitch-to-diameter ratio of 3.0. The effect of length-to-diameter ratio on film cooling has also been investigated using L/D in the range of 1 to 8. Computational solutions of the steady, Reynolds-averaged Navier–Stokes equations were obtained by using a finite volume method.
[image:29.595.197.429.492.689.2]It has been reported that the shape of the hole and the trenched holes can significantly affect the film cooling flow over the protected surface. Figure 2.5 shows the example of the trenched film cooling hole geometry. Furthermore, it has been shown that the film cooling effectiveness produced by trenched shaped holes is higher in comparison to the other arrangements, both in spanwise and streamwise especially downstream of the injection. A trenched compound angle injection shaped hole also produces much higher film cooling protection than the other investigated arrangements. The length-to-diameter ratio of trenched holes was found to have a significant effect on film cooling effectiveness and the spread of the coolant jets.
2.3.2 Upstream ramp effects
Figure 2.6: Test model schematic diagram. [21]
2.3.3 Advanced film cooling
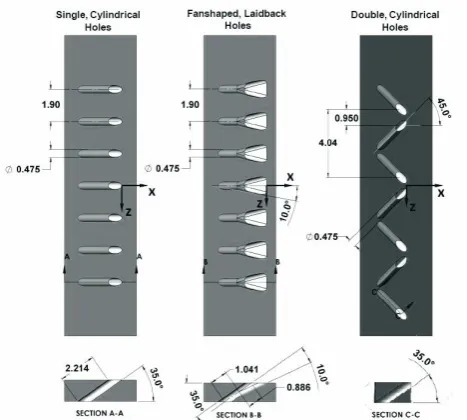
Figure 2.7: Single cylindrical hole arrangement, fan-shaped laidback hole, and double cylindrical holes. [8]
2.3.4 Flow parameter of cooling holes
2.3.4.1 Influence of blowing ratios
Figure 2.8: Graph of film cooling effectiveness, η versus streamwise location, x/Ms0
for varying blowing ratio [25]
Figure 2.9: Comparison of blowing ratios on film cooling effectiveness, η and streamwise location, x/d from the experimental result of Ligrani and Lee [26]
Meanwhile, Ligrani and Lee [26] has studied the effect of high blowing ratio on the single row of compound angle film cooling holes and Figure 2.9 shows one of the result obtained from the study. The figure indicates almost similar pattern to the results of from Baldauf et al. [25] result where the effectiveness decreases as the blowing ratio increases. However, the higher blowing ratio also shows reattachment of the jet to the surface thus increasing the effectiveness at further downstream.
[image:33.595.187.449.341.527.2]have a detrimental effect on the film-cooling performance. Study of Schulz et al. [24] have shown that when the blowing ratio is high, the magnitude of the produced vortices are also increases compared to the lower blowing ratios as shown in Figure 2.10. These large and high center of vortices located at x/D = 3 indicates that the entrainment phenomena where the mainstream flow tries to accommodate underneath the coolant jet. This entrainment phenomena triggered the lift off of the coolant jet thus leaving the surface.
Figure 2.10: The vorticity contour produced for M = 1 and M = 2 at plane y/D versus x/D. [24]
2.3.4.2 Influence of turbulence intensity
turbulence intensity increases. Some cases reported by Bons et al. [29] indicate that the high turbulence intensity will significantly decrease the performance of film cooling up to 70%. It is proved by Al-Hamadi et al. [30] which tested two values of turbulence intensity on the centerline film cooling effectiveness; 0.43% and 5.70%. Figure 2.11 shows the results of the turbulence intensity influence on centerline film cooling effectiveness using blowing ratios.
Figure 2.11: Influence of turbulence intensity on centerline of film cooling effectiveness, η at different streamwise location, x/D for M=0.5 and M=1.7 [27]
[image:35.595.120.540.561.690.2]According to the results, the higher the turbulence intensity indicates lower effectiveness regardless of a low or high blowing ratio. Another research from Schulz et al. [24] found that at turbulence intensity equals to 0.7%, larger coverage of film cooling effectiveness was observed in comparison to the turbulence intensity of 10%. Figure 2.12 shows the film cooling effectiveness at low and high turbulence.
CHAPTER 3
METHODOLOGY
3.1 Introduction
3.2 Flow chart
[image:37.595.152.489.232.715.2]Figure 3.3 shows the flow chart of the present study detailing all the processes and steps. In general, the flow of the present study can be divided into two parts; experimental study and numerical study. Both of these parts take place simultaneously. Details on the timeline of the present study is shown by the Gantt chart as in APPENDIX A.
In general, the present study is divided into three phases; preliminary study, experimental and simulation study and extraction, and analysis study. The first phase involves problem statement formulation, literature review and preliminary studies and initial activities of both experimental and simulation study. The problem statement have been identify by reviewing the previous studies. These information and data have been analyzed and summarized in order to complete the preliminary study. The first phase also covering the preparation for the both experimental and simulation studies. The preparation for the experimental study inclusive of individual test of open end wind tunnel, blower, fan, heater and the venturi meter. In simulation study, fifteen model have been built based on the preliminary studies. These model then applied with several boundary conditions, thus there are 105 cases have been considered in the present simulation study. After the computational domain development, the considered cases are tested with the mesh dependency test where the most accurate mesh will be chosen.
Meanwhile, all the experimental work and simulation analysis have been done in second phase. The flat plate for experimental work have been designed base on the preliminary studies in the first phase. In experimental work, there are only one model (2D45) that have been considered and tested with three different value of blowing ratios. Then the thermal data gathered from both study, the experimental and simulation will be analysed and evaluated.
Finally, in the third phase, the data from both experimental and numerical studies have been validated. Several discussions we made between these results along with the extensive explanation on the flow behavior on the numerical results. At the end of this phase, all the data and results will be documented and the Gantt chart associated with the present study can be found in Appendix A.
3.3 Simulation study
[image:39.595.124.537.226.355.2]The present study involved two main studies; simulation and experimental. The present numerical investigation were carried out through ANSYS CFX software which commonly used to solve the fluid flow problem. The simulation procedure of ANSYS CFX software involves five main sub-components as shown in Figure 3.2.
Figure 3.2: The flow of components in ANSYS CFX
3.3.1 Computational domain
extended to 10D and 30D in upstream and downstream direction respectively. On the other hand, the lower part of the computational domain also known as the plenum has a difference geometry for the SCH and DCH arrangements which is necessary to accommodate the extra space required in the DCH arrangement.
[image:40.595.127.408.402.667.2]Figure 3.3: Isometric view for SCH and DCH.
Figure 3.5: Upstream ramp dimension details; a) Rectangular ramp and b) Triangular ramp
In the case of upstream ramp with DCH, two different type of ramp have been considered in the present study; triangular and rectangular ramps. The ramp has been located upstream of the cooling holes at the distance of 2D from the origin. Both of the considered ramp types share the same height at 0.25D and 2D base length as shown in Figure 3.5.
REFERENCES
[1] Bill, G. and Patrick, S. (2006) The Development of Jet And Turbine Aero Engines. 4th edition. ISBN 0 7509 4477 3, p.124.
[2] static.progressivemediagroup.com/uploads/imagelibrary/nri/power/news/GE% 20Turbine.jpg [accessed on 27 May 2016]
[3] Çengel, Y. A. and Michael A. B. (2011) Thermodynamics: An Engineering Approach. 7th ed. New York: McGraw-Hill, 508-09.
[4] Bill, G. (2006) World Encyclopedia of Aero Engines. 5th edition. Sutton Publishing, p.160.
[5] Koff, B. L. (2003) Gas Turbine Technology Overview - A Designer's Perspective. AIAA/ICAS International Air and Space Symposium and Exposition: The Next 100 Years. AIAA 2003-2722.
[6] Yahya, S. M. (2010) Turbines Compressors and Fans. New Delhi: Tata McGraw-Hill Education, pp. 430–433.
[7] Han, J. C., Park, J. S., and Lie, C. K. (1984) Heat Transfer and pressure drop in blade cooling channels with turbulence promoters. NASA CR-3837. [8] Wright, L. M., McClain, S. T., Brown, C. P., and Harmon, W. V. (2013)
Assessment of a Double Hole Film Cooling Geometry Using S-PIV and PSP. ASME Turbo Expo 2013: Turbine Technical Conference and Exposition, pp. V03BT13A024-V03BT13A024.
[9] Saunter, M., Clouser, S., and Han, J. C. (1992) Determination of Surface Heat Transfer and Film Cooling Effectiveness in Unsteady Wake Flow Conditions. AGARD Conference Proceedings 527, pp. 6-1 to 6-12.
[11] Han, C., and Ren, J. (2012). Multi-parameter influence on combined-hole film cooling system. International Journal of Heat and Mass Transfer, 55(15), 4232-4240
[12] Kwak, J. S., and Han, J. C. (2002). Heat transfer coefficient and film-cooling effectiveness on a gas turbine blade tip. ASME Turbo Expo 2002: Power for Land, Sea, and Air, pp. 309-318.
[13] Haven, B. A., and Kurosaka, M. (1977) Improved Jet Coverage through Vortex Cancellation. AIAA Journal. Vol.34, No. 11.
[14] Eckert, E. R. G., Eriksen, V. L., Goldstein, R. J., and Ramsey, J. W. (1970) Film cooling following injection through inclined circular tubes.
[15] Goldstein, R. J., Eckert, E. R. G., and Burgrraff, F. (1974) Effects of Hole Geometry and Density on Three-Dimensional Film Cooling. International J. Heat and Mass Transfer. Vol. 17, pp. 595-607.
[16] Gritsch, M., Schulz A., and Wittig, S. (1998) Adiabatic Wall Effectiveness Measurements of Film-Cooling Holes with Expanded Exits. ASME J. Turbomachinery, Vol. 120, pp. 549-556.
[17] Islami, S. B., Tabrizi, S. A., Jubran, B. A., and Esmaeilzadeh, E. (2010). Influence of trenched shaped holes on turbine blade leading edge film cooling. Heat Transfer Engineering, 31(10), 889-906.
[18] Na, S., and Shih, T. I. (2007). Increasing adiabatic film-cooling effectiveness by using an upstream ramp. Journal of heat transfer, 129(4), 464-471.
[19] Halder, P., and Samad, A. (2012). Enhancement of Film Cooling Effectiveness Using Upstream Ramp. ASME 2012 Gas Turbine India Conference, pp. 551-557.
[20] Barigozzi, G., Franchini, G., and Perdichizzi, A. (2007, January). The Effect of an Upstream Ramp on Cylindrical and Fan-Shaped Hole Film Cooling: Part I—Aerodynamic Results. ASME Turbo Expo 2007: Power for Land, Sea, and Air, pp. 105-113.
[21] Chen, S. P., Chyu, M. K., and Shih, T. I. P. (2011). Effects of upstream ramp on the performance of film cooling. International Journal of Thermal Sciences, 50(6), 1085-1094.
[23] Heidmann, J. D. (2008, January). A numerical study of anti-vortex film cooling designs at high blowing ratio. ASME Turbo Expo 2008: Power for Land, Sea, and Air, pp. 789-799.
[24] Schulz, S., Maier, S., and Bons, J. P. (2012, June). An experimental Investigation of an Anti-Vortex Film Cooling Geometry Under Low and High Turbulence Conditions. ASME Turbo Expo 2012: Turbine Technical Conference and Exposition, pp. 1581-1593.
[25] Baldauf, S., Schulz, A., and Wittig, S. (2001). High-resolution measurements of local effectiveness from discrete hole film cooling. Journal of Turbomachinery, 123(4), 758-765.
[26] Ligrani, P. M., and Lee, J. S. (1996). Film cooling from a single row of compound angle holes at high blowing ratios. International Journal of Rotating Machinery, 2(4), 259-267.
[27] Kadotani, K., and Goldstein, R. J. (1979). On The Nature of Jets Entering A Turbulent Flow: Part A—Jet–Mainstream Interaction. Journal of Engineering for Gas Turbines and Power, 101(3), 459-465.
[28] Launder, B. E., and York, J. (1974). Discrete-hole cooling in the presence of free stream turbulence and strong favourable pressure gradient. International Journal of Heat and Mass Transfer, 17(11), 1403-1409.
[29] Bons, J. P., MacArthur, C. D., and Rivir, R. B. (1996). The effect of high free-stream turbulence on film cooling effectiveness. Journal of Turbomachinery, 118(4), 814-825.
[30] Al-Hamadi, A. K., Jubran, B. A., and Theodoridis, G. (1998). Turbulence intensity effects on film cooling and heat transfer from compound angle holes with particular application to gas turbine blades. Energy conversion and management, 39(14), 1449-1457.
[31] Amer, A. A., Jubran, B. A., and Hamdan, M. A. (1992). Comparison of different two-equation turbulence models for prediction of film cooling from two rows of holes. Numerical Heat Transfer, 21(2), 143-162.
![Figure 1.2: T-s diagram and P-v diagram [3].](https://thumb-us.123doks.com/thumbv2/123dok_us/8753443.892418/19.595.121.527.312.502/figure-t-s-diagram-and-p-v-diagram.webp)
![Figure 2.1: The chart of specific core power of gas turbine [9]](https://thumb-us.123doks.com/thumbv2/123dok_us/8753443.892418/26.595.177.460.75.273/figure-chart-specific-core-power-gas-turbine.webp)
![Figure 2.2: Formation of the CRVP by the single cylindrical cooling hole. [10]](https://thumb-us.123doks.com/thumbv2/123dok_us/8753443.892418/27.595.195.443.414.716/figure-formation-crvp-single-cylindrical-cooling-hole.webp)
![Figure 2.5: Example of trenched film cooling hole geometry. [17]](https://thumb-us.123doks.com/thumbv2/123dok_us/8753443.892418/29.595.158.488.77.201/figure-example-trenched-film-cooling-hole-geometry.webp)
![Figure 2.6: Test model schematic diagram. [21]](https://thumb-us.123doks.com/thumbv2/123dok_us/8753443.892418/31.595.159.479.69.302/figure-test-model-schematic-diagram.webp)