DHAFER ABDULAMEER ABDULMONIM
A dissertation submitted in
fulfilment of the requirements for the award of the Degree of Master of Computer Science (Software Engineering)
Faculty of Computer Science and Information Technology Universiti Tun Hussein Onn Malaysia
v
ABSTRACT
ABSTRAK
vii
CONTENTS
TITLE i
DECLARATION ii
DEDICATION iii ACKNOWLEDGEMENT iv ABSTRACT v ABSTRAK vi CONTENTS vii
LIST OF TABLES x
LIST OF FIGURES xii
LIST OF SYMBOLS AND ABBREVIATIONS xv
LIST OF APPENDICES xvi CHAPTER 1 INTRODUCTION 1 1.2 Research Background 1
1.3 Problem Statement 3
1.4 Research Objectives 4
1.5 Research Scope 4
1.6 Dissertation Outline 5
CHAPTER 2 LITERATURE REVIEW 6
2.1 Introduction 6
2.2 Web-based Geographical Information Systems Applications
6
2.2.1 Web-based Geographical Information Systems Applications Architecture
7
2.3 Usability Models 10 2.3.1 Shackel’s Model of Usability 11 2.3.2 Nielsen’s Model of Usability 12 2.3.3 ISO 9241-11 Model of Usability 13 2.3.4 ISO 9126 Model of Usability 14 2.3.5 Quality in Use Integrated Measurement (QUIM)
(2006)
15
2.4 Comparative Study of Usability Models 16
2.5 Usability Metrics 17
2.5.1 Effectiveness 17
2.5.2 Efficiency 17
2.5.3 Satisfaction 18
2.5.4 Learnability 18
2.6 Usability Evaluation Methods 18
2.7 Related Works 20
2.8 Research Gap 23
2.9 Summary 24
CHAPTER 3 METHODOLOGY 25
3.1 Introduction 25
3.2 Research Framework 25
3.3 Phase 1: Identifying Usability Metrics 27 3.4 Phase 2: Evaluating Usability Metrics Using
Questionnaire Method and Automated Usability Evaluation Method
28
3.4.1 Questionnaire Method 28
3.4.2 Automated Usability Evaluation Method 34 3.5 Phase 3: Comparative Analysis 36
3.6 Summary 37
CHAPTER 4 ANALYSIS AND RESULTS 38
ix
4.2 Evaluating Usability Metrics Using Questionnaire Method
38
4.2.1 Descriptive Statistics of Respondents 39 4.2.2 WGIS Applications: Three Case Studies 42 4.2.3 The Relationship of the Usability Metrics for
WGIS Applications
60
4.2.4 Discussion of Results based on Questionnaire method
66
4.3 Evaluating Usability Metrics Using Automated Usability Evaluation Method
70
4.3.1 The Results of Usability Metrics for Google Maps
71
4.3.2 The Results of Usability Metrics for Yahoo Maps
75
4.3.3 The Results of Usability Metrics for MapQuest 80
4.4 Comparative Analysis 84
4.6 Summary 90
CHAPTER 5 CONCLUSIONS 91
5.1 Introduction 91
5.2 Research Finding 91
5.3 Future Work 93
REFERENCES 94
APPENDICES 102
LIST OF TABLE
1.1 The case studies of WGIS applications. 5
2.1 Review the comparison among the related works based on of usability metrics.
22
3.1 Overview of Similarity between the Usability Models 27 3.2 Usability metrics with its aspects of Google Maps, Yahoo Maps
and MapQuest
29
3.3 Rank of Weighted Mean Interpretation. 32
3.4 Rule of Thumb for Interpreting the Size of a Correlation Coefficient
34
3.5 Usability testing task list for three case studies of WGIS 36
4.1 The 5-point Likert scale 42
xi
4.17 The experimental results of Case Studies of WGIS Applications based on questionnaire method.
66
4.18 The experimental results of the Effectiveness for Google Maps 72 4.19 The experimental results of the Efficiency for Google Maps 73 4.20 The experimental results of the Satisfaction for Google Maps 74 4.21 The experimental results of the Learnability for Google Maps 75 4.22 The experimental results of the Effectiveness for Yahoo Maps 76 4.23 The experimental results of the Efficiency for Yahoo Maps 77 4.24 The experimental results of the Satisfaction for Yahoo Maps 78 4.25 The experimental results of the Learnability for Yahoo Maps 79 4.26 The experimental results of the Effectiveness for MapQuest 80 4.27 The experimental results of the Efficiency for MapQuest 81 4.28 The experimental results of the Satisfaction for MapQuest 82 4.29 The experimental results of the Learnability for MapQuest 83 4.30 The comparative analysis of Effectiveness metric for three case
studies in terms of two methods
84
4.31 The comparative analysis of Efficiency metric for three case studies in terms of two methods
85
4.32 The comparative analysis of Satisfaction metric for three case studies in terms of two methods
86
4.33 The comparative analysis of Learnability metric for three case studies in terms two methods
87
4.34 Review the comparison the results of this study with the previous studies.
LIST OF FIGURES
2.1 WGIS Architecture 8
2.2 Components of GIS 9
2.3 Usability definition of Shackel model 12
2.4 Usability definition of Nielsen’s model 13
2.5 Usability definition of ISO 9241-11 Model. (ISO 9241 – 11, 1998)
14
2.6 ISO 9126-1 Quality Model. 15
2.7 QUIM Model. 16
3.1 Research Framework for a study. 26
3.2 The main page of Loop11 tool with the main steps 36
4.1 The age range of the respondents. 39
4.2 The gender range of the respondents. 40
4.3 The levels of academic qualification of the respondents. 40 4.4 The weighted mean contrast for Effectiveness aspects for
Google Maps
43
4.5 The weighted mean contrast for Efficiency aspects for Google Maps
45
4.6 The weighted mean contrast for Satisfaction aspects for Google Maps
46
4.7 The weighted mean contrast for Learnability aspects for Google Maps
48
4.8 The weighted mean contrast for Effectiveness aspects for Yahoo Maps
49
4.9 The weighted mean contrast for Efficiency aspects for Yahoo Maps
51
4.10 The weighted mean contrast for Satisfaction aspects for Yahoo Maps
xiii
4.11 The weighted mean contrast for Learnability aspects for Yahoo Maps
54
4.12 The weighted mean contrast for Effectiveness aspects for MapQuest
55
4.13 The weighted mean contrast for Efficiency aspects for MapQuest
57
4.14 The weighted mean contrast for Satisfaction aspects for MapQuest
58
4.15 The weighted mean contrast for Learnability aspects for MapQuest
60
4.16 Scatter plot diagram for maximum Correlation between Efficiency and Satisfaction for Google Maps
61
4.17 Scatter plot diagram for minimum Correlation between Efficiency and Learnability for Google Maps
62
4.18 Scatter plot diagram for maximum Correlation between Effectiveness and Efficiency for Yahoo Maps
63
4.19 Scatter plot diagram for minimum Correlation between Effectiveness and Satisfaction for Yahoo Maps
63
4.20 Scatter plot diagram for maximum Correlation between
Efficiency and Satisfaction for MapQuest
65
4.21 Scatter plot diagram for minimum Correlation between Effectiveness and Satisfaction for MapQuest
65
4.22 The Effectiveness metric for three Case Studies of WGIS applications
67
4.23 The Efficiency metric of for three Case Studies of WGIS applications
68
4.24 The Satisfaction metric for three Case Studies of WGIS applications
69
4.25 The Learnability metric for three case studies of WGIS applications
70
4.29 The experimental results of Learnability for Google Maps 75 4.30 The experimental results of Effectiveness for Yahoo Maps 76 4.31 The experimental results of Efficiency for Yahoo Maps 77 4.32 The experimental results of Satisfaction for Yahoo Maps 78 4.33 The experimental results of Learnability for Yahoo Maps 79 4.34 The experimental results of Effectiveness for MapQuest 80 4.35 The experimental results of Efficiency for MapQuest 81 4.36 The experimental results of Satisfaction for MapQuest 82 4.37 The experimental results of Learnability for MapQuest 83 4.38 The comparative analysis of Effectiveness metric for three
case studies in terms of two methods
84
4.39 The comparative analysis of Efficiency metric for three case studies in terms of two methods
85
4.40 The comparative analysis of Satisfaction metric for three case studies in terms of two methods
86
4.41 The comparative analysis of Learnability metric for three case studies in terms of two methods
xv
LIST OF SYMBOLS AND ABBREVIATIONS
GIS - Geographic Information System
WGIS - Web-based Geographic Information System UEMs - Usability Evaluation Methods
ISO - International Organization for Standardization QUIM - Quality in Use Integrated Measurement SPSS - Statistical Package for Social Science DBMS - Database Management System GPS - Global Positioning System GUI - Graphical User Interface
LCD - Liquid Crystal Display
HTML - Hyper Text Markup Language
UTHM - Universiti Tun Hussein Onn Malaysia
LIST OF APPENDICES
APPENDIX TITLE PAGE
CHAPTER 1
INTRODUCTION
1.1 Research Background
Today, usability is an important feature of the software development process as it can help improve the usability of systems under development. Usability evaluations can save money, time and effort if correctly introduced into the process and at the right time (Trivedi & Khanum, 2012). Usability is an important factor in ensuring the development of quality and usable software products. Ignorance and unawareness about the concept of usability and the failure to address usability during software development process has led to usability problems in software products. In addition, software quality has emerged as an important part of the software development process can prevent serious consequences, such as financial loss and reputation loss. Therefore, quality improvement after the development of software is not recommended because it only increases the cost and is almost remaking the product. Thus, poor software quality has been identified as the key factor in the success or failure of a software product (Jayaletchumi et al., 2014).
Dependency of many human activities on information and communication technologies in general and on geographic information is increasing rapidly. This is one of the reasons why usability of specialized software tools WGIS today belongs to the top priorities of managers and users of information technologies because, nowadays spatial data and tools for their utilization in great demand from end-users too. WGIS applications can provide an easy-to-use solution to end users, but they must be properly designed (Komarkova et al., 2009). WGIS applications are focused on end-users who have only a very limited knowledge of GIS, if any. For this reason, WGIS applications have to be user-friendly. In terms of software quality, WGIS applications have to be usable. Lately, various usability evaluation methods have been developed. Real users or their representatives are included in some of them. Other methods are based only on GIS experts’ evaluation of applications. The advantage of deploying real users or at least their representatives is clear they are able to identify some usability problems which could not be identified by experts. Usability evaluation in a real situation done by real users is critical. Experimental user usability testing done by the representatives of users is the axis of this study (Komarkova et al., 2010).
Usability evaluation is an important activity to ensure the quality of the user experience. Many usability evaluation methods can be used to assess transactional web applications, but problems come up when deciding which of the evaluation methods fetch more information. Usability evaluation methods (UEMs) are a set of techniques that are used to measure usability attributes (Otaiza et al., 2010). Usability evaluation methods can be categorized into two groups: user-based methods and expert-based methods. User-based evaluation methods require a user to test the software and it mainly consists of usability tests and questionnaires. These empirical evaluation methods are better suited later on in a development process or when the system is already in use and its goal is to determine the overall usability of the system (Blecken et al., 2010).
3
this study used a questionnaire method, because questionnaires are useful for studying how end users use the system and their preferred futures. User satisfaction, user preferences and possible uneasiness can be identified easily by using questionnaires, which can also be used to gather statistics. Due to this method, it was possible to involve a higher number of evaluators. Moreover, questionnaire is an inexpensive tool which is normally used to collect data from a large number of people 30 users being the lower limit for a study. It plays a very significant role in usability evaluation of the system. Questionnaire provides many advantages to the evaluation, the major benefit being that it gives a better understanding of the topic to the surveyor (Ali et al., 2013). Therefore, the comparative analysis was achieved between questionnaire method and automating usability evaluation method for three case studies of WGIS applications.
The usability of software systems has been recognized as an important quality factor. Many definitions and models of usability have been given so far, but they are brief and informal. Most of these models also fail to cover all of the aspects of usability and are not well integrated (Ankita & Sanjay, 2012). Therefore, the main focus of this study is to describe the concept of software usability and explain it with a detailed classification of five usability models including the Shackel Model (1991), Nielsen Model (1993), ISO 9241-11 (1998), ISO 9126 (2001) and the QUIM model (2006). There are many different attributes of each model, but there are also similarities between these models.
1.2 Problem Statement
The interface of WGIS applications is difficult to learn and understand because special functions are needed to manipulate the maps (Irfan et al., 2012). Hence, it is essential to evaluate the usability of WGIS applications. On the other hand, there are a number of standards and models in the literature, each of which describes usability in terms of various sets of attributes. Those models were overlapping and heterogeneous. Moreover, the lack of a cohesive model that defines usability in a uniform way leads to major problems in the evaluation of usability (Sanjay et al., 2012). As a result, those models are vague and difficult to understand.
(2001) and QUIM (2006), to identify usability metrics that have most frequently in the previous models. Questionnaire method and automating usability evaluation method by using the Loop11 tool were used in order to evaluate the usability metrics for three case studies of WGIS applications. Finally, the comparative study and analysis of three case studies based on usability metrics gives a better view of proper usability metrics in developing WGIS application.
1.3 Research Objectives
The main objectives of this study are:
(i) To identify usability metrics those have most frequently used by comparing among five usability models.
(ii) To evaluate usability metrics using the questionnaire method and automating usability evaluation method by using the Loop11 tool on three case studies for WGIS applications.
(iii) To compare and analyse the results obtained based on usability metrics using the questionnaire method and the automating usability evaluation method by using the Loop11 tool among three case studies for WGIS applications.
1.4 Research Scope
5
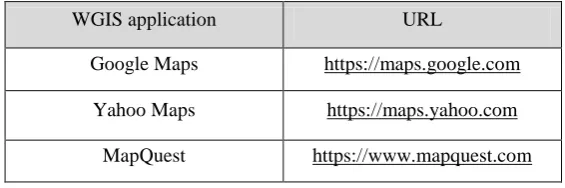
[image:18.595.177.460.160.254.2]compared. The three case studies that were selected are commonly used WGIS applications (Google Maps, Yahoo Maps and MapQuest) as shown in Table 1.1.
Table 1.1: The case studies of WGIS applications.
WGIS application URL
Google Maps https://maps.google.com
Yahoo Maps https://maps.yahoo.com
MapQuest https://www.mapquest.com
1.5 Dissertation Outline
CHAPTER 2
LITERATURE REVIEW
2.1 Introduction
This chapter provides an overview of software usability in WGIS application. It also aims to establish significance of general field of usability engineering. The greater part of this chapter is about critical evaluation of different methodologies used in this field so as to identify appropriate approach of usability metrics in WGIS application.
2.2 Web-based Geographical Information Systems Applications
Geographical Information Systems (GIS) are computer-based systems that use geographical data in conjunction with analysis and management tools to improve decision-making abilities of organizations. Recent rapid development and increased accessibility of the internet has led to a huge tendency towards Web technologies. The applications that are being used now are called WGIS applications. Thus, it has become an indispensable part for general users and organizations. It combines decision-making abilities of GIS systems with customization, accessibility, and interactive power of the internet (Akanbi & Agunbiade, 2013).
7
application that is accessible through a browser. It makes it possible for users to access GIS with its basic functionalities like searching locations, getting directions, zooming and panning and printing maps via web browsers. In other words, WGIS means that spatial data can be published, searched, analysed and displayed over the internet (Shen et al., 2008). WGIS applications are defined as web-based applications that have desktop GIS application's attributes, and a WGIS application uses a browser to support an application in order to make its information accessible. WGIS applications focus on end users who often may have a very limited experience of GIS (Adnan et al., 2010; Komarkova et al., 2011). The WGIS architecture and GIS components in general will be discussed in the next subsections.
2.2.1 Web-based Geographical Information Systems Applications Architecture
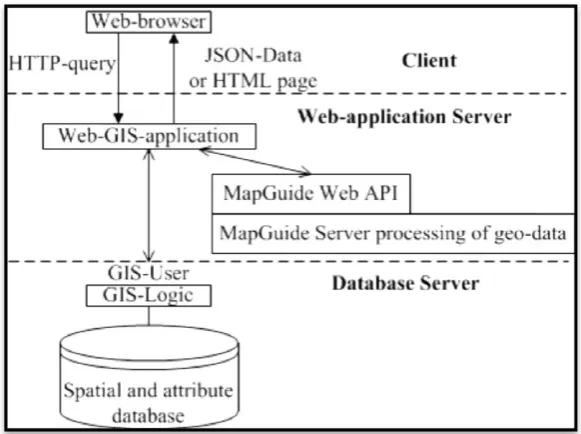
GIS is a powerful set of tools for collecting, storing, retrieving at will, transforming and displaying spatial data from the real world for a particular set of purposes. Most WGIS applications today adopt three-tier software architecture for system implementation: client, web application server, and database server as shown in Figure 2.1 (Jyoti & Vimal, 2012; Senchenko et al., 2013; Sonam & Rajan, 2014).
The first tier, called the client tier, includes the user-side web browser and user-resident Java applets/HTML documents. Users of the system can use popular web browsers: Internet Explorer, Opera, Google Chrome, and Mozilla Firefox. The Internet GIS user interacts with the client tier via a graphical user interface that is usually comprised of a map, map navigation, spatial attributes data query and spatial analysis tools. The primary function of the client tier is to edit and improve performance, user access the GIS functions, accept users’ data requests and to display the results (Jyoti & Vimal, 2012; Sonam & Rajan, 2014).
The second tier, called the middleware tier, includes the web server and the server connectors, such as servlet connectors or active server pages connectors, which bridge the communication between clients and the map servers. Server side uses web remote in application server and address matching, where the server is performing storage and processing of the data file from the central database to the user query (Jyoti & Vimal, 2012; Sonam & Rajan, 2014).
different functionalities like storing and accessing the server in order to return the data to the client server. The web browser is used for generating server requests and displays the data results (Jyoti & Vimal 2012; Sonam & Rajan, 2014).
Figure 2.1: WGIS Architecture. (Senchenko et al., 2013)
2.2.2 Geographical Information Systems Components
GIS is a set of computing systems having five components including hardware, software, people, data and method as shown in Figure 2.2 (Laxmana et al., 2013; Sara et al., 2012):
(i) Hardware: It is the computer system on which a GIS operates. Today, GIS software runs on a wide range of hardware platforms. The central processing unit is the main hardware component of GIS. It is connected to a disk drive storage unit that provides space for storing data and programs. Peripherals include monitor, LCD, mobile screen, scanner, mouse, keyboard, projector, printer, a GPS instrument to collect coordinates, and a digitizer as well (Sara et al., 2012; Shams et al., 2012).
9
tools for the input and manipulation of geographic information, tools that support geographic query, analysis, and visualization, a Graphical User Interface (GUI) for easy access to tools, and drawing software (Sara et al., 2012; Shams et al., 2012).
(iii) People: GIS technology is of limited value without the people who manage the system and develop plans for applying it to real world problems. GIS users range of technical specialists who design and maintain the system for those who use it to help them perform their everyday work. The identification of GIS specialists versus end users is often critical to the proper implementation of GIS technology (Sara et al., 2012; Shams et al., 2012).
(iv) Data: The data is the most important component of a GIS. A GIS can integrate spatial data with other existing data resources, often stored in a corporate DBMS. The integration of spatial data often proprietary to the GIS software, and tabular data stored in a DBMS is a key functionality afforded by GIS. Spatial data is data can be referenced to a location on earth e.g., country, road, river, etc. Attribute data is also called spatial data, and is data linked to the spatial data to describe those data, such as country name, road length, river width, etc. (Sara et al., 2012; Shams et al., 2012).
[image:22.595.198.439.538.692.2](v) Method: Methods are the sets of procedures and rules for performing data input, output, storage, and management, transforming the data into information and analysis. Analysis can be performed whenever GIS users need it (Sara et al., 2012; Shams et al., 2012).
2.3 Usability Models
Usability is one of the focuses of Human Factors Psychology and Human-Computer Interaction. As the name suggests, it has to do with bridging the gap between people and machines. It assesses the quality of user interaction with the system’s environment. It is considered to be one of the most important characteristics when targeting systems that will be used by widespread audiences, such as university students, without direct training and support (Tijani, 2014).
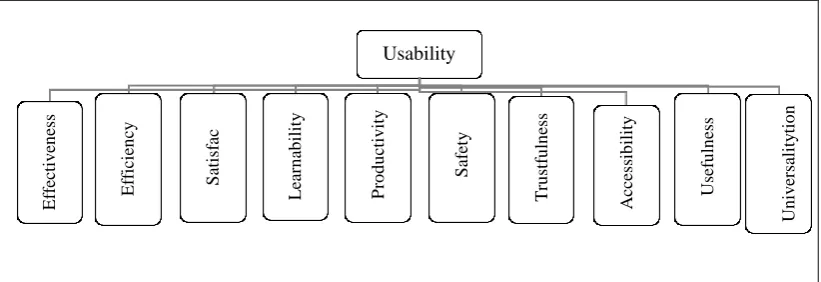
During the past few decades, several different standards and models for assessing usability have been proposed. This section reviews some of these models, highlighting the attributes on which usability has been considered to depend. McCall’s model (1976) described usability as operability, training and communicativeness (Suman & Manoj, 2014). Boehm’s model (1978) proposed that a software is usable if is portable and maintainable (Suman & Manoj, 2014). Eason model (1984) has 3 aspects: task, user and system. For task, it has 2 sub attributes: frequency and openness. User has 3 sub attributes: knowledge, motivation and discretion. The system has ease of learning, ease of use and task match. The Eason Model cannot measure usability without considering users and their target task (Madan & Dubey, 2012). Shackel (1991) explained that a system is usable if it is effective, learnable, flexible and subjectively pleasing (Madan & Dubey, 2012). Nielsen (1993) refers to learnability, efficiency, memorability, errors and satisfaction as usability attributes (Leventhal & Barnes, 2008). ISO 9241 part 11 (1998) defines the usability by three metrics: Effectiveness, Efficiency and Satisfaction (Hair et al., 2011). ISO 9126-1 (2001) defines a quality model that describes six categories of software quality; they are functionality, reliability, usability, efficiency, maintainability and portability. There are four metrics under usability, which are understandability, learnability, operability and attractiveness (Madan & Dubey, 2012). The QUIM model (2006) describes usability as comprising of 10 factors, namely, efficiency, effectiveness, productivity, satisfaction, learnability, safety, trustfulness, accessibility, universality and usefulness (Madan & Dubey, 2012).
11
restricted to discussing five usability models including Shackel’s model (1991), Nielsen model (1993), ISO 9241-11 (1998), ISO 9126 (2001) and QUIM (2006), which have been most widely recognized and used in practice (Aziz et al., 2013).
Although there is a consensus about the term “usability”, there are many different models of how usability should be measured, and it has been defined differently, because authors have different opinions on how to measure it. There are many definitions of usability: Shackel (1991), Nielsen (1993), ISO 9241-11 (1998), ISO 9126 (2001) and QUIM (2006). Although not all authors call the entities, which to them compose usability, usability attributes. Sometimes these entities are called dimensions, components, scales or factors of usability. It is the author’s opinion that they mean the same. As a result, the term "usability metric" is used, which is the most appropriate term (Folmer & Bosch, 2004). The following subsections will discuss these models of usability.
2.3.1 Shackel’s Model of Usability
Figure 2.3: Usability definition of Shackel model. (Shackel, 1991)
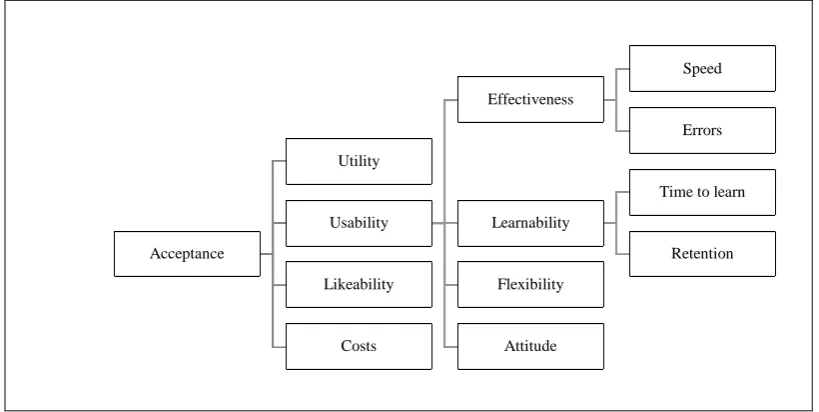
2.3.2 Nielsen’s Model of Usability
The Nielsen’s model was developed by Jakob Nielsen in 1993. He considered usability as one of many attributes of system’s acceptability that must be able to satisfy users’ needs. The model had divided acceptability into practical and social acceptability. As depicted in Figure 2.4, practical acceptability is the collection of reliability, cost, compatibility and usefulness, etc. Usability and utility together combine to achieve the usefulness of a system. He considered five metrics as depicted in Figure 2.4, without providing any descriptive definitions of usability, i.e. Learnability means easy to learn; Efficiency means efficient to use; Memorability means easy to remember; Errors means low error rate and Satisfaction means pleasant to use. It focuses on acceptability, which means that if the system is not useful, such as does not meet the user’s requirement, it will not accept it whether it is usable or not. Like the Shackel’s model, the Nielsen model also does not weight the dimension, recognizing that the importance of each of these may differ from project to project (Leventhal & Barnes, 2008; Madan & Dubey, 2012).
Acceptance
Utility
Usability
Effectiveness
Speed
Errors
Learnability
Time to learn
Retention Flexibility
Attitude Likeability
13
Figure 2.4: Usability definition of Nielsen’s model. (Nielsen, 1993)
2.3.3 ISO 9241-11 Model of Usability
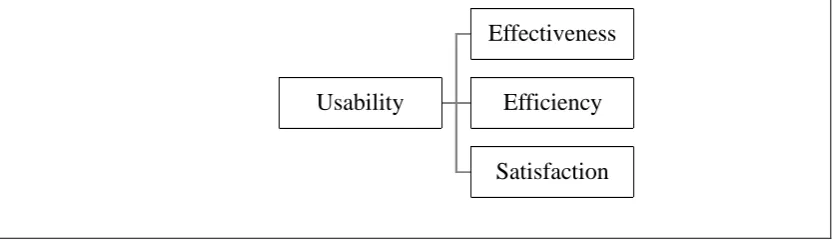
ISO is International Organization for Standardization 9241-part 11 in 1998 discusses usability for the purposes of product requirement specifications and product evaluation. It explains the benefits of measuring usability in terms of user performance and satisfaction. Usability is defined as “the extent to which a product can be used by specified users to achieve specified goals with effectiveness, and satisfaction in a specified context of use”. The three usability metrics presented according to ISO 9241 part 11 as depicted in Figure 2.5. Effectiveness, which is described the interaction from process viewpoint; efficiency, which focus on results and resources involved, and satisfaction, which is a user viewpoint (Hair et al., 2011).
This definition accommodates two different views from users’ perspective. One is the user performance that includes effectiveness and efficiency, and the other is the user view which is concerned with the issue of satisfaction (Madan & Dubey, 2012). This model adopted in Part 11 of ISO 9241 has advantages of objective measures of usability (Yen, 2010). The ISO 9241-11 model identifies usability aspects and context-of-use components to be taken into consideration during specification, design and usability evaluation. User performance and satisfaction provide direct measurements of usability in a particular context. User performance
Acceptability
Paractical
Usefulness
Usability
Learnability
Efficiency
Memorability
Errors
Satisfaction Utility
Costs
Compatibility
Reliability
and satisfaction measurements provide a basis for comparing usability with other design features for the same context. Usability can be defined and verified within quality systems conforming to ISO 9001. By contrast, this standard also has some disadvantages as it is too abstract and does not tackle the learnability metric, as recommended by majority of standards and experts (Hussain & Ferneley, 2008).
Figure 2.5: Usability definition of ISO 9241-11 Model. (ISO 9241 – 11, 1998)
2.3.4 ISO 9126 Model of Usability
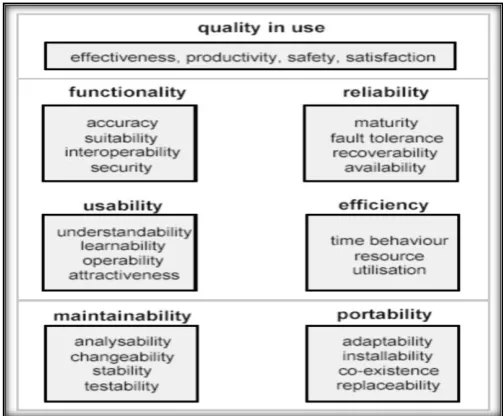
ISO 9126 is an international standard for the evaluation of software quality from product perspective in 2001. It defines a quality model that describes six categories of software quality as depicted in Figure 2.6, which are relevant during product development; they are functionality, reliability, usability, efficiency, maintainability and portability (Abran et al., 2003). There are four metrics under usability, i.e. understandability, learnability, operability and attractiveness. Understandability is the capability of software product to enable user to understand whether the software is suitable and how it can be used for particular tasks and conditions of use; Learnability is the capability of the software product to enable user to learn its application; Operability is the capability of the software product to enable the user to operate and control it; Attractiveness is the capability of the software product to be attractive to users, such as the use of colors or nature of graphical design (Madan & Dubey, 2012). The advantage of the ISO 9126 model is that it provides a framework for making trade-offs between software product capabilities and the attributes that are applicable to any kind of software including computer programs while providing consistent terminology for software product quality. The disadvantage of ISO 9126 is unclear architecture at detailed level of the measures, overlapping concepts, lacking
Usability
15
[image:28.595.199.451.123.331.2]of a quality requirement standard, lacking of guidance in assessing the results of measurement and ambiguous choice of measures (Yen, 2010).
Figure 2.6: ISO 9126-1 Quality Model. (Folmer & Bosch 2004)
2.3.5 Quality in Use Integrated Measurement (QUIM)
Figure 2.7: QUIM Model. (Seffah et al., 2006)
2.4 Comparative Study of Usability Models
This section discusses the differences and similarities between usability models that have been presented here. In the usability models of Shackel (1991), Nielsen (1993), ISO 9241 P-11 (1998), ISO 9126-1 (2001) and QUIM (2006), there are many metrics of symmetry between usability models. Authors in the usability domain have different perceptions about usability metrics. However, usability has different definitions that are largely overlap. Some authors have used different names for the same metric. For example, error for Nielsen’s model, effectiveness-error for the Shackel’s model and effectiveness for the ISO 9241 P-11 model are similar; the attributes for the Shackel’s model is similar to satisfaction for Nielsen’s model, ISO 9241 P-11 model and attractiveness of ISO 9126 model as well. Moreover, Effectiveness-task time for the Shackel’s model is similar to efficiency in the Nielsen’s model and the ISO 9241 P-11 model. In addition, QUIM (2006) has efficiency, effectiveness, satisfaction and learnability, and these metrics have frequency metrics used in previous usability models. Therefore, they are very difficult to be used and to communicate. The lack of a consistent model leads to major problems in the evaluation of usability (Folmer & Bosch 2004).
17
2.5 Usability Metrics
Based on the previous discussion, this study used four metrics: Effectiveness, Efficiency, Satisfaction and Learnability. The author perception, these usability measurements will make usability concepts more ideal, realistic and meaningful. This refinement is done in order to ensure systematic measurements for evaluating the usability of WGIS applications thoroughly. The following subsections discuss the four main usability metrics:
2.5.1 Effectiveness
According to ISO/IEC 9126-1 (2001), effectiveness is defined as the capability of the software product to enable users to achieve specified goals with accuracy and completeness in a specified context of use. It has an objective definition that indicates whether the system is able to support the users in an effective way, whether the user can carry out the tasks by the fewest steps. Effectiveness is more about the accuracy and completeness with which users can achieve certain goals. This means that users are focused to complete the main reason to use the product. Effectiveness can measure the user’s interactions with the system by error rates while attempting to complete the task or how many answers are correct (Sanjay et al., 2012). Effectiveness is the ability of a user to complete a task in a specified context. Typically effectiveness is measured by evaluating whether or not participants can complete a set of specified tasks (Rachel et al., 2013).
2.5.2 Efficiency
number of ways, such as the time to complete a given task, or the number of keystrokes required to complete a given task (Rachel et al., 2013).
2.5.3 Satisfaction
ISO 9126-I (2001) defines satisfaction as the capability of the software product to satisfy users in a specified context of use. Satisfaction also refers to users' subjective assessment of the system concerning how pleasant it is to use. Satisfaction is the perceived level of comfort and pleasantness afforded to the user through the use of the software. This is reflected in the attitudes of the user towards the software. This is usually measured subjectively and varies between individual users. Questionnaires and other qualitative techniques are typically used to measure a user’s attitudes towards a software application (Rachel et al., 2013).
2.5.4 Learnability
Based on Nielsen’s usability model (1993), learnability refers to how easy it is for casual users to learn a system. In websites with high learnability, users feel they are able to start using the site with a minimum of introductions and everything is easy to understand from the start. In websites with low learnability, users feel that the site may be using concepts or terminologies which are unfamiliar and need more explanations (Mentes & Turan, 2012). Learnability is the ease with which a user can gain proficiency with an application. It typically reflects how long it takes a person to be able to use the application effectively. In order to measure Learnability, researchers may look at the performance of participants during a series of tasks, and measure how long it takes these participants to reach a pre-specified level of proficiency (Rachel et al., 2013).
2.6 Usability Evaluation Methods
19
important role in the design of most WGIS applications because usability aspects included in product design give credibility to the company and customers are more satisfied with their products, and therefore several methods have been proposed by scholars for evaluation. However, UEMs are not standardized by classification on the basis of different usability expert’s opinions (Woolrych et al., 2011).
According to (Nielsen, 1993), usability testing with real participants is a fundamental evaluation method; it provides an evaluator with direct information about how users use products and what some of the problems are with the interface being tested. During usability testing, participants use the system or a prototype to complete a pre-determined set of tasks while the tester or software records the results of the participants' work. The tester then uses these results to determine how well the interface supports users' task completion and to derive other measures such as the number of errors and task completion time.
The questionnaires method can be used to collect both quantitative and qualitative data, which can consist of different types of questions, multiple choice questions and a rate scale as well as closed or open-ended questions. It is used to collect both quantitative and qualitative data and allows one to involve a higher number of evaluators to obtain their opinions, desires and expectations; it is an efficient and inexpensive method and does not require much time or effort from the participants (Blecken et al., 2010; Preece et al., 2011; Ali et al., 2013).
usability testing with actual users. It is simple to use with no code required, provides real data from real users, and can be used on any web site (Loop11, 2015). Therefore, in this study the questionnaire method and automated usability evaluation by using the Loop11 tool were used.
2.7 Related Works
Many researches have employed usability evaluation methods to evaluate web-based applications. Therefore, this section will review some of the research related to the evaluation of Web-based applications and WGIS applications by using usability evaluation methods. However, the main focus is on usability metrics.
Wang (2014) produced usability evaluation methods, such as usability testing and questionnaires, aimed at exploring the usability problems of four public web mapping sites Google Maps, Bing Maps, MapQuest and Yahoo Maps. In addition, analysing the problems quantitatively and qualitatively by using usability metrics effectiveness, efficiency and satisfaction. 42 people, having different WGIS skills, genders, ages and nationalities, participated in this test to complete the several test tasks in different teams. The test comprised three parts: a pretest background information questionnaire, several test tasks for quantitative statistics and progression analysis, and a post-test questionnaire. The pretest and post-test questionnaires focused on gaining verbal explanations of their actions qualitatively. The success rate from different public web mapping sites was calculated and compared. The answers from questionnaires were also classified and organized. Based on the analysis, discussions were produced about the problems and advice was proposed about aspects of user interface, functionality, search operations and visualization in order to enhance the performance of the websites.
21
GIS or experience with computers and about personal opinions about the design. Test candidates were teenagers between 16 and 17 years old from a German secondary school. The test time was conducted 100 minutes to test the prototype with 9 testers, 4 of which were female and the 5 of which were male. During the test session problems and major issues with the tested prototype became apparent. The experimental results showed the efficiency of WGIS applications by comparing the total number of clicks needed by the users to complete each task and the needed time in seconds and show the correlation of these two parameters captured in the usability test.
Soohyung et al. (2011) proposed a usability evaluation model and a practical survey tool tailored to academic library websites. The authors verified the reliability and validity of the usability evaluation model empirically using the survey data from actual users by statistical analysis, such as descriptive statistics, internal consistency test, and a factor analysis, were applied to ensure both the reliability and validity of the usability evaluation tool. This study identified eighteen measurement items to survey the three constructs of the usability, effectiveness, efficiency, and learnability in academic library websites. The empirical examination based on 147 actual user responses proved that the survey evaluation tool suggested herein is acceptable in assessing academic library website usability.
Komarkova et al. (2010) proposed the think-aloud method as a suitable experimental method based on usability testing to identify the most serious usability problems of 14 equal WGIS applications, where all applications were run by the Czech Regional Authorities and are targeted at citizens and other end users. The proposed method is qualitative, so its main aim was to identify the most serious usability problems of the evaluated applications by preparation and verification of the task list which included 20 tasks. For each item on the task list, the percentage share of tasks completion as effectiveness. While the average time needed to finish a task as efficiency. The results showed that the proposed method of testing identified all usability problems that were found for each evaluated WGIS application and were classified into three main types: fatal, serious and slight problems.
architectural and visual clarity, and functionality for WGIS applications evaluation. Usability tests were performed with six graduate users and questionnaires were filled out by these users. Interviews were conducted with six users to validate the results. The authors provided a number of suggestions based on the problems that were identified in this study for Google Maps and MapQuest to improve the usability of these applications.
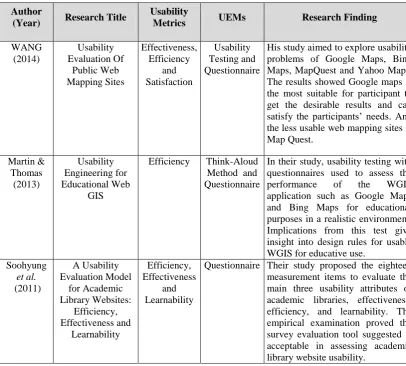
[image:35.595.111.518.339.705.2]The overall summary is described in a tabular form for a quick review and comparison of the usability evaluation methods among the previous related works. Table 2.1 shows a comparison summary of the related works for evaluating WGIS applications.
Table 2.1: Review the comparison among the related works based on of usability metrics.
Author
(Year) Research Title
Usability
Metrics UEMs Research Finding
WANG (2014) Usability Evaluation Of Public Web Mapping Sites Effectiveness, Efficiency and Satisfaction Usability Testing and Questionnaire
His study aimed to explore usability problems of Google Maps, Bing Maps, MapQuest and Yahoo Maps. The results showed Google maps is the most suitable for participant to get the desirable results and can satisfy the participants’ needs. And the less usable web mapping sites is Map Quest. Martin & Thomas (2013) Usability Engineering for Educational Web GIS
Efficiency Think-Aloud
Method and Questionnaire
In their study, usability testing with questionnaires used to assess the
performance of the WGIS
application such as Google Maps and Bing Maps for educational purposes in a realistic environment. Implications from this test give insight into design rules for usable WGIS for educative use.
Soohyung et al. (2011) A Usability Evaluation Model for Academic Library Websites: Efficiency, Effectiveness and Learnability Efficiency, Effectiveness and Learnability
[image:35.595.112.525.344.706.2]23
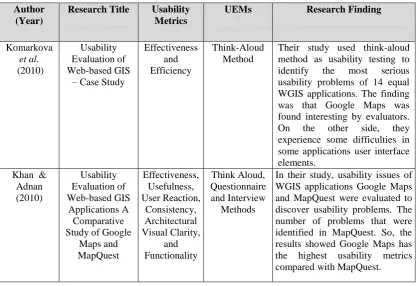
Table 2.1 (Continued).
Author (Year)
Research Title Usability Metrics
UEMs Research Finding
Komarkova et al. (2010) Usability Evaluation of Web-based GIS
– Case Study
Effectiveness and Efficiency
Think-Aloud Method
Their study used think-aloud method as usability testing to
identify the most serious
usability problems of 14 equal WGIS applications. The finding was that Google Maps was found interesting by evaluators.
On the other side, they
experience some difficulties in some applications user interface elements.
Khan & Adnan (2010) Usability Evaluation of Web-based GIS Applications A Comparative Study of Google
Maps and MapQuest Effectiveness, Usefulness, User Reaction, Consistency, Architectural Visual Clarity, and Functionality Think Aloud, Questionnaire and Interview Methods
In their study, usability issues of WGIS applications Google Maps and MapQuest were evaluated to discover usability problems. The number of problems that were identified in MapQuest. So, the results showed Google Maps has the highest usability metrics compared with MapQuest.
2.8 Research Gap
[image:36.595.111.529.99.385.2]2.9 Summary
94
REFERENCES
Abran, A., Khelifi, A., Suryn, W., and Seffah, A. (2003). Usability meanings and interpretations in ISO standards. Software Quality Journal, 11(4), 325-338. Adnan, M., Singleton, A., and Longley, P. (2010). Developing efficient web-based
GIS applications. working papers series, paper153. 1-15. ISSN: 1467-1298. Akanbi, A. & Agunbiade, O. (2013). Integration of a city GIS data with Google maps
API and Google Earth API for a web based 3D Geospatial Application. International Journal of Science and Research (IJSR), 2(11), 200-203. ISSN: 2319-7064.
Akhil, G., Sharma, M., Snehmani and Mirtunjay, S. (2014). Development of Web GIS Based Digital Avalanche Atlas. International Journal of Science, Engineering and Technology Research (IJSETR), 3(4), 684-687.
Ali, H., Michelle, O., Okam, Roobaea, A. and Pam, J. (2013). Improving Usability of Social Networking Systems: A Case Study of LinkedIn. Journal of Internet Social Networking & Virtual Communities, 2013 (2013), 1-23. doi:10.5171/2013.889433.
Ankita, M. & Sanjay, K. (2012).Usability Evaluation Methods: A Literature Review. International Journal of Engineering Science and Technology (IJEST), 4(2), 590-599, ISSN: 0975-5462.
Aziz, N., Kamaludin, A. and Sulaiman, N. (2013). ASSESSING WEB SITE USABILITY MEASUREMENT. International Journal of Research in Engineering and Technology (IJRET), 2(9), 386-392.
Basit, A. & Suresha (2013). Measuring the Efficiency of E-government Websites. International Journal of Computer Applications (0975 – 8887), 70(22), 43-49.
Bernérus, A. & Zhang, J. (2010). A Peek at the Position of Pedagogical Aspects in Usability Evaluation of E-learning System. A Literature Review of Usability
Evaluation of E-learning System conducted since 2000. Sweden:University of Gothenburg. ISSN: 1651-4769.
Blecken, A., Bruggemann, D. and Marx, W. (2010). Usability Evaluation of a Learning Management System. Proceedings of the 43rd Hawaii International Conference on Usability evaluation of a learning management
system in System Sciences (HICSS), January 5-8, 2010. Honolulu, HI: IEEE. 1-9.
Chang, E., & Dillon, T. S. (2006). A usability-evaluation metric based on a soft-computing approach. Systems, Man and Cybernetics, Part A: Systems and Humans, IEEE Transactions on, 36(2), 356-372.
Changqing, W., Xugang, W., Cuixia, M.,Changzhi, D. and Guozhong, D. (2005). Probabilistic regular grammars for the evaluation of Human-Computer interface usability. Journal of Computer Aided Design & Computer Graphics, 17(12),2709-2715.
Folmer, E. & Bosch, J. (2004). Architecting for usability: a survey. Journal of systems and software, 70(1), 61-78.
96
Hair, J. F., Sarstedt, M., Ringle, C. M. and Mena, J. A. (2012). An assessment of the use of partial least squares structural equation modeling in marketing research. Journal of the Academy of Marketing Science, 40(3), 414-433. Hinkle, D., Wiersma, W., Jurs, S. (2003). Applied Statistics for the Behavioral
Sciences, 5th ed, Boston: Houghton Mifflin. ISBN: 0618124055.
Hussain, A. & Ferneley, E. (2008). Usability Metric for Mobile Application: A Goal question metric (GQM) Approach. Proceedings of the iiWAS08 10th International Conference on Information Integration and Web-based Applications & Services, November 24-26, 2008. Linz, Austria: iiWAS08. 567-570. ISBN: 978-1-60558-349-5.
International Standards Organization (1998). Ergonomic requirements for office work with visual display terminals (VDTs), Part 11: Guidance on usability. Geneva: ISO 9241-11.
International Standards Organization (2001). ISO/IEC Information Technology-Software Product Evaluation, Technology-Software Engineering, Product Quality, Part
1: Quality Model. Geneva: ISO 9126-1.
Irfan, R., Jingnong, W., Yunhong, W., Maissom, Q., Abbasi and Philip, L. (2012). Software Learnability Evaluation an Overview of Definitions and Evaluation Methodologies for GIS Applications. Proceedings ofthe Seventh International Multi-Conference on Computing in the Global Information
Technology(ICCGI), June 24, 2012- June 29, 2012. Venice, Italy: IARIA. 212-217.
Jayaletchumi, T., Sambantha, M., Suhaimi, B. and Mohd, N. (2014). Developing Usable Software Product Using Usability Risk Assessment Model. International Journal of Digital Information and Wireless Communications
(IJDIWC), 4(1), 95-102.
Jeng, J. (2005). Usability assessment of academic digital libraries: Effectiveness, efficiency, satisfaction, and learnability. Libri, 55(2-3), 96-121.
Jose, N. (2006). Missions Strategies of Korean Presbyterian Missionaries in Central and Southern Philippines: In Light of Paul's Missions Strategies. California, USA: The Hermit Kingdom Press. ISBN:1596890606.
Jyoti, S. & Vimal, S. (2012). Web-Based solution for Mapping Application using Open-Source Software Server. International Journal of Informatics and Communication Technology (IJ-ICT), 1(2), 91-99. ISSN: 2252-8776.
Khan, Z. & Adnan, M. (2010). Usability evaluation of web-based GIS applications: A comparative study of Google maps and MapQuest. Sweden, Blekinge Institute of Technology Ronneby: Master Thesis.
Komarkova, J., Jakoubek, K. and Hub, M. (2009). Usability Evaluation of Web-based GIS – Case Study. Proceedings of the 11th International Conference on Information Integration and Web-based Applications & Services,
December 14–16, 2009. Kuala Lumpur, Malaysia: ACM. 547-551.
Komarkova, J., Jedlicka, M. and Hub, M. (2010). Usability User Testing Of Selected Web-Based Gis Applications. Technology, 9(1), 21-30.
Komarkova, J., Sedlak, P., Novak, M., Musilova, A., and Slavikova, V. (2011). Methods of usability evaluation of Web-based geographic information systems. International Journal of Systems Applications, Engineering & Development, 5(1), 33-41.
Laxmana, R., Apoorva, B., Snigdha, S. and Spandana, K. (2013). GIS Applications in Land Use and Land Development of a City. International Journal of Emerging Technology and Advanced Engineering, 3(5), 303-308.
Leventhal, L. & Barnes, J. (2008). Usability Engineering Process, Products, and Examples, 1st ed. The University of California: Pearson/Prentice Hall. ISBN: 0131570080.
98
Madan, A., & Dubey, S. K. (2012). Usability evaluation methods: a literature review. International Journal of Engineering Science and Technology, 4(2), 590-599.
Martin, D. & Thomas, B. (2013). Usability Engineering for Educational Web GIS. Proceedings of the 16th Conference on Geographic Information Science,
May 14, 2013 –May 17, 2013. Leuven, Belgium: AGILE. 1-6.
Meng, Y. & Malczewski, J. (2009). Usability evaluation for a web-based public participatory GIS: A case study in Canmore, Alberta. Cybergeo: European Journal of Geography [Online], Retrieved on May 12, 2015, from http://cybergeo.revues.org/22849; doi: 10.4000/cybergeo.22849.
Mentes, S. A. & Turan, A. H. (2012). Assessing the Usability of University
Websites: An Empirical Study on Namik Kemal University. Turkish Online
Journal of Educational Technology-TOJET, 11(3), 61-69.
Nielsen, J. (1993). Usability engineering. Cambridge, MA: Ap Professional.
Nielsen, J. (2012). Usability 101: Introduction to Usability. Retrieved on July 5th 2015, from http://www.nngroup.com/articles/usability-101-introduction-to-usability.
Oscar, S. & Teresita, A. (2014). Proceedings of the 9th International Conference on e-Learning: ICEL 2014. Academic Conferences Limited, UK, ISBN: 1909507695.
Otaiza, R., Rusu, C. and Roncagliolo, S. (2010). Evaluating the Usability of Transactional Websites. Proceedings of the 3rd International Conference on Advances in Computer-Human Interactions, Feb 10-15, 2010. Saint Maarten, Antilles: IEEE. 32-37.
Rachel, H., Derek, F. and David, D. (2013). Usability of mobile applications: literature review and rationale for a new usability model. Journal of Interaction Science, 1(1), 1-16.
Rama, A. & Dhanraj, S. V. (2014). Web Usability Testing Technique Using Clear Methodology. Middle-East Journal of Scientific Research, 20(4), 475-478. Roland, P., Katharina, S., Robyn, C. and Markus, J. (2013). Easy methods for
extracting individual regression slopes: Comparing SPSS, R, and Excel. Tutorials in Quantitative Methods for Psychology, 9(2), 72-78.
Rukshan, A. & Baravalle, A. (2010). A quantitative approach to usability evaluation of web sites. Advances in Computing and Technology. University of East London, London, January 2011. London: University of East London, School of Architecture Computing and Engineering.
Sanjay, K., Anubha, G. and Ajay, R. (2012). Integrated Model for Software Usability. International Journal on Computer Science and Engineering (IJCSE), 4(3), 429-437.
Sara, S., Ahmed, A. and Aziza, A. (2012). Survey on Using GIS in Evacuation Planning Process. International Journal of Computer Science and Information Security (IJCSIS), 10(8),1-4.
Seffah, A., Donyaee, M., Kline, R. and Padda, H. (2006). Usability Measurement And Metrics: A Consolidated Model. Software Quality Journal, 14(2), 159– 178.
Senchenko, P. V., Gritsenko, Y. B., Zhukovskiy, O. I. and Ekhlakov, Y. P. (2013).
Mashup-Technology in Web-Based GIS Design. Journal of Software
Engineering and Applications, 6(07), 13-16.
Shackel, B. (1991). Usability-context, framework, definition, design and evaluation. Human factors for informatics usability. New York, USA: Cambridge University Press. 21-37.
100
International Conference on Advanced Computing & Communication
Technologies, Jan 7-8, 2012. Rohtak, Haryana: IEEE.51 – 56.
Shen, S., Cheng, X. and Gong, P. (2008). Sensor Web Oriented Web-Based GIS. Proceedings of the 8th Springer International Symposium on Web and
Wireless Geographical Information Systems, December 11-12, 2008. Berlin Heidelberg:Springer. 86-95. doi 10.1007/978-3-540-89903-7_9.
Shneiderman, B. & Plaisant, C. (2004). Designing the User Interface: Strategies for Effective Human-Computer Interaction 4th ed. USA: Pearson Addison Wesley. ISBN: 0321197860.
Sonam, A. & Rajan, D. (2014) Development and Comparison of Open Source based Web GIS Frameworks on WAMP and Apache Tomcat Web Servers. ISPRS-International Archives of the Photogrammetry, Remote Sensing and Spatial
Information Sciences, 1, 1-5.
Soohyung, J., Suyu, L. and Kun, L. (2011). A usability evaluation model for academic library websites: efficiency, effectiveness and learnability. Journal of Library and Information Studies, 9(2), 11-26.
SPSS (2015). SPSS 22.0, Retrieved on March 01, 2015, from http://www-01.ibm.com/software/analytics/spss/
Suman & Manoj, W. (2014). A Comparative Study of Software Quality Models. International Journal of Computer Science and Information Technologies
(IJCSIT), 5(4),5634-5638.
Tijani, O. K. (2014). Usability evaluation of educational tablet, a case study of Osun technology enhanced learning system, Nigeria. University of Ilorin: Ph.D. Thesis.
Trevor, W. (2010). Applied Business Statistics methods and Excel- Based Applications, 2nd ed, Cape Town, South Africa: Juta and Company Ltd, 2010. ISBN: 0702172863.
Wang, C. (2014). Usability Evaluation of Public Web Mapping Sites. The International Archives of the Photogrammetry, Remote Sensing and Spatial
Information Sciences (ISPRS), 1, 285-289.
Woolrych, A., Hornbæk, K., Frokjær, E. and Cockton, G. (2011). Ingredients and Meals rather than Recipes: A Proposal for Research that does not treat Usability Evaluation Methods as Indivisible Wholes. International Journal of Human-Computer Interaction, 27(10),940-970.