Journal of Chemical and Pharmaceutical Research, 2014, 6(7):2572-2579
Research Article
CODEN(USA) : JCPRC5
ISSN : 0975-7384
The damaging mechanism and performance design of the off-wall
tunnel under the dynamic and static combined cycling loading model
Jichang Zhao, Yuanxue Liu, Yu Zhang and Peili Zhang
School of Logistic Engineering University of PLA, Chongqing, China
____________________________________________________________________________________________
ABSTRACT
The underground off-wall tunnels find wide application in the civil underground projects and the national defense projects due to its merits of small backfilling workload, quick construction progress, good drainage and being damp-proof and easy to be repaired and maintained. Based on the dynamic and static combined cycling loading method and the design strategy of the structure performance, this paper adopts the combination method of similarity physical model experiment and the numerical analog calculation to conduct dynamic damaging mechanism and performance standard design research of underground off-wall tunnel. The research results show that the dynamic and static combined cycling loading method can better reflect the generation and expansion progress of the inner microcracks of rocks and concrete materials, thus it is an effective method to research into the damaging rules and stability of the underground off-wall tunnel; the plasticity displacement, strain and pressure stress changes of the monitoring point can better describe the damaging status of the underground projects; the increase of load magnitude can obviously result in the displacement of the monitoring point (vault), which may cause the first transcending damage of the tunnel, and the cycling loading will show accumulated damage with the load magnitude positively related to the degree of accumulated damage; the strain of the monitoring point will undergo sudden changes when reaching the ultimate pressure value, while the crack width parallel to the tunnel diameter is the reference to the damaging status of the underground tunnel; the experimental and numerical simulated results coincide with each other, and can well represent the performance standard of the underground tunnel, thus providing the reference for the earthquake and explosion effect, as well as the protection a design of the underground tunnel.
Keywords: underground off-wall tunnel; dynamic and static combined; cycling loading; damaging mechanism;
performance design
____________________________________________________________________________________________
INTRODUCTION
The underground tunnel often adopts off-wall superposition as its basic form. It is an arch superposition form, which conducts compact backfilling of the overbreak part between the superposition and the surrounding rocks, and makes the two cling to each other closely and influence each other to jointly undertake the gravity stress and external load. Due to the merits of small backfilling workload, quick construction progress, good drainage and being damp-proof and easy to be repaired and maintained, the model is widely used in the civil underground projects and the national defense projects. However, the stress strain’s representation is complex. Coupled with the load it subject to during the life cycle, such as the earthquake effect, explosion and rise and fall of the underground water, it is also unpredictable.
reliability of the tunnel’s surrounding rocks through probability statistical method; the other is to describe the internal factors causing the generation of the structure in the theoretical perspective, such as the structure model in this paper and recreate the damaging rules of the whole structure through the research of dynamic properties and stress train system of rock concrete materials under different historical conditions and combining the numerical simulation software[5-7].
In fact, the damage of the underground project structure is caused by the internal and external reasons. The dynamic properties of the rock concrete materials under different historical conditions are the base to research into the project structure damage; while the defects influencing the strength of the rock concrete materials, including the cleavage and microcrack in the whole underground project and within the surrounding rocks, are also factors worth consideration. In order to to reflect the performance standard of its damaging status, this paper bases on the dynamic and static combined cycling loading method and the structure performance design idea, and combines the similarity physical model experiment and the numerical calculation to analyze the corresponding relationship between the structure and the deforming status, damaging rules and stability conditions and performance level of the off-wall tunnel.
EXPERIMENTAL SECTION
2.1. Devices for the model experiment
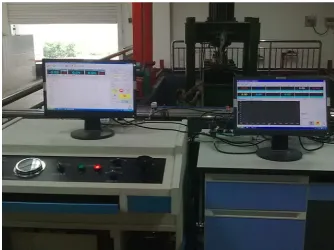
[image:2.595.125.292.353.478.2]The experiment instrument model is made up of the cuneiform side slope experiment part and the rectangular (2.0 m*0.7 m*3.0 m) tunnel experiment part. This experiment conducts loading, unloading and load holding of the model box through the microprocessor control electro-hydraulic servo tester’s measurement and control system to automatic control the oil jack. At the same time, it can achieve real-time data collection, and save and update the data in the text format, which is usually of the TXT or EXCEL format.
[image:2.595.337.527.354.491.2]Fig. 1 the microprocessor control electro-hydraulic servo tester’s measurement and control system
Fig. 2 The side slope tunnel coupling experiment system
2.2. Similarity relation design
While making the similarity relation model for experiment, it should be in line with three theorems of similarity simulation, and the monodrome condition. Considering the properties of underground off-wall tunnel rock media, the model experiment should meet various indexes described in the following functions:
( , , , , , , ,
x,
z,
x,
z,
x,
y)
0
f
γ ϕ
c
E
τ
L
µ
u u
σ σ ε ε
=
(1)in which gravity
γ
, frictional angelϕ
and Poisson’s ratioµ
are all property parameters of the materials. Since all of them belong to zero dimensions, therefore,1
C
γ=
C
ϕ=
C
µ=
(2)At the same time, in order to ensure the similarity of various strength indexes of the materials and the underground off-wall tunnel’s surrounding rocks, it should meet the following criteria and requirements:
/
1
u L
C
ε=
C
C
=
(3)c L E E
C
σ=
C
τ=
C
=
C C
γ=
C C
ε=
C
(4)resemble the prototype. Only one or several indexes can be selected to target at solving the major problems so as to achieve the experiment goals. After analysis, the geometric conditions, critical conditions and the initial conditions of the similarity physical model are easy to obtain. Therefore, all these conditions are regarded as the basic control
quantity, and set the similarity constant
C
σat 20. At the same time, the physical conditions are defined according to the parameter values in the process of mapping. It is hard to be obtained, whose similarity relation expression and similarity ratio can be indirectly gained only through the above stated similarity ratio function.2.3. Design and making of the similarity model design
The experiment adopts steel experiment model box, whose two sides and bottom boards are both made up of 5cm steel boards, and are connected through angle iron and box iron. The underground off-wall superposition tunnel is mainly composed of painted layer of concrete, (outer lining), lining (inner arch) and the anchor-late retaining surrounding rocks’ reinforced area. The specific measurements of the whole model are shown in Fig. 3:
× ×
× × ×
× ×
×
[image:3.595.90.523.608.705.2]× ×
Fig. 3 Measurement chart of the off-wall tunnel’s similarity model (Unit: mm; similarity ratio: 1:20)
The two sides of the model are distributed with 70cm circular organic glass windows (2mm thickness), which are convenient for the researcher to observe the damaging and injury phenomena of the tunnel under the influence of the load. At the same time, the four internal side walls of the model box are all painted with Vaseline so as to fundamentally eradicate the frictional limit of the side wall. Besides, in the loading process, the loading system’s bottom boards keep in full contact with the model’s top to prevent the generation of bias voltage, which can influence the experiment result. The practical working conditions are: the gross tunnel is 13.9m wide, and 8.4m high (the clear height is 7m); the outer layer of the surrounding rocks are reinforced through the anchoring-plate retaining; after the reinforcement, the strength parameters of the surrounding rocks have been improved by 5%. According to the similarity theory and the strength parameters of various materials, the strength parameters of the materials required to be made are shown in Table 1:
Table1 Physico-mechanical parameters of model
Composition Type Density ( Kg/m3) Modulus ( GPa) Poisson ratio Cohesion ( MPa) Friction(°)
Surrounding rock
prototype 2300 6 0.3 0.7 39.00 Model 2300 0.3 0.3 0.035 39.00 Similarity ratio 1:1 20:1 1:1 20:1 1:1
Reinforced area
prototype 2300 6.300 0.3 0.7350 40.37 Model 2300 0.315 0.3 0.03675 40.37 Similarity ratio 1:1 20:1 1:1 20:1 1:1
Lining
prototype 2400 23 0.167 1.5 52.00 Model 2400 1.15 0.167 0.075 52.00 Similarity ratio 1:1 20:1 1:1 20:1 1:1
out that the matching ratio of 6.5:4:0.5:1:1 can reach the requirement of various parameters of the three types of surrounding rocks.
2.4. Experiment plan design
There are two observation windows in the whole model box, which cling to the cross section of the underground tunnel model respectively. In this way, it is easy to install the sensor and observe the damaging status. Before the experiment, three corresponding 3D numerical models are established for trial calculation. The sensor’s position is rationally arranged according to the simulation result, which is shown in Fig. 4:
Fig. 4 The arrangement of the monitoring point of the similarity simulation box of the underground tunnel
2.5. The graded pressure loading of the model experiment
Different load influences have different response models and damaging rules for the underground projects. Therefore, the model experiment loading method is a systematic and complex issue. Through the microprocessor control electro-hydraulic servo measurement and control system, the time history curve of the graded pressures with the time. The loading process is processed according to the sequence of 1→2→4→7→10→15→20KN until it is broken. Each level of loading is cycled for five times. The low-frequency loading method can regard the loading path in the front as the foreshock, and the response under the current stress strain as the peak stress spectrum effect. In this way, the tunnel injury and damaging rules under different peak value pressures and different pressure of surrounding rocks can be simulated. At the same time, the accumulated injury effect under the dynamic and static cycling loading model can be gained.Considering the need of the follow-up loading, the pressure is transformed into the curve in which the stress strain changes with time (shown in Fig. 5, and the measurement of the loading board is 2m*0.7m):
0 1 2 3 4 5 6 7
-3.5x10⁴
-3.0x10⁴
-2.5x10⁴
-2.0x10⁴
-1.5x10⁴
-1.0x10⁴
-5.0x10³
0.0
0 2 4 6 8 10
0 2 4 6 8 10
Loading cycles/time
C
o
m
p
re
ss
iv
e
s
tr
e
ss
/p
a
[image:4.595.154.456.182.365.2]Loading stress diagram
Fig. 5 The curve chart of the graded loading stress strain changing with time RESULTS AND DISCUSSION
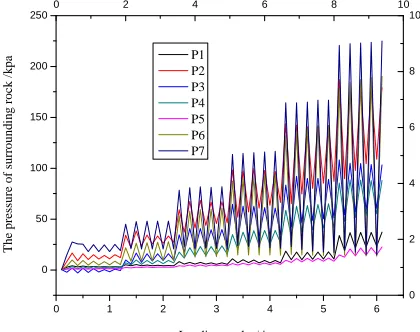
During the process of graded loading, the pressure of the surrounding rocks undergoes no significant changes. The curve of the pressure of the surrounding rocks of the seven monitoring points is almost not involved with each other, which is shown in Fig. 6. At the same time, it can be seen that the pressure of the surrounding rocks, when under the cycling loading model of the same level, shows little accumulated effect, which is almost related to the loading pressure (amplitude).
0 1 2 3 4 5 6
0 50 100 150 200 250
0 2 4 6 8 10
0 2 4 6 8 10 T he pr es sur e of s ur round in g roc k /k pa Loading cycles/time P1 P2 P3 P4 P5 P6 P7
Fig. 6 The curve chart of the pressure (kPa) of the surrounding rocks changing with time
3.2. Analysis of the strain change results
The strain monitoring points are mainly distributed in the sprayed concrete inner wall and the external side of the reinforced area of the surrounding rocks. According to the loading results, it is shown that the initial image change of the strain occurs in the third level loading, which is 10kN. The change is the most significant especially when the external side of the reinforced area of the surrounding rocks is close to the position of the vault (S6) and the sprayed concreate vault (S16). This is the crack initiation period. In the fourth level loading, which is 15kN (damage occurs in the third loading of the level ), the strain gage (S16) of the sprayed concreate vault is snapped, exceeding the range limit, and the stress strain (S7) in the reinforced area of the surrounding rocks also undergoes sudden changes. This is called the crack expansion period. In the fifth level of loading, which is 20KN, there appear the perfoliate cracks, and the stress strain (S7) in the reinforced area of the surrounding rocks continues to increase until it is damaged. This can be regarded as the damaging period.
0 100 200 300 400 500 600 700
-1000 0 1000 2000 3000 4000 5000 6000 7000 8000
0 2 4 6 8 10
0 2 4 6 8 10 Loading cycles/time S tr ai n /1 0 -6 S14 S15 S16
0 1 2 3 4 5 6 7 -1400 -1200 -1000 -800 -600 -400 -200 0 200 400
0 2 4 6 8 10
0 2 4 6 8 10 Loading cycles/time S tr a in /1 0
-6 S1
[image:5.595.202.412.134.300.2]S2 S3 S4 S5 S6 S7
Fig. 7 The strain change curve chart of the sprayed concreate inner wall
Fig. 8 The strain change curve chart of the reinforced area of the surrounding rocks
3.3. Analysis of the displacement change results
[image:5.595.85.516.462.638.2]0 1 2 3 4 5 6 7 8 -12 -10 -8 -6 -4 -2 0 2 4 6 8 10 12 14 16 18 20 22 24 26
280 2 4 6 8 10
0 2 4 6 8 10 Loading cycles/time D is p la ce m e n t/ m m D1 D2
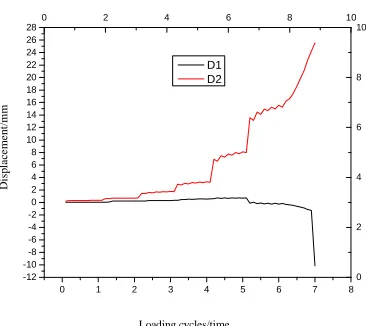
Fig. 9 Curve chart of the sprayed concrete inner wall displacement changes
3.4. Comparison and analysis of the numerical simulation
The numerical simulation calculation model is built in strict accordance with the underground tunnel measurements of the model experiment. The mesh generation is shown in Fig. 10. The lining and the reinforced area of the surrounding rocks are made up of the square meshes, and the triangle ones. At the same time, considering the prospective large changes occurring under the strain and deforming status near the lining, the mesh generation in this area is quite intensive. During the process of calculation, the materials of the surrounding rocks and the lining are regarded as the elastic materials, Mohr-Coulomb strength criterion is adopted and the partial damping coefficient is 0.157. In order to gain a higher degree of compatibility of the result of the numerical simulation and the model experiment, the loading curve of the model and the loading curve of the model experiment are in line with each other, and the displacement, strain and the strain marking method of the monitoring points remain consistent with each other.
0 2 4 6 8 10
-30 -28 -26 -24 -22 -20 -18 -16 -14 -12 -10 -8 -6 -4 -2 0
0 2 4 6 8 10
0 2 4 6 8 10 T h e re la ti v e d is p la ce m en t o f v au lt /1 0 -3m Loading cycles/time
[image:6.595.215.398.67.230.2]2kN Cyclic loading 4kN Cyclic loading 7kN Cyclic loading 10kN Cyclic loading 15kN Cyclic loading 20kN Cyclic loading
Fig. 10 Numerical simulation mesh Fig. 11 The relative displacement of various monitoring points gained after the numerical calculation
The fish language embedded in FLAC3D is employed to impose the graded loading curve on the top of the model, and the strain and deforming status of various monitoring points are observed on a real-time basis. From Fig. 11, it can be seen that the relative displacement of the vault and the result gained by the similarity model experiment are in line with each other, and both shows significant changes for the first time when under the loading model of 15kN. At the same time, the accumulated damage would gradually increase with the rise of the load.
The numerical simulation result shows that the error of the displacement curve and the similarity model experiment after 15KN is comparatively large, which suggests that deformation occurs in the tunnel’s vault and some part even shows damage in the loading process of above 15kN. Obviously, the simulation of FALC3D software based on the continuum theory cannot comparatively genuinely reflect the damaging status of the tunnel in the process.
3.5. Performance quantitative analysis
[image:6.595.263.528.377.548.2]experiment, the tunnel’s performance stand under the function of the dynamic and static combined cycling loading can be gained, which is shown in Fig. 12 and Table 2:
Performance level I Performance level II Performance level III
[image:7.595.86.530.104.343.2]Performance level IV Performance level V Fig. 12 The performance standard classification of the crack width
and the damaging status of the tunnel’s vault
Table 2 The comparison of the tunnel’s performance standard and the model’s experiment results
Categ-ory General description
Repair
measures Pressure(KN) Stress(Kpa/m2) Strain
Vault displacement
I Good
performance Normal use 1→2→4
-0.06→-0.10→-0.3
2 10-5 magnitude
Within 1.8mm
II Slight damage
Temporary
use 4→7→10
-0.32→-0.50→-0.7
2 10
-5
magnitude Within 3.3mm
III Heavier damage
After the
repair service 10→15 -0.72→-1.11
Arch wall strain fracture, more than 10-3 magnitude.
Within 8.1mm
IV Serious
damage Life safety 15→20 -1.11→-1.45
Vault and arch strain than 10-3 magnitude,over strain range
Up to 15.5mm
V Close to collapse
Collapse prevention
20→Destructio
n -1.45→-3.16 Out of gauge
More than 25.5mm
CONCLUSION
(1) The experiment phenomena show that the dynamic and static combined cycling loading method can well reflect the generation and expansion process of the microcrack in the rocks and the concrete materials on a macro basis. This is an effective method to research into the off-wall underground tunnel. Under the condition when there are major deformation and accumulated injury statuses occurring in the tunnel, the method can comparatively genuinely reflect the damaging status of the underground tunnel.
(2) The plasticity displacement, strain and stree strain changes of the underground tunnel in different monitoring points under different load conditions can well describe the damaging rules of the underground projects. The increase of load magnitude can obviously result in the displacement of the monitoring points (vault), which may trigger the first transcending damage of the tunnel and the accumulated damage of the cycling loading. The magnitude of the load is positively related to the accumulated damage degree. The strain of the vault undergoes sudden changes in the third cycling when the load is 15KN. This suggests that the underground tunnel has undergone serious damage. The following loading process and results show that the displacement and the crack width of the vault keep increasing, but are within the controllable range.
[image:7.595.73.545.381.496.2](4) The model experiment and the numerical simulation results show that the two coincide with each other quite well, and can well represent the performance standard of the underground tunnel, thus providing the reference for the prevention and design against and of the earthquake effect and the explosion.
Acknowledgements
This research is financially supported by the National Natural Science Foundation of China (No.50979112).
REFERENCES
[1]Zheng Yinren;Zhao Shangyi; Deng Chujian, et al. Development of Finite Element Limit Analysis Method and Its Applications in Geotechnical Engineering[J]. Engineering Science, 2006, 8(12): 39-61. (in Chinese)
[2]Su Yonghua; He Xinliang ;Luo Zhengdong. Research on the stability of surrounding rocks based on the strength reduction method [J]. Hydrogeology & Engineering Geology, 2014,.41(1):48-53. (in Chinese)
[3]Chen Qing; Zheng Yinren ; Chen Jianjie. Analysis of Seismic Response of Granite Tunnel under Earthquake Effect and Related Aseismic Measures[J].Vibration and Shock,2013,32(10):149-156.
[4]Zheng Yinren. Impact of Recognition of Underground Engineering Failure Mechanism on Engineering
Construction Risk s[J].Chongqing Architecture,2012,11(9):5-14. (in Chinese)
[5]Zhang Zhiguo;Xiao Ming;Zhang Yuting,et al. Dynamic finite element analysis of large-scale complex
underground caverns with three-dimensional elastoplastic damage model[J]. Chinese Journal of Rock Mechanics
and Engineering,2010,29(5):982-989.(in Chinese)
[6]Lin Gao;Chen Jianyun;Xiao Shiyun. Dynamic behavior of concrete and nonlinear seismic response of arch dam[J].Journal of Hydraulic Engineering,2003,34(6):30-37.(in Chinese)
[7]Shen Xinpu; Xu Bingye. Constitutive Theory of Plasticity Coupled with Orthotropic Damage for
Geomaterials[J].Applied Mathematics and Mechanics,2001 (9):1028~1034
[8]Dong Changzhou;Yang Jianhui ; Hu Ting. Problems of Environmental Impact Assessment of Highway Tunnels and
Countermeasures[J].Modern Tunnelling Technology,2010,47(1):11-16. (in Chinese)
[9]Wang Shu; Zhang Dingli ;Fang Qian. Mechanical Properties of Similar Materials for Soft Rock in Tunnel[J].Huaqiao University,2010,31(6):680-683. (in Chinese)
[10]Zhao Wen;Xie Qiang;Zhan Zhifeng. Research Displacement Characteristic of Beipanjiang River Bridge Bank
Slope by Model Test[J].Sichuang Uiversity,2002,34(4):60-63. (in Chinese)