© 2017, IRJET | Impact Factor value: 5.181 | ISO 9001:2008 Certified Journal | Page 75
Second Throat Diffuser System at Different Back Pressure for High
Altitude Test
S Rajkumar
1, G.Eswar phani kumar
2, Jeevananda Kumaran Ganesan
31
Assistant professor, SRM University
2
B.E III
rdyear aero, SRM University
3
Tech specialist, BAODC Tech Mahindra
---***---Abstract— The diffuser is stated to be unsuitable for testingthe nozzle since the flow results of the nozzle will not be accurate. Optimization of the diffuser design is done by modifying certain dimensions of the initial diffuser design and analysis which produced various results such as: (i) Accelerated flow in the diffuser divergent section; (ii) Unstable diffuser flow; (iii) Unstable flow with pressure recovery; (iv) Stable flow with pressure recovery. The optimized diffuser having straight section length 1m, throat diameter 1.2 m, throat length 12 m gave a stable flow along with suitable pressure recovery. The performance analysis carried out on this diffuser shows that below 200 mbar pressure at the exit, the flow inside the nozzle and the diffuser will be stable and provide good expansion results. The pressure recovered by the second throat diffuser was verified by testing in HAT model. Hence for HAT facility the high area ratio nozzle and the second throat diffuser designs are accurate.
Key Words: Diffuser, Choked flow, Back Pressure, HAT facility.
1.
Introduction
ropulsion systems are used to place spacecraft and artificial satellites in the desired orbits. Chemical thrusters are often employed as satellite propulsion systems for on- orbit control and station keeping. Satellites launched into orbit
Gradually tend to drift from the orbit both horizontally and vertically, due to atmospheric disturbances. For the Attitude and Orbital Control of Satellites (AOCS), small thrusters are mounted on the satellite which are designed to operate in upper atmosphere (high altitudes), where the pressure value is very low. The thrust levels for the thrusters employed in the satellite propulsion systems are very small in magnitude (in the range of few Newtons). During ground testing of such thrusters, the exhaust flow separates in the divergent portion of the nozzle due to large area ratio and resisting atmospheric pressure. Therefore, to attain full flow in the nozzle without any flow separation, the lowpressure environment corresponding to the flight situation has to be created in the ground test
facility. In the present study, an ejector- diffuser system is employed to create and maintain the required low pressure environment (about 3 mbar). Since the desired vacuum level is very low, a multi- stage external ejector is required to share the evacuation load. Also, the exhaust gas issued from the thruster does not have sufficient momentum to maintain the low pressure environment in the vacuum test chamber. Therefore, the maintenance of low vacuum level is achieved with the help of multi- stage ejector and the mild support of diffuser. From the literature survey, it appears that few studies are available on ejector- diffusers [Annamalai et al., 1998, Chen et al., 1994,
German et al., 1966, Kim et al., 1999, Puzach. 1992, Sankaran et al., 2002], which mainly deals with small area ratio nozzles. For testing satellite thrusters, which employs large area ratio (Ae/At > 100) nozzles, no detailed work has been reported so far on ejector- diffuser performance. Therefore, in the current study, an attempt has been made to evaluate the performance of a STED employed in such high altitude simulation. As a first part of the study, decoupled analysis has been carried out for the STED (thruster coupled with diffuser), for whichthruster of Ae/At = 100 and diffuser back pressure of 34 mbar is considered. Predicted results are validated with the in- house experimental data obtained in a HAT facility of large area ratio (Ae/At = 100) satellite thruster. Also, for the same configuration the investigation has been conducted for various back pressure values (varied in the range 34 mbar to 200 mbar). Later, simulations have been performed for different STED configurations, by varying the satellite thrusters (whose Ae/At = 36, 64 and 256) keeping the diffuser configuration fixed. For each STED configuration the critical back pressure has been identified.
© 2017, IRJET | Impact Factor value: 5.181 | ISO 9001:2008 Certified Journal | Page 76
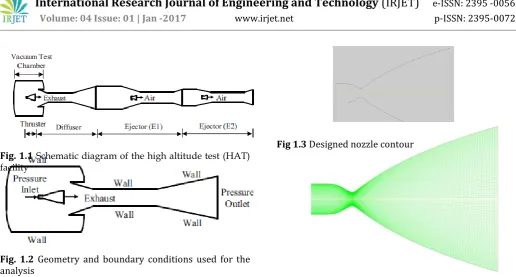
[image:2.595.36.553.53.330.2]
Fig. 1.1 Schematic diagram of the high altitude test (HAT)
facility
Fig. 1.2 Geometry and boundary conditions used for the analysis
1.1
Design of Nozzle
A nozzle is used to produce thrust by converting pressure energy into kinetic energy. The nozzle accelerates the gas through its expansion section. There are different types of nozzle that are used. Depending on the exit velocity the nozzle shape varies. For subsonic operation the nozzles have convergent portion only from the combustion chamber. For supersonic exit velocities a convergent divergent nozzle is used. The convergent section accelerates the low velocity of the exhaust gases from the combustion chamber to sonic velocity at the throat. The throat is the location along the nozzle axis having minimum cross-sectional area. After the throat the gas enters the diverging section that expands the gas further causing a decrease in pressure and an increase in Mach number. The Mach number of the gas at the exit depends on the Area Ratio of the nozzle.
Bell nozzles are the commonly used nozzles as they are more advantageous than the other types of nozzles. This nozzle provides smooth expansion, maximum thrust along the axis and gives the required Mach number at a length less than that of conical nozzle. Length is of major importance in the Aeronautical or Aerospace industry so the bell nozzle is the optimum shape preferred for the supersonic applications. The bell nozzle provides maximum thrust along the axis of the nozzle and also offers accurate thrust control for rockets or missiles. As the nozzle is the one of the most important components of the engine, its design is extremely important, since the variation in contour shape will cause improper exit flow, thus affecting the thrust.
A conical nozzle has a deflection angle of 150 between contour and the axis and an arc connects the throat and exit area. However for a bell nozzle the deflection angle varies at each point of the bell nozzle. There are different methods to design a bell nozzle. These methods are: G.V. Rao method, Method of Characteristics, using Foelsch equations.
Fig 1.3 Designed nozzle contour
Fig 1.4 Nozzle contour after meshing
The diffuser is modeled at the exit of the nozzle using GAMBIT software. The points are plotted and the lines are drawn accordingly. Each of the sections, the convergent, throat and the divergent sections are drawn separately for more efficient meshing of the design. The initial design of the diffuser is shown in figure.
Fig. 1.5: Designed nozzle and diffuser
Fig. 1.6: Nozzle and Diffuser mesh
2
S
ECONDT
HROATD
IFFUSER-C
ONCEPT2.1 Diffuser
© 2017, IRJET | Impact Factor value: 5.181 | ISO 9001:2008 Certified Journal | Page 77
arresting back flow from the atmosphere into the testchamber using the momentum of the rocket exhaust. During the initial period, a part of the rocket exhaust plume may enter into the initially evacuated test chamber and thereby resulting in an increase of nozzle exit pressure. At high back pressure, the exhaust plume may separate in the nozzle divergentportion and consequently, the full thrust of the rocket motor will not be realized. In order to operate the rocket motor without any flow separation, the low pressure environment corresponding to the flight situation has to be created initially and maintained during the testing, with the help of an external ejector device initially and after the achievement of supersonic flow at the diffuserinlet (known as the “diffuser- started” condition), a properly designed ejector- diffuser system can maintain the vacuum level by utilizing the momentum of the motor exhaust plume itself, without assistance from the external ejector. The “starting” criterion for an ejectordiffuser depends on various factors such as the geometries of the diffuser duct and the rocket nozzle, and the operational parameters for the rocket motor. In the present study, detailed numerical simulations have been carried out on the performance characteristics of a straight ejector diffuser in order to identify the optimal diffuser configuration for testing high area ratio rocket motors. Different configurations of ejector- diffusers are possible such as the Straight Ejector Diffuser SED, Second Throat Ejector Diffuser STED, and Center Body type Second Throat Ejector. In the case of a Straight Exhaust Diffuser, a weak terminal normal shock is created due to the interaction of exhaust flow with the duct wall. The challenging task in designing such a diffuser [1- 4] is to keep the facility length and starting pressure ratio as low as possible. However, a short SED also requires a larger motor chamber pressure for getting the diffuser started. An ejector- diffuser with a smaller starting pressure is preferred since it will achieve self- pumping condition at an earlier phase of the motor ignition transient and back flow into the vacuum chamber will be arrested once the diffuser attains startedcondition. The starting stagnation pressure for a diffuser, is a function of both the geometrical parameters like the nozzle area ratio, diffuser contraction angle and the second throat L/D ratio [5- 8] and the operating conditions of the motor. The pumping performance of the ejector – diffuser has been observed to be sensitively dependent on the attachment of primary flow on the inner wall of the duct [9]. Experiments of Puzach [10] indicate that the supersonic diffuser geometry influences the start- up pressure ratios and the flow structure of the system of shock waves. Numerical investigations [11 - 15] are quite helpful in analyzing the performance of different ejector- diffuser subsystems under design and offdesign modes of operation and also for understanding the flow features including the structure of shock cells. In the present work, detailed steady state numerical simulations have been carried out to understand the complex flow in a straight ejector- diffuser system.
2.2 Choked flow
If the fluid is a liquid, a different type of limiting condition (also known as choked flow) occurs when the Venturi effect acting on the liquid flow through the restriction decreases the liquid pressure to below that of the liquid vapor pressure at the prevailing liquid temperature. At that point, the liquid will partially flash into bubbles of vapor and the subsequent collapse of the bubbles causescavitation. Cavitation is quite noisy and can be sufficiently violent to physically damage valves, pipes and associated equipment. In effect, the vapor bubble formation in the restriction limits the flow from increasing any further.All gases flow from upstream higher pressure sources to downstream lower pressure sources. There are several situations in which choked flow occurs, such as the change of cross section in ade Laval nozzle or flow through an orifice plate. Choking in change of cross section flow-Assuming ideal gas behavior, steady state choked flow occurs when the ratio of the total (stagnation) absolute upstream pressure to the absolute static downstream pressure is equal to or greater than [(k+1) / 2]k/(k−1), where k is the specific heat ratio of the gas (sometimes called the isentropic expansion factor and sometimes denoted as ).For most gases, k ranges from 1.09 (e.g. butane) to 1.67 (monatomic gases), and therefore [(k+1) / 2]k/(k−1) ranges from 1.7 to about 2.1
The mass flow rate is primarily dependent on the cross-sectional area A of the hole and the upstream pressure P, and only weakly dependent on the temperature T. The rate does not depend on the downstream pressure at all. All other terms are constants that depend only on the composition of the material in the flow. Although the gas velocity reaches a maximum and becomes choked, the mass flow rate is not choked. The mass flow rate can still be increased if the upstream pressure is increased.
If the gas is being released from a closed high-pressure vessel, the above steady state equations may be used to approximate the initial mass flow rate. Subsequently, the mass flow rate will decrease during the discharge as the source vessel empties and the pressure in the vessel decreases. Calculating the flow rate versus time since the initiation of the discharge is much more complicated, but more accurate. Two equivalent methods for performing such calculations are explained and compared online. The technical literature can be very confusing because many authors fail to explain whether they are using the universal gas law constant R which applies to any ideal gas or whether they are using the gas law constant Rs which only applies to a specific individual gas. The relationship between the two constants is Rs = R / M.
3 Pressure distribution in the nozzle
A plot of the pressure distribution along the nozzle (figure 3) provides a good way of summarizing its behavior. To understand how the pressure behaves you have to remember only a few basic rules
© 2017, IRJET | Impact Factor value: 5.181 | ISO 9001:2008 Certified Journal | Page 78
the pressure drops• The pressure rises instantaneously across a shock • The pressure throughout the jet is always the same as the ambient (i.e. the back pressure) unless the jet is supersonic and there are shocks or expansion waves in the jet to produce pressure differences.
• The pressure falls across an expansion wave. The labels on figure 3 indicate the back pressure and pressure distribution for each of the flow regimes illustrated in figure 3. Notice how, once the flow is choked, the pressure distribution in the converging section doesn't change with the back pressure at all.
The flow pattern Figure 3 a shows the flow through the nozzle when it is completely subsonic (i.e. the nozzle isn't choked). The flow accelerates out of the chamber through the converging section, reaching its maximum (subsonic) speed at the throat. The flow then decelerates through the diverging section and exhausts into the ambient as a subsonic jet. Lowering the back pressure in this state increases the flow speed everywhere in the nozzle.
Lower it far enough and we eventually get to the situation shown in figure 3b. The flow pattern is exactly the same as in subsonic flow, except that the flow speed at the throat has just reached Mach 1. Flow through the nozzle is now choked since further reductions in the back pressure can't move the point of M=1 away from the throat. However, the flow pattern in the diverging section does change as you lower the back pressure further.
As pb is lowered below that needed to just choke the flow a region of supersonic flow forms just downstream of the throat. Unlike a subsonic flow, the supersonic flow accelerates as the area gets bigger. This region of supersonic acceleration is terminated by a normal shock wave. The shock wave produces a near-instantaneous deceleration of the flow to subsonic speed. This subsonic flow then decelerates through the remainder of the diverging section and exhausts as a subsonic jet. In this regime if you lower or raise the back pressure you increase or decrease the length of supersonic flow in the diverging section before the shock wave.
[image:4.595.306.548.60.577.2]If you lower pb enough you can extend the supersonic region all the way down the nozzle until the shock is sitting at the nozzle exit (figure 3d). Because of very long region of acceleration, the flow speed just before the shock will be very large. However, after the shock the flow in the jet will still be subsonic.
Fig 3.1Flow Patterns
4. Nozzle Analysis
© 2017, IRJET | Impact Factor value: 5.181 | ISO 9001:2008 Certified Journal | Page 79
Fig 4.1 Diffuser at Back Pressure, Pb = 200 m bar.Fig 4.2 Diffuser at Back Pressure, Pb = 140 m bar
Fig 4.3 Diffuser at Back Pressure, Pb = 80 m bar
5 Performance analysis of optimized diffuser
The diffuser design that was optimized must be analyzed for performance at different exit pressures. This is to verify the stability of the flow inside the nozzle when a test is conducted on it. It is seen that the diffuser is steady at an exit pressure of near 200 m bar. Above this pressure the flow is unstable, and will yield inaccurate results during testing of the nozzle. The pressure value below which stable flow is attained is the stable flow limit. Below this recovery Pressure value the flow is stable and there is complete expansion inside the nozzle. This is required for testing the High Area Ratio nozzle and will give accurate expansion results during testing of the nozzle. The analysis is carried out at different back pressure values and the pressure variations are studied. The pressures variations are used to determine if the flow is stable or unstable. A steady flow condition is one in which the final shock wave is created inside the divergent section of the diffuser. If the shock is formed in the throat of the diffuser the flow is unstable and is not suitable for testing the flow in the nozzle.The analysis that is carried out on the optimized nozzle and the second throat diffuser gives the various flow conditions at different recovery pressures. The unstable flow is obtained above 200 m bar and below this pressure value the flow is stable. Hence 200 m bar can be considered as the stable pressure limit. If the exit pressure is maintained below 200 m bar and the nozzle is tested the expansion is stable and the flow resultscan be considered as accurate.
Fig 5.1 Pressure plot for different recovery pressures
[image:5.595.37.553.41.475.2]Fig. 5.2 Unstable flows in the diffuser
Fig. 5.3 Stable flow in the diffuser
When both the ejectors are in running condition, the minimum exit pressure value that can be obtained is 40 m bar. Even if there is any flow disturbances causing variation in the diffuser exit pressure the flow inside the nozzle will be stable because of the oblique shocks that maintain the vacuum level inside the nozzle. The shock formation inside the diffuser throat will not allow the variations in exit pressure to affect the flow in convergent section and the nozzle. Thus the expansion inside the nozzle will not be affected and the flow results can be considered as accurate. Hence as long as the exit pressure is maintained below 200 m bar, the designed diffuser will give accurate test results in the nozzle.
6
V
ERIFICATION OF FLOW RESULTS [image:5.595.312.555.215.486.2]© 2017, IRJET | Impact Factor value: 5.181 | ISO 9001:2008 Certified Journal | Page 80
pressure 33.86 bar is made to flow through the nozzle. Theend of the diffuser is connected to ejectors. Pressure and temperature transducers are connected at different locations to record the readings. Prior to starting the test of the nozzle, the ejectors are operated to create low pressure in nozzle and second throat diffuser. The vacuum system is also operated in order to maintain the vacuum level around the nozzle. The pressure readings at the diffuser exit are verified for accurate operation of the transducers. The compressed gas is then allowed to flow into the nozzle and diffuser system. The diffuser exit pressure readings are recorded.
FIG.6.1DIFFUSER EXIT PRESSURE VS.TIME PLOT FOR MODEL HAT It can be seen that initially the pressure at the diffuser exit is at 60 m bar due to the operation of ejectors that help in maintaining the low pressure. Here the diffuser is in unstarted condition since no flow is entering into the diffuser. When the compressed gas is released into the nozzle the diffuser exit pressure increases and is nearly 220 mbar. This is similar to flow results obtained through the analysis that gave 200 mbar. Here the diffuser is in started condition as the flow entered the diffuser after undergoing expansion inside the nozzle. Since the readings recorded are steady, the flow inside the nozzle is stable and smooth expansion is taking place within the high area ratio nozzle without the formation of shockwaves.
7
C
ONCLUSIONThe High Area Ratio nozzle that was designed gave smooth and continuous expansion when the analysis was carried out for vacuum conditions. The initial diffuser design having straight section length 2.3 m; throat diameter 1.15 m; throat length 10 m and divergent length and diameter 9 m and 3 m, gave unstable flow in the nozzle. The diffuser is thus stated to be unsuitable for testing the nozzle since the flow results of the nozzle will not be accurate. Optimization of the diffuser design is done by modifying certain dimensions of the initial diffuser
design and carrying out the analysis, produced various results such as: (i) Accelerated flow in the diffuser divergent section; (ii) Unstable diffuser flow; (iii) Unstable flow with pressure recovery; (iv) Stable flow with pressure recovery. The optimized diffuser having straight section length 1m, throat diameter 1.2 m, throat length 12 m gave a stable flow along with suitable pressure recovery. The performance analysis carried out on this diffuser shows that below 200 mbar pressure at the exit, the flow inside the nozzle and the diffuser will be stable and provide good expansion results. The pressure recovered by the second throat diffuser was verified by testing in HAT model. Hence for HAT facility the high area ratio nozzle and the second throat diffuser designs are accurate.
8
R
EFERENCES[1] Manikanda Kumaran R, Rajamani A, Raja Manohar D, Sundarajan T, December 2010. Numerical Investigation of Second Throat Diffuser in High Altitude Test Facility, Proceedings of the 37th and 4th International Conference on Fluid Mechanics.
[2] Chen, F., Liu, C.F., Yang, J.Y., 1994. Supersonic flow in the second-throat ejector diffuser system, Journal of Spacecraft and Rockets 31, 123 – 129.
[3] German R.C., Bauer R.C., Panesci J.H., 1966. Methods for determining the performance of Ejector-Diffuser Systems, Journal of Spacecraft 3, 193 – 200.
[4] Kim H., Lee Y., Setoguchi T. and Yu S., 1999. Numerical Simulation of the Supersonic Flows in the Second Throat Ejector- Diffuser Systems, Journal of Thermal Science 8 (4), 214 – 222.