© 2017, IRJET | Impact Factor value: 5.181 | ISO 9001:2008 Certified Journal | Page 2848
EXPERIMENTAL STUDY ON STRENGTH BEHAVIOUR OF CONCRETE
USING FOUNDRY SAND AS FINE AGGREGATE
A S Hari Hara Sudan
1, Dr M Neelamegam
21
PG Student, Department of Civil Engineering, Easwari Engineering College, Chennai, India
2Professor, Department of Civil Engineering, Easwari Engineering College, Chennai, India
---***---
Abstract –
This paper reviews the strength behaviour ofconcrete using foundry sand as fine aggregate. The fine aggregate is replaced by foundry sand in the range of 0%, 10%, 20%, 30%, 40%, 50% and 60% by weight for M-25 grade concrete. Two types of foundry sand such as green sand and chemically bonded sand are used. Concrete mixtures are tested and 7, 14 and 28 days strength are found out. This research work is concerned with experimental investigation on strength of concrete by replacing fine aggregate by 0%, 10%, 20%, 30%, 40%, 50% & 60% of used foundry sand and the compressive strength, split tensile strength and flexural strength are found out.
Keywords— used foundry sand, green sand, chemically bonded sand, compressive strength, split tensile strength, flexural strength.
1. INTRODUCTION
The waste generated from foundries is called as foundry sand. Foundries recycle and reuse the sand many times and the remaining sand that is termed as foundry sand is removed from the foundry. This foundry sand consumes a large percentage of local landfill space for each and every year. Worse yet, some of the wastes are land spread on cropland as a disposal technique, raising concerns about trace contaminants building up in soil or running off into area lakes and streams. India produces about 9.6 million metric tons of foundry sand annually and it is the second largest producer of foundry sand in the world. The foundry sand can be used in concrete by replacing the river sand to a certain percentage as it is cheaper than the river sand and it is also found that foundry sand can increase the strength of concrete. The foundry sand is generally of two types; they are the green sand and chemically bonded sand. Green sand is generally used in metal casting industries and chemically bonded sand is used in places where the moulds are casted.
2. OBJECTIVE
To study the behaviour of concrete in which fine aggregate is replaced with green sand and chemically bonded sand at room temperature. To study the following main parameters, such as compressive strength of cubes, split tensile strength of cylinders and flexural strength of beams. The main objective is to find out the optimum percentage of green sand and chemically bonded sand.
3. METHODOLOGY
All the required materials like cement, fine aggregate, coarse aggregate, green sand and chemically bonded sand are collected and then the preliminary tests are carried out and the mix design calculations for M25 grade concrete is done. The cube, cylinder and beam specimens are casted for 0%, 10%, 20%, 30%, 40%, 50% and 60% of green sand and chemically bonded sand and then after curing, the specimens are tested and the compressive strength of cubes are found out for 7, 14 and 28 days and the split tensile strength of cylinders are found out for 7 and 28 days and the flexural strength of beams are found out for 28 days.
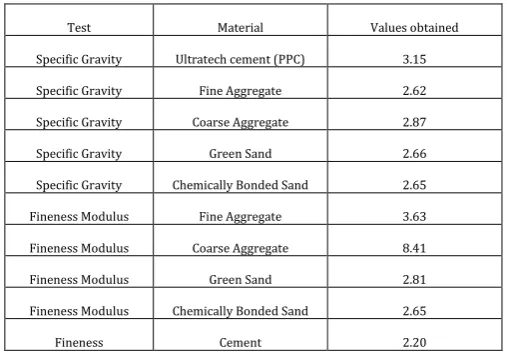
[image:1.595.307.561.435.613.2]4. MATERIAL TEST
Table 1: Material Test resultsTest Material Values obtained
Specific Gravity Ultratech cement (PPC) 3.15
Specific Gravity Fine Aggregate 2.62
Specific Gravity Coarse Aggregate 2.87
Specific Gravity Green Sand 2.66
Specific Gravity Chemically Bonded Sand 2.65
Fineness Modulus Fine Aggregate 3.63
Fineness Modulus Coarse Aggregate 8.41
Fineness Modulus Green Sand 2.81
Fineness Modulus Chemically Bonded Sand 2.65
Fineness Cement 2.20
5. MIX PROPORTIONS
Table 2: Concrete Design Mix Proportions
WATER (litre/m³)
CEMENT (kg/m³)
FINE AGGREGATE (Kg/m³)
COARSE AGGREGATE (Kg/m³)
197 438 592 1257
© 2017, IRJET | Impact Factor value: 5.181 | ISO 9001:2008 Certified Journal | Page 2849
6. EXPERIMENTAL INVESTIGATION
6.1 Experimental Procedure
The cube, cylinder and beam specimens were casted by replacing fine aggregate by green sand and chemically bonded sand for 0%, 10%, 20%, 30%, 40%, 50% and 60% and three specimens for each proportions were casted and all the specimens were tested and the average value for each proportion is found out. The size of the cube specimens are 150mm*150mm*150mm and the size of the cylinder specimens are 150mm*300mm and the
size of the beam specimens were
700mm*150mm*150mm. The average compressive strength of cubes, spilt tensile strength of cylinders and flexural strength of beams for each proportions of green sand and chemically bonded sand are found.
6.2 Test Procedure
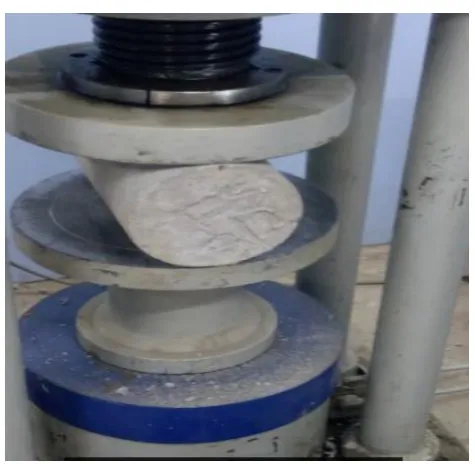
[image:2.595.316.554.93.325.2]The cube and cylinder specimens were tested using a compression testing machine having a capacity of 3000 kN and the beams were tested using an universal testing machine having a capacity of 1000 kN and single point loading is done. The beams tested are unreinforced concrete beams. Deflection values are not taken as it is an unreinforced concrete beam. The compression testing machine applies load until the cube or cylinder cracks and the value starts to return. The universal testing machine applies load till the beam fails and single point loading is done.
[image:2.595.307.561.438.768.2]Figure 1: Compressive strength test
Figure 2: Split tensile strength test
7. EXPERIMENTAL RESULTS
7.1 Compressive Strength Test
Table 3: Compressive Strength of Concrete with Green Sand
Green sand content
(%)
Compressive strength (N/mm2)
Average Compressive strength (N/mm2) 7
days 14days 28days 7 days 14 days 28days
0
17.7 26.1 31.0
17.9 26.4 31.2
17.8 26.3 31.1
18.2 26.8 31.4
10
19.6 28.4 33.6
19.8 28.8 33.8
19.8 28.7 33.8
19.9 29.2 33.9
20
21.4 30.6 35.9
21.6 31.0 36.3
21.6 31.0 36.5
21.7 31.3 36.6
30
23.0 32.9 38.9
23.2 33.4 39.1
23.2 33.5 39.1
23.5 33.7 39.3
40
23.6 35.2 41.9
23.8 35.4 42.0
23.9 35.5 42.1
24.0 35.6 42.1
50
21.6 32.2 38.3
21.9 32.5 38.6
22.0 32.5 38.5
22.1 32.8 38.9
60
20.4 28.7 33.6
20.8 29.2 33.6
20.8 29.4 33.6
[image:2.595.45.280.487.630.2]© 2017, IRJET | Impact Factor value: 5.181 | ISO 9001:2008 Certified Journal | Page 2850
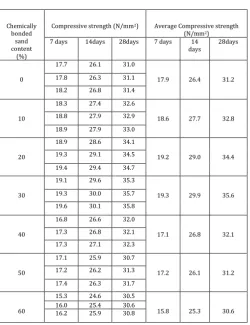
Table 4: Compressive Strength of Concrete withChemically Bonded Sand
Chemically bonded
sand content
(%)
Compressive strength (N/mm2) Average Compressive strength (N/mm2)
7 days 14days 28days 7 days 14
days 28days
0
17.7 26.1 31.0
17.9 26.4 31.2
17.8 26.3 31.1
18.2 26.8 31.4
10
18.3 27.4 32.6
18.6 27.7 32.8
18.8 27.9 32.9
18.9 27.9 33.0
20
18.9 28.6 34.1
19.2 29.0 34.4
19.3 29.1 34.5
19.4 29.4 34.7
30
19.1 29.6 35.3
19.3 29.9 35.6
19.3 30.0 35.7
19.6 30.1 35.8
40
16.8 26.6 32.0
17.1 26.8 32.1
17.3 26.8 32.1
17.3 27.1 32.3
50
17.1 25.9 30.7
17.2 26.1 31.2
17.2 26.2 31.3
17.4 26.3 31.7
60
15.3 24.6 30.5
15.8 25.3 30.6
16.0 25.4 30.6
16.2 25.9 30.8
[image:3.595.311.559.109.250.2]From Table 3 and 4, it is clear that the compressive strength of concrete increases when the fine aggregate is replaced by green sand from 0% to 40% and then the strength starts to decrease after 40% replacement by green sand and for chemically bonded sand, the compressive strength of concrete increases when the fine aggregate is replaced by chemically bonded sand from 0% to 30% and then the strength starts to decrease after 30% replacement by chemically bonded sand.
[image:3.595.38.289.125.451.2]Figure 3: Compressive strength difference between green sand and chemically bonded sand for various percentages of green sand and chemically bonded sand for 7 days.
Figure 4: Compressive strength difference between green sand and chemically bonded sand for various percentages of green sand and chemically bonded sand for 14 days.
Figure 5: Compressive strength difference between green sand and chemically bonded sand for various percentages of green sand and chemically bonded sand for 28 days.
7.2 Spilt Tensile Strength Test
Table 5: Split Tensile Strength of Concrete with Green Sand
Green sand content
(%)
Split tensile strength (N/mm2) Average Split tensile strength (N/mm2)
7 days 28days 7 days 28days
0
1.96 2.90
1.96 2.93
1.96 2.94
1.97 2.95
10
2.10 3.03
2.12 3.08
2.12 3.09
2.13 3.13
20
2.14 3.15
2.17 3.16
2.16 3.16
[image:3.595.313.556.327.470.2] [image:3.595.38.288.576.726.2] [image:3.595.156.551.588.790.2]© 2017, IRJET | Impact Factor value: 5.181 | ISO 9001:2008 Certified Journal | Page 2851
302.24 3.34
2.29 3.37
2.31 3.38
2.33 3.39
40
2.48 3.51
2.49 3.57
2.49 3.59
2.51 3.60
50
2.36 3.30
2.40 3.33
2.41 3.34
2.43 3.36
60
2.10 2.82
2.11
`
2.87
2.11 2.88
2.13 2.92
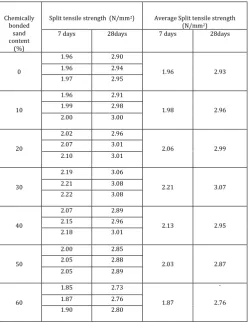
Table 6: Split Tensile Strength of Concrete with Chemically Bonded Sand
Chemically bonded
sand content
(%)
Split tensile strength (N/mm2) Average Split tensile strength (N/mm2)
7 days 28days 7 days 28days
0
1.96 2.90
1.96 2.93
1.96 2.94
1.97 2.95
10
1.96 2.91
1.98 2.96
1.99 2.98
2.00 3.00
20
2.02 2.96
2.06 2.99
2.07 3.01
2.10 3.01
30
2.19 3.06
2.21 3.07
2.21 3.08
2.22 3.08
40
2.07 2.89
2.13 2.95
2.15 2.96
2.18 3.01
50
2.00 2.85
2.03 2.87
2.05 2.88
2.05 2.89
60
1.85 2.73
1.87
`
2.76
1.87 2.76
1.90 2.80
[image:4.595.303.559.54.244.2]From Table 5 and 6, it is clear that the spilt tensile strength of concrete increases when the fine aggregate is replaced by green sand from 0% to 40% and then the strength starts to decrease after 40% replacement by green sand and for chemically bonded sand, the spilt tensile strength of concrete increases when the fine aggregate is replaced by chemically bonded sand from 0% to 30% and then the strength starts to decrease after 30% replacement by chemically bonded sand.
[image:4.595.37.290.92.272.2]Figure 6: Split tensile strength difference between green sand and chemically bonded sand for various percentages of green sand and chemically bonded sand for 7 days.
Figure 7: Split tensile strength difference between green sand and chemically bonded sand for various percentages of green sand and chemically bonded sand for 28 days.
7.3 Flexural Strength Test
Table 7: Flexural Strength of Concrete with Green Sand
Green sand content
(%)
Flexural strength (N/mm2) Average Flexural strength (N/mm2)
28days 28days
0
3.90
3.91 3.92
10
4.10
4.12 4.15
20
5.36
5.36 5.37
30
6.46
6.48 6.50
40
7.56
[image:4.595.39.289.315.639.2] [image:4.595.315.555.318.463.2]© 2017, IRJET | Impact Factor value: 5.181 | ISO 9001:2008 Certified Journal | Page 2852
506.47
6.48 6.50
60
4.33
4.36 4.39
Table 8: Flexural Strength of Concrete with Chemically Bonded Sand
Chemically bonded sand
content (%)
Flexural strength (N/mm2) Average Flexural strength (N/mm2)
28days 28days
0
3.90
3.91 3.92
10
3.95
3.98 4.02
20
4.86
4.86 4.86
30
5.87
5.91 5.95
40
5.64
5.68 5.73
50
4.80
4.82 4.84
60
4.00
4.02 4.05
[image:5.595.37.289.97.157.2]From Table 7 and 8, it is clear that the flexural strength of concrete increases when the fine aggregate is replaced by green sand from 0% to 40% and then the strength starts to decrease after 40% replacement by green sand and for chemically bonded sand, the flexural strength of concrete increases when the fine aggregate is replaced by chemically bonded sand from 0% to 30% and then the strength starts to decrease after 30% replacement by chemically bonded sand.
Figure 8: Flexural strength difference between green sand and chemically bonded sand for various percentages of green sand and chemically bonded sand for 28 days.
8. CONCLUSION
From the results, it is found that the compressive strength of cubes, spilt tensile strength of cylinders and flexural strength of beams increases when the fine aggregate is replaced by green sand from 0% to 40% and then after 40% replacement by green sand, the compressive strength, spilt tensile strength and flexural strength starts to decrease and similarly the compressive strength of cubes, spilt tensile strength of cylinders and flexural strength of beams increases when the fine aggregate is replaced by chemically bonded sand from 0% to 30% and then after 30% replacement by chemically bonded sand, the compressive strength, spilt tensile strength and flexural strength starts to decrease. The optimum percentage for replacing fine aggregate by green sand is 40% and the optimum percentage for replacing fine aggregate by chemically bonded sand is 30%.
ACKNOWLEDGEMENTS:
I feel glad to express my sincere acknowledgement to Dr. S. Lavanya Prabha, M.E, Ph.D., Head of the Department, civil Engineering for giving us the necessary facilities and continuous encouragement for the completion of the project.
I also express my sincere gratitude to Dr. M. Neelamegam, M.E, Ph.D.,Department of civil Engineering, designs for their training and facilities provided during the entire course of the project.
REFERENCES
[1] IS 1489-2015 (Part 1) Specification for Portland Pozzolona Cement.
[2] IS 516-1959 (Reaffirmed 1997) Methods of tests for strength of concrete. Bureau of Indian Standards, New Delhi, India.
[3] IS 383-1970 (Reaffirmed 1997) Specification for coarse and fine aggregate from natural sources for concrete. Bureau of IndianStandards, New Delhi, India.
[4] Tarun R. Naik, Viral M. Patel, Dhaval M. Parikh,
Mathew P. Tharaniyil, “Utilisation of used foundry sand in concrete”, Journal of Materials in Civil Engineering, Vol. 6, No. 2, May, 1994.
[5] Khatib.J.M, Baig.B, Menadi.B, Kenai.S, “Waste foundry sand usage in concrete”, INVACO2, Morocco-Rabat, November 23-25, 2011.
[image:5.595.39.285.583.721.2]