Polyphenol extraction from grape wastes: Solvent
and pH effect
Celia M. Librán, Luis Mayor, Esperanza M. Garcia-Castello
*, Daniel Vidal-Brotons
Instituto Universitario de Ingeniería de Alimentos para el Desarrollo, Universitat Politécnica de València, Camino de Vera s/n, 46022
Valencia, España; *Corresponding Author
Received August 2013
ABSTRACT
World wine industry transforms 10% - 25% of raw grapes into residues, mainly represented by lees, grape marcs, seeds and stems. These by- products are a rich source of polyphenols and therefore they can be used to produce new added value products. The aim of this work was to determine the best process conditions (treat- ment time, % of ethanol and pH of the solvent) during solid-liquid extraction of polyphenols from grape marcs, by analyzing the phenolic content of the extracts, namely: total polyphenol content, flavanols, flavonols, phenolic acids and antho- cyanins. Antioxidant activity of the extracts was also determined. An extraction time of two hours was enough since longer times did not increase process yields. Best extraction yields were ob- tained for 75% ethanol solutions. Basic pH led to better yields in extracting media with low per- centage of ethanol, whereas acid pH presented better extraction yields in extracting media with high percentage of ethanol. Among all the po- lyphenols extracted, anthocyanins were the most abundant representing over 40% of the total. In general, the best process conditions were 2 h of extraction in a 75% EtOH liquid mixture at pH = 2.
Keywords:Antioxidants; By-Products; Fruits;
Solvent Extraction; Wine
1. INTRODUCTION
In 2011, the world wine industry used 13,930,985 tons of grapes for its transformation [1]. Among them, from 10% to 25% (w/w) changed into residues after grape wine processing, being mainly represented by lees, grape marcs, seeds, stems and stalks [2,3]. These wastes are of difficult management due to their high biological oxygen demand [4].
In recent years, scientists have realized of this envi-
ronmental problem and looked for solutions. Several stu- dies marked these by-products as a rich source of poly- phenols and therefore they could be used to produce new added-value products [4-6]. Traditionally, these wastes were used for animal feed but recently they have been found as a low-cost source of antioxidants [7]. Some authors [8] have summarized the health aspects derived from the consumption of phenols from grape, mainly due to their antioxidant activity. Others suggested its applica- tion to food to extend their self-life and hence avoiding the use of synthetic antioxidants such as butylated hy- droxyanisole (BHA) or butylated hydroxytoluene (BHT) which use is regulated by international agencies [9,10].
Most common groups of polyphenols found in grapes are: anthocyanins, flavonols, flavanols and phenolic ac- ids [11]. Their total content in grape and grape wastes seemed to not vary among white and red varieties [12] although the extraction procedure has a significant effect on the quantity and quality of extracts [6,7,10]. Since the antioxidant power of grape extracts is in direct relation with their total polyphenol content [5,12], the selection of the best extraction conditions is of great importance, because it could alter the characteristics of the final ex- tract and then have an economic impact.
For these reasons, the aim of this study was to deter- mine the best process conditions (treatment time, percen- tage of ethanol and pH of the solvent) during solid-liquid extraction of polyphenols from grape marcs, by analyz- ing the effect of these conditions on several extraction yields, namely on total phenolics, flavonoids, flavanoids, phenolic acids and anthocyanins and also on the antioxi-dant power of the extracts.
2. MATERIALS AND METHODS
2.1. Grape Marcs
at −20˚C until their use. Homogeneous samples were taken and thawed at room temperature previous to use them in the experiments. They were dried at 25˚C in a conditioning chamber (ACR-45/87, Dycometal, Spain) up to moisture content of 16% - 18% (wet basis) (deter- mined by dry weight in a vacuum oven (J.P Selecta, Va- cioTem, Spain) at 70˚C till constant weight) and milled to reach a final particle size between 0.5 and 2.5 mm [7, 10].
2.2. Reagents
Gallic acid, ethanol, methanol, hydrogen chloride and sodium bisulfite were from Panreac. Sodium carbonate was from Fluka. Caffeic acid, p-dimethylaminocinnamal- dehyde (DMACA) and quercetin were from Sigma. Ca- techin, Trolox and 2,2-diphenyl-1-picrylhydrazyl (DPPH) were from Aldrich. Potassium hydroxide was from Ana- laR.
2.3. Extraction Procedure
Solid-liquid extractions were carried out on an orbital shaker (GFL Typ 3005 D-30938 Burgwedel, Germany) at 150 rpm and room temperature (20˚C - 23˚C), with 1/25 (w/v) ratio sample/solvent according to previous studies [13,14]. After the extraction, liquid extracts were sepa- rated from solids by centrifugation (3600 rpm for 10 min, Selecta, Medifriger, BL-S, centrifuge), and then stored at −20˚C overnight up to their analysis.
2.4. Extraction Kinetics
Ethanol/water mixtures at different ratios were used as solvents with the necessary amounts of HCl or KOH to regulate the liquid pH (always less than 1 mL). It was necessary to correct the pH lecture by Eq.1, because the equipment was calibrated with aqueous tampons.
0
pH = pH +δ (1)
where pH is the corrected lecture and pH0 is the lecture given by the pHmeter.
The values of δ were obtained from the literature, ranging from −2.9 to 0 [15,16]. The liquid extracts were analyzed for their total polyphenolic index (TPI) at dif- ferent times during 8 h, for the determination of extrac- tion kinetics.
2.5. Extractions at Fixed Time
A full factorial design [17] with five levels for ethanol concentration (0%, 25%, 50%, 75% and 100%) and four levels for pH (2, 5.3, 8.7 and 12) was used. Experiments were done in duplicate, giving a total of 40 runs. Extrac- tion time was fixed from the previous experiments de- scribed in 2.4. The yields for each extracting condition
were determined by analyzing the concentration in the extract of total polyphenols, flavonols, flavanols, phe- nolic acids, anthocyanins and antioxidant activity. All the determinations were done by triplicate.
2.6. Chemical Analyses
2.6.1. Total Polyphenol Index and Total Polyphenol Content
Total polyphenol index (TPI) was determined from the
Eq.2
280*
TPI =A n (2)
where A280 is the absorbance at 280 nm of the extract and n is its dilution factor.
Total polyphenol content (TPC) was calculated from the TPI, standardized against a gallic acid curve expressed as mg gallic acid equivalent (GAE) per mL of extract [4]. Total polyphenol extraction yield was expressed as mg GAE/g dry sample (3).
[
GAE (mg) dry sample (g)]
= GA (mg/mL) *Liquid (mL) dry mass (g) (3)
2.6.2. Total Flavanols
Flavanols were determined after derivatization with
p-dimethylamino-cinnamaldehyde (DMACA), since this method has proved to have no interferences with antho- cyanins. The followed method was adapted from refer- ences [12,18]. Briefly, the extract was 1/10 (v/v) diluted with MeOH, and then 1.5 mL of acidified DMACA solu- tion were added to 0.3 mL of methanolic extract. The mixture was allowed to react for 10 min at room temper- ature, and the absorbance was read at 640 nm. Total fla- vanol content was standardized against a catechin curve expressed as mg of catechin equivalent (CE) per mL of extract, and the flavanols extraction yield was expressed as mg CE/g dry sample, using an equation similar to
Eq.3.
2.6.3. Total Flavonols and Phenolic Acids
Total flavonols and phenolic acids were determined following the procedure described by references [7,19, 20]. Briefly, extracts were thoroughly mixed sequentially with acidified ethanol and HCl 2%. Absorbances at 360 and 320 nm were measured for total flavonols and phe- nolic acids, respectively. After the correspondent calibra- tion curves, the results were expressed as mg of querce- tin equivalent (QE) and mg of caffeic acid equivalent (CAE) per mL of extract for total flavanols and phenolic acids, respectively. Both extraction yields were calcu- lated using an equation similar to Eq.3.
2.6.4. Total Anthocyanins
thod based on their specific properties of bleaching by SO2, and calculated by comparison with a standardized
anthocyanin solution according to reference [21]. The anthocyanins extraction yield was expressed as mg an- thocyanins/g dry sample, using equation similar to Eq.3.
2.6.5. Antioxidant Activity
Antioxidant activity was determined by the DPPH (2,2- diphenyl-1-picrylhydrazyl) method described by refer- ence [18]. Each extract was diluted 1/10 (v/v) with me- thanol, and 3.8 mL of DPPH solution (60 μM in MeOH) was added to 0.2 mL of methanolic sample. At t = 0 min (A515(0)) and after 30 min (A515(30)) of reaction, absor-
bances were measured at 515 nm and the results were expressed as percentage with Eq.4:
515 515(0) 515(30) 515(0)
%∆A =(A −A ) A *100 (4)
Afterwards, antioxidant activity was expressed as μM of Trolox equivalent per mL of sample, by using a pre- vious calibration curve. The yield was expressed as μmol of Trolox equivalent/g dry sample, and was obtained using and equation similar to Eq.3.
2.7. Statistical Analysis
Each extraction, at the different conditions previously explained, was assayed twice, and the obtained extracts were chemically analyzed three times each. Therefore, a descriptive analysis was performed, and all values were averaged and given along with their confidence interval (t student). Significant effect of ethanol concentrations and pH were evaluated with an analyses of variance (ANOVA, p < 0.05) and a Tukey test was carried out to find differences among groups. Moreover, results were fitted to a second order polynomic equation (Eq.5) that considers lineal and quadratic effects as well as interac- tion effects among the experimental factors studied
2 0
1 1 1
n n n
i i ii i ij i j
i i j i
Y β βX β X β X X
= = = +
= +
∑
+∑
+∑
(5)where Y is the studied response and β0, βi, βiiyβij are the
independent, lineal, quadratic and interaction coefficients, respectively. Non-linear fit and goodness of fit (R2) were performed through the STATGRAPHICS Centurion XVI software (Statpoint Technologies Inc.).
[image:3.595.307.535.83.621.2]3. RESULTS AND DISCUSSION
3.1. Extraction Kinetics
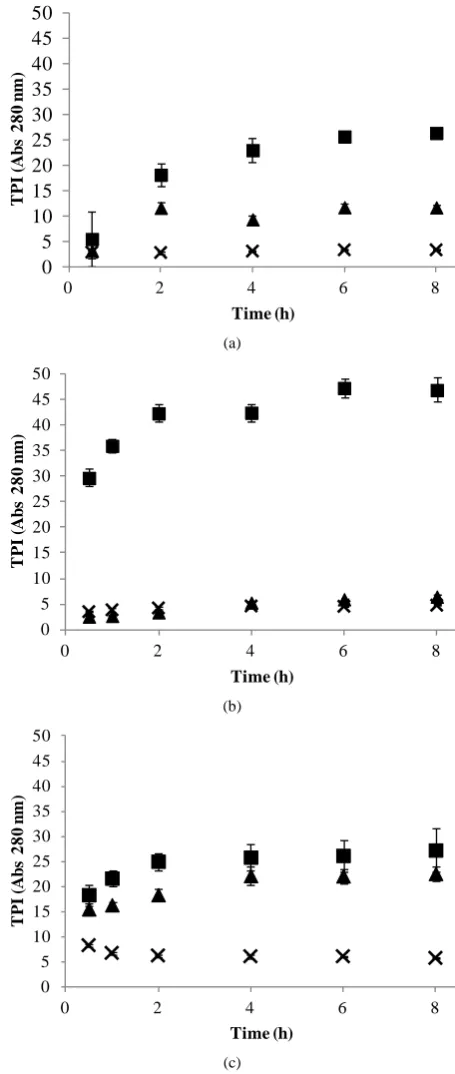
Figure 1 shows the evolution of TPI with time at dif- ferent concentrations of ethanol in the extracting liquid (0%, 50% and 100% of ethanol) and without fixing pH (Figure 1(a)), with pH = 2 (Figure 1(b)) and pH = 12 (Figure 1(c)).
(a)
(b)
(c)
Figure 1. Polyphenol extraction kinetics from wine wastes samples extracted with different water/ethanol mixtures without fixing pH (a), with pH = 2 (b) and with pH = 12 (c) expressed as TPI (mean ± confidence interval). x, and : 0%, 50% and100% of ethanol, respectively.
In general, at first stage, the TPI increased fast, fol- lowed by a slow increment and then remained practically constant till the end of the process. This asymptotic be- havior was found previously by other authors [10,22]. In
0 5 10 15 20 25 30 35 40 45 50
0 2 4 6 8
T
P
I
(A
b
s
2
8
0
n
m
)
Time (h)
0 5 10 15 20 25 30 35 40 45 50
0 2 4 6 8
T
P
I
(A
b
s
2
8
0
n
m
)
Time (h)
0 5 10 15 20 25 30 35 40 45 50
0 2 4 6 8
T
P
I
(A
b
s
2
8
0
n
m
)
Figure 1(b), can be observed that the TPI with 50% EtOH was the highest (twofold the 100% EtOH and six- fold the 0% EtOH) which means a positive effect on the use of this organic solvent until certain concentration. When the pH was fixed, the trend with percentage of ethanol was the same but different behaviour was ob- served at the different pH assayed. Hence, the acid pH (Figure 1(b)) increased the TPI for 0% and 50% EtOH, but decreased it for 100% EtOH and the pH = 12 im- proved the extraction for 0 and 100% EtOH and did not affect the 50% EtOH.
Different authors marked as better extraction condi- tions, concentrations of ethanol near to 50% finding de- creases on TPI extraction yields with higher EtOH con- centrations [6,10,23]. They suggested that ethanol reduces the dielectric constant of the solvent, thus increasing the diffusion of the bioactive molecules with the solvent. However, highly pure organic solvents, e.g. 100% EtOH, could dehydrate the vegetable cells, making difficult the diffusion of polyphenols from the plant material to the extracting liquid.
The pH effect has not been extensively studied before this work. Reference [6] assayed its effect on the stability of extracts. They found that pH 3 and 5 maintain the an- tioxidant power instead of pH 7 and 9 which showed reductions of this property of the extracts.
All this results showed that indistinctly the pH or the EtOH concentration in the extracting medium, at 2 hours of extraction the TPI yield was at least 90% of the max- imum attained during the kinetics experiments. Therefore, this time was used for the next extractions.
3.2. Total Polyphenol Yields
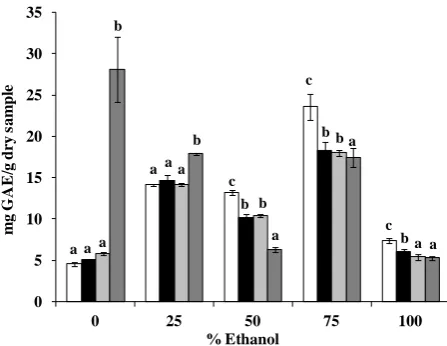
Extraction of total polyphenols (Figure 2), according to analysis of variance, was significantly affected (p < 0.05) by the ethanol concentration and the pH. Results ranged from 4.58 to 28.06 mg GAE/g dry sample, de- pending on the extraction conditions (0% EtOH, pH = 2 and 0% EtOH and pH = 12, respectively) and similar results were achieved by reference [10] with 50% EtOH extracting solutions.
It is also observed an increase in the polyphenol ex- traction yield with basic pH for aqueous extractions (0% and 25% EtOH) and this tendency changed at higher EtOH concentration, where acid pH had the better ex- traction yields. However, the highest TPCs were obtained with 75% EtOH at all the assayed pH, with exception of pH = 12.
3.3. Flavonol, Flavanol, Phenolic Acid and
Anthocyanin Extraction Yields
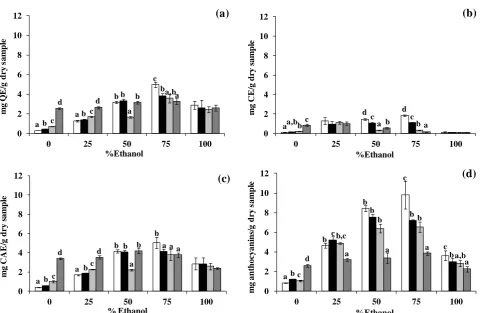
Figure 3 summarizes the results for the different phe- nolic compounds identified in the liquid extracts. As ob-
Figure 2. Total polyphenol content yield (mg of GAE/g dry sample, mean ± CI) at 2 hours and 25˚C with different pH and ethanol concentrations in the extracting media. , , and : pH = 2, pH = 5.33, pH = 8.66 and pH = 12, respectively; a, b, c and d, represent significant differences among groups (p < 0.05)
served with the total polyphenols, the results were sig- nificantly affected (p > 0.05) by both ethanol concentra- tion and pH of the extracting medium.
The extraction yields of flavonols, flavanols, phenolic acids and anthocyanins ranged from 0.03 - 4.98 mg QE, 0.09 - 1.83 mg CE, 0.39 - 5.02 mg CAE and 0.85 - 9.83 mg anthocyanins per g of dry sample, respectively. Among the total polyphenols extracted, more than 40% where from the anthocyanin group. Reference [4] studies on polyphenol extraction with water/ethanol mixtures got similar range of values for flavonols and phenolic acids, although slightly lower, and very lower for anthocyanins (almost tenfold less).
In general, all the compounds showed higher extrac- tion yields with higher concentrations of ethanol until 75%. This behaviour could be attributed to the change on polyphenol solubility, density or dielectric constant of the extracting liquid due to the presence of ethanol [20].
Phenolic acids and flavonols extraction (Figures 3(a)
and (c), respectively) showed similar values. Aqueous solutions (0% and 25% EtOH) get better yields when increasing pH, but higher concentration of ethanol, changed this trend and better yields were achieved with acid pH. Also, flavanols and anthocyanin extractions (Figures 3(b)
and (d), respectively) showed similar behaviour although this change was found at 25% EtOH.
3.4. Antioxidant Activity
Figure 4 illustrates the antioxidant activity of the liq- uid extracts. The analysis of variance found a significant effect (p < 0.05) of pH and ethanol concentration for all the extraction conditions.
0 5 10 15 20 25 30 35
0 25 50 75 100
m
g
G
A
E
/g
d
ry s
am
p
le
% Ethanol
a
a b
a a
c aa
b
b b a c
b b c
a
[image:4.595.311.535.83.256.2]Figure 3. Extraction yields at 2 hours and 25˚C at different pH and ethanol % in the extracting media: (a) flavonols; (b) flavanols; (c) phenolic acids and (d) anthocyanins (mean ± confidence interval). White, light grey, dark grey and black: pH = 2, pH = 5.33, pH = 8.66 and pH = 12, respectively; a, b c and d represent significant differences among groups (p < 0.05).
Figure 4. Antioxidant activity at 2 hours and 25˚C with diffe r-ent pH and ethanol % in the extracting media. , , and
: pH = 2, pH = 5.33, pH = 8.66 and pH = 12, respectively; a, b, c and d, represent significant differences among groups (p < 0.05).
The extracts from 75% EtOH had the highest antioxi- dant activity (12.95 - 15.63 µM Trolox/g dry sample) according to the highest polyphenol extraction (Figure 2). However little concordance was found in other
ex-tracts: 0% EtOH and pH 5.33 and 8.66 showed good antioxidant conditions (14.10 and 13.45 µM Trolox/g dry sample, respectively), although their concentration of po- lyphenols were not the highest. Previous works indicated the degree of correlation between antioxidant activity and polyphenol contents depends not only on the total polyphenol content, but also on the composition of ex- tracts [4].
Reference [6] recommended pH lower than 5 to pre- serve the antioxidant activity during storage with 60% EtOH. In general, this fact was in accordance with our results, with exception of 100% EtOH which increased their antioxidant activity at higher pH.
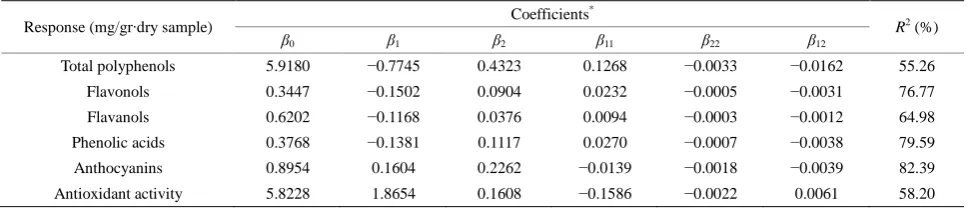
3.5. Response Surface Analysis
Table 1 summarizes the coefficients of the response surface equations and the goodness of fit with the para- meter R2. The values of R2 were not too high but were similar than those obtained by previous authors on the extraction of polyphenols from different vegetables [20, 24].
Among these results, the most adequate were for an- thocyanins (82.39%), phenolic acids (79.59%) and fla- vonols (76.77%). 0 2 4 6 8 10 12
0 25 50 75 100
m g Q E /g d ry s am p le %Ethanol a d b b d a c c
b b a,ba
b a b c
(a)
0 2 4 6 8 10 120 25 50 75 100
m g C A E /g d ry s am p le % Ethanol c a d
d b b
b b b c a a b aaa
(c)
0 2 4 6 8 10 120 25 50 75 100
m g C E /g d ry s am p le %Ethanol a c b c a a c d a,b d b b
(b)
0 2 4 6 8 10 120 25 50 75 100
m g an th oc yan in s/ g d ry s am p le %Ethanol a,b b,c a b a b c c d c b a b a b b c b a b
(d)
0 2 4 6 8 10 12 14 16 180 25 50 75 100
Table 1. Coefficients of the response surface equations.
Response (mg/gr∙dry sample) Coefficients *
R2 (%)
β0 β1 β2 β11 β22 β12
Total polyphenols 5.9180 −0.7745 0.4323 0.1268 −0.0033 −0.0162 55.26
Flavonols 0.3447 −0.1502 0.0904 0.0232 −0.0005 −0.0031 76.77
Flavanols 0.6202 −0.1168 0.0376 0.0094 −0.0003 −0.0012 64.98
Phenolic acids 0.3768 −0.1381 0.1117 0.0270 −0.0007 −0.0038 79.59
Anthocyanins 0.8954 0.1604 0.2262 −0.0139 −0.0018 −0.0039 82.39
Antioxidant activity 5.8228 1.8654 0.1608 −0.1586 −0.0022 0.0061 58.20
*
Subindexes: 0 = independent term; 1 = pH, lineal term; 2 = % ethanol, lineal term; 11 = pH, quadratic term; 22 = ethanol, quadratic term; 12 = pH*temperature, interaction term.
Response surface plots (not shown) exhibited the trends previously commented in this work. In general, extrac- tion yields increased with higher concentrations of etha- nol until 75% and, basic pH improved the extraction of aqueous samples (0% and 25% EtOH) while acid pH was better for ethanol concentrated samples.
4. CONCLUSIONS
This study reflects the importance of controlling the studied extraction conditions (time, pH, % ethanol) to obtain an extract with the highest polyphenol content and with an adequate antioxidant activity.
An extraction time of two hours was enough since longer time did not increase process yields. Best extrac- tion yields were obtained for 75% ethanol solutions. Ba- sic pH led to better yields in extracting media with low ethanol percentage, whereas acid pH presented better extraction yields in extracting media with high ethanol percentage. Among all the polyphenols extracted, antho- cyanins were the most abundant representing over 40% of the total. In general, the best process conditions were 2 h of extraction in a 75% EtOH liquid mixture at pH = 2.
5. ACKNOWLEDGEMENTS
The authors wish to acknowledge to the Enology Laboratory of the Institute of Food Engineering for Development-Polytechnic University of Valencia (Spain) for providing the grape marcs used in this work, and FOMESA for the financial support. Author Luis Mayor acknowl- edges JCI2009-04923 grant to MINECO (Spain).
REFERENCES
[1] FAO (2013) Faostat webpage.
[2] Hwang, J.Y., Shyu, Y.S. and Hsu, C.K. (2009) Grape wine lees improves the rheological and adds antioxidant properties to ice cream. LWT-FoodScienceand Technol-ogy, 42, 312-318.
[3] Hidalgo, J. (2003) Tratado de enología, tomos I y II. Mundiprensa, Madrid, Spain.
[4] Spigno, G. and De Faveri, D.M. (2007) Antioxidants
from grape stalks and marc: Influence of extraction pro- cedure on yield, purity and antioxidant power of the ex- tracts. JournalofFoodEngineering, 78, 793-801.
[5] Anastasiadis, M., Pratsinis, H., Kletsas, D., Skaltsounis, A.L. and Haroutounian, S.A. (2012) Grape stem extracts: Polyphenolic content and assessments of their in vitro an- tioxidant properties. LWT-FoodScienceandTechnology,
48, 316-322
[6] Amendola, D., De Faveria, D.M. and Spigno, G. (2010) Grape marc phenolics: Extraction kinetics, quality and stability of extracts. Journal of Food Engineering, 97, 384-392.
[7] Spigno, G., Tramelli, L. and De Faveri, D.M. (2007) Ef- fects of extraction time, temperature and solvent on con- centration and antioxidant activity of grape marc phenol- ics. JournalofFoodEngineering, 81, 200-208.
[8] Yilmaz, Y. and Toledo, R.T. (2004) Health aspects of functional grape seed constituents. TrendsinFoodScie- nceandTechnology, 15, 422-433.
[9] EFSA (2012) Scientific opinion on the re-evaluation of butylated hydroxytoluene BHT (E 321) as a food additive. EFSAJournal, 10, 2588 (43p).
[10] Bucić-Kojić, A., Planinić, M., Tomas, S., Bilić, M. and
Velić, D. (2006) Study of solid-liquid extraction kinetics of total polyphenols from grape seeds. Journal ofFood Engineering, 81, 236-242.
[11] Pinelo, M., Sineiro, J. and Núñez, M.J. (2006) Mass transfer during continuous solid-liquid extraction of anti- oxidant from grape by-products. Journal ofFoodEngi- neering, 77, 57-63.
[12] Makris, D.P., Boskou, G. and Andrikopoulos, N.K. (2007) Polyphenolic content and in vitro antioxidant characteris- tics of wine industry and other agri-food solid waste ex- tracts. Journal of Food Composition and Analysis, 20,
125-1
[13] Metivier, R.P., Francis, F.J. and Clydesdale, F.M. (1980) Solvent extraction of anthocyanins from wine pomace. JournalofFoodScience, 45, 1099-1100.
[14] Vatai, T., Skerget, M. and Knez, Z. (2009) Extraction of phenolic compounds from elder berry and different grape marc varieties using organic solvents and/or supercritical carbon dioxide. Journal ofFood Engineering, 90, 246-
254
[15] Geselma, W.J., Deligny, C.L. and Blijleve, H.A. (1967) PH measurements in alcohol water mixtures. On use of standard buffer solutions for calibration. Recueil des TravauxChimiquesdesPays-Bas, 86, 852-859.
[16] Bates, R.G., Baabo, R.G. and Robinson, R.A. (1963) Interpretation of pH measurements in alcohol-water sol- vents. JournalofPhysicalChemistry, 67, 1833-1838.
[17] Montgomery, D.C. (2005) Design and analysis of expe- riments. 6th Edition, John Wiley & Sons, Inc., New Jer- sey.
[18] Arnous, A., Makris, D.P. and Kefalas, P. (2001) Effects of principal polyphenolics components in relation to anti- oxidant characteristics of aged red wines. Journal of AgriculturalandFoodChemistry, 49, 5736-5742.
[19] Poudel, P.R., Tamura, H., Kataoka, I. and Mochioka, R. (2008) Phenolic compounds and antioxidant activities of skins and seeds of five wild grapes and two hybrids na-
tive to Japan. JournalofFoodCompositionandAnalysis,
21, 622-625
[20] Cacace, J.E. and Mazza. G. (2003) Optimization of ex- traction of anthocyanins from black currants with aqueous ethanol. JournalofFoodScience, 68, 240-248.
[21] Ribéreau-Gayon, P. (1982) The anthocyanins of grapes and wines. In: Markakis, P., Ed., Anthocyaninsas Food Colors, Academic Press, New York, 209-244.
[22] Sánchez M., Sineiro, J. and Núñez, M.J. (2008) Extrac- tion of polyphenols from white distilled grape pomace: Optimization and modeling. BioresourceTechnology, 99, 1311-1318.
[23] Sant’Anna, V., Brandelli, A., Marczak, L.D.F. and Tessaro, I.C. (2012) Kinetic modeling of total polyphenol extrac- tion from grape marc and characterization of the extracts. SeparationandPurificationTechnology, 100, 82-87.
[24] Karvela, E., Makris, D.P., Kalogeropoulos, N., Karatha- nos, V.T. and Kefalas, P. (2009) Factorial design optimi- zation of grape (Vitis vinífera) seed polyphenol extraction. EuropeanFoodResearchandTechnology, 229, 731-742.