http://dx.doi.org/10.4236/jamp.2016.45104
Application of Linear Programming Model
to Refugee Migrating Problem
Chongyu Jiang, Xiaorong Li, Yandong Li
School of Information, Beijing Wuzi University, Beijing, China
Received 12 April 2016; accepted 28 May 2016; published 31 May 2016
Copyright © 2016 by authors and Scientific Research Publishing Inc.
This work is licensed under the Creative Commons Attribution International License (CC BY). http://creativecommons.org/licenses/by/4.0/
Abstract
The refugee immigration problem can be considered as a special “transportation problem”. Linear Programming Model is built, where two objectives with weight in the objective function, for the shortest routes that the refugees go along and the minimum number of refugees stayed in each country. An example of EU is introduced and calculated on Lingo software. The results show that the model is available to solve the refugee immigration problem in different scale.
Keywords
Refugee, Linear Programming Model, Optimal Solution
1. Introduction
European governments and the United Nations. In 2015, about 1.08 million refugees applied for asylum in Eu-rope, Germany received 420 thousand asylum applications which were the most. Sweden is the country with the most asylum applications according to the proportion of population, every 1000 Swedish will take nearly 8 asylum applications [3].
To abstract and solve the problem, mathematic model should be build based on the information of the refugee problem shown above. Due to this, the flow network of refugees is studied and shown in Figure 1.
From the topology of the problem, the refugees migrating can be considered as a special transportation prob-lem. The refugees’ origin countries can be seen as the “origin” in the transshipment problem, and the asylum countries are considered as “marketing”. The transportation problem which was firstly studied by Hitchcock F. L. in 1941 [4] had been concerned many years. A method for solving the minimum cost transportation problem with time limited was provided by Li et al. [5][6]. Zeng [7] made the demand, delivery price and supply quan-tity as interregional number for the uncertainty. Han [8] transferred the transportation problem to a kind of linear integer programming and proved it theoretically. Hu [9] introduced and modeled satisfaction optimization transportation problem in order to maximize the relative equalities among the members. Wu [10] discussed the multi-objective fuzzy transportation problem with three types of transshipment. Rani [11] proposed a method to solve the fully fuzzy unbalanced transportation problem in which the total availability production was more than the total demand. Aizemberg [12] proposed a column generation-based heuristic to find good feasible solutions of a crude oil transportation problem by tankers. Zhenping Li [14] studied the problem of how to arrange the transportation plan in order to minimize the total cost when the total volume of supply was insufficient. Howev-er, the refugees migrating is different from the traditional transportation problem for its multiple transshipment, so we aim to build a model that can roughly arrange the refugees in Middle Eastern safety and effectively to the most extent.
In this paper, the refugees migrating problem is studied. A mathematical model to minimize the mortality and the spending time of the refugee on the way is established, and relational simulation is done on an example. The remainder of this paper is organized as follows. Section 2 discusses factors influencing refugee flows. Section 3 describes the problem and formulates it into a mathematical model. The simulation on an example is given in Section 5. Section 5 contains the conclusions of this work.
2. Factors Influencing Refugee Flows
Refugee flow is influenced by many factors. They need a relatively safe place, so the Europe becomes an ideal choice because of their steady political situation. And European countries are not allowed to accept admissions of refugees without planning. The number of refugee percentage of the population is used to measure refugee crisis by many countries. Therefore, the entry of refugees will exist certain restrictions according to their own national conditions. However, not all asylum applications will be approved successfully. For European countries, refugees will occupy the food, health care, housing and other resources. It means that the part of the tax will be consumed. With concerns of culture and safety, the inhabitants of the country will affect the refugee policy
The Middle East
Refugees in the country
[image:2.595.184.444.535.708.2]Resettled refugees
[13]. As a result, the European countries will make a compromise settlement plan to limit the number of asylum seekers. At the same time, the refugees in the process of wandering in the absence of safety and health protec-tion, thus the probability of death will be relatively high, which will affect the number of dynamic refugees. In addition, the means of transportation and walking distance are important factors. In the absence of other organi-zations’ assistance, the refugees are allowed to choose walk only and cannot take the plane or direct train went to non-neighbors. The helpless refugees tend to choose the nearest country as next destination. Therefore, whether the national border and distance should be considered as a parameter.
3. The Multiple-Goal Linear Programming Model of Refugee Problem
3.1. Problem Description
As is shown in Figure 1, the refugees migrating can be considered as the linear programming, namely a special transportation problem. The refugees’ origin countries can be seen as the “origin” in the transshipment problem, and the asylum countries are considered as “marketing”.
In this process we mainly consider the mortality of refugees on the way and the maximum refugees that the asylum countries can accept. Our goal is to decrease the mortality and the spending time of the refugee on the way. In addition, we lead into the reachable matrix to express whether the two countries are on the border. If it is yes, “1” indicates in the table, otherwise, “0” indicated.
Before presenting the mathematical model, some necessary assumptions should be defined.
3.2. Assumptions and Symbols
3.2.1. Assumptions
Before presenting the mathematical model, some necessary assumptions should be defined.
• All refugees start from the Middle East.
• Refugees immigrants in European countries need to submit an application, if the application is approved successfully, then they have the right to stay in the country. On the contrary, if the application is not ap-proved successfully, the refugees have no choice but leave for the next neighboring countries until get an approved application.
• The number of refugee in every period of a year is equal.
• A year is divided into twelve periods. In every period, the refugees just migrate from one country to another, and they only have one chance to migrate to another country.
• Once the refugee reach to the Europe, they have to take the way on land to migrate.
3.2.2. Symbols
Before presenting the mathematical model, the following set of indices and parameters are defined.
(
,)
G V S : directed graph where V =
{
v v1, 2,,vn}
the set of country nodes and S is the set of arcs;t: set of time periods or months in a planning horizon or a year (t=0,1, 2,,T); ij
d : distance from country i to j, and dij∈D;
ij
a : access from country i to j, equals to 1 when routes to country nodes j from i are available, 0 otherwise;
ij
r : rate of death for refugees move from country node i to j;
U : the total number of the refugees from the Middle East in a planning horizon or a year, where Ut is the total number of the refugees in time period t;
i
Q: maximum number of the refugees can be allowed to cross the border of country i;
i
p : maximum number of the refugees whose asylum requests granted by country nodes i per time period or month;
i
α : resources coefficient of each country;
β: policy coefficient of each country.
The variables that need to be determined are as follows:
it
y : the number of the refugees whose asylum requests granted by country i in time period or month t.
it
Y : the number of the refugees crossing the border of country i; 1
ijt
x : the number of the refugees departing country i to j; 2
ijt
3.3. The Multiple-GoalLinear Programming Model The multiple-goal linear programming model is presented below:
(
1 2)
0 min
2 ijt ijt ij
i V j V j i t T t
x x d ∈ ∈ ≠ ∈ ≠ +
∑ ∑ ∑
(1)(
1 2)
1
min ijt ijt
i V j V j i t T t
x x
∈ ∈ ≠ ∈ ≠
−
∑ ∑ ∑
. (2)
Subject to:
1
0 0
ij
x = (3)
1 1jt t j V j i
x U ∈ ≠ =
∑
(4)(
)
2 1 1ijt ijt ijt
x = −r x (5)
1
, 1 , 1
ijt i t i t
j V j i
x Y − y −
∈ ≠ = −
∑
(6) 1 ijt ijx ≤a M (7)
2
ijt jt i V i j
x Y ∈ ≠ =
∑
(8) 1 k ik ti V t
Y U
∈ =
≤
∑
∑
(9)0≤Yit ≤αiQi (10)
0≤yit ≤α βi ipi (11)
t t T
U U
∈
=
∑
(12)1 2
0, 0 1, 0, 0, 0
ij ij ijt ijt t
d ≥ ≤ ≤r x ≥ x ≥ U ≥ . (13)
The objective function (1) is to minimize the travel time, (2) is to minimize the number of death among all the refugees. Constraints (3) are the variable initialization. Constraints (4) ensues that all the refugees in the Middle East depart successfully. Constraints (5) determine the death in the flows of refugees. Constraints (6) (7) and (8) impose the refugees whose asylum requests are not be approved, and have to leave the current country to anoth-er available country. Constraints (9) restrict the total numbanoth-er of the refugees in Europe, and the numbanoth-er of the refugees crossing in current country, and refugees resettled are limited by Constraints (10) and (11). Constraints (12) define the scale of the refugees and constraints (13) ensure the range of parameters and variables.
In the linear programming model, every route has the same rate of death in the constraints, and refugees are assumed only can travel between countries by land transportation. In our paper, we use the adjacent matrix to limit the access of two country nodes.
To solve the problem facially, the two objective functions are combined as:
(
1 2)
(
)
1 2 1 2 0 0 min 2 ijt ijt
ij ijt ijt
i V j V j i t T t i V j V j i t T t
x x
d x x
ω ω ∈ ∈ ≠ ∈ ≠ ∈ ∈ ≠ ∈ ≠ + + −
∑ ∑ ∑
∑ ∑ ∑
. (14)
The coefficient ω1 and ω2 represent the importance of efficiency and safety of the flows.
4. Results and Discussion
4.1. Source of Data
In Figure 2, we can see EU minister voted by a majority to relocate refugees UN-wide in September 2015. We estimate the number of migrants EU member states are being asked to take, and we assume that the number of refugee in each month is equal. So we use the number multiplied by twelve and got the number of the EU countries in 2015. Beside this, we also have to adjust some of the number. For example, UK has opted out, Irel-and has offered to take 4000, Denmark will take 1000, Irel-and SwitzerlIrel-and Irel-and Norway have also agreed to take refugee, number yet to be agreed.
Figure 3 shows that some part of countries accepted asylum applications per 100,000 local population in 2015. The massive refugees each country plan to accept is through combined the information in the two above pictures. There are eight countries (Norway, Switzerland, Denmark, Italy, Iceland, Greece, Ireland, United Kingdom) accepted asylum applications but the EU minister did not relocate refugees for different reasons, these countries are assumed that they can accepted the refugees who submitted the asylum applications. There are also eight countries (Croatia, Slovakia, Slovenia, Spain, Czech Republic, Poland, Romania, Portugal) did not accept the asylum applications in 2015, but the EU minister relocate refugees in there. We consider these coun-tries accept the refugees and we assume the refugees will does not mind. After the above date statistics, the maximum capacity of the European countries is shown in Table 1 although some of these are not EU countries.
There are six routes will be selected by the refugees. Three of these routes pass the Mediterranean. They are western Mediterranean, central Mediterranean and eastern Mediterranean. However, each route has different le-vels of safety and accessibility, with the most popular route being Eastern Mediterranean, and the most danger-ous is Central Mediterranean. According to the statistical date by IOM (International Organization for Migra-tion), the mortality of the routes cross Mediterranean is shown in Table 2.
Besides, three road routes are from the western Balkan Mountains, the eastern boundary of Albania, and fi-nally reach to Greece. We use the normal mortality instead the death on land routes. In addition, after the refu-gees arrived in Europe, the mortality is not considered particularly, because there is no clearly difference in Eu-rope unlike crossing the Mediterranean, so we set a confirm mortality on the EuEu-rope land in our model.
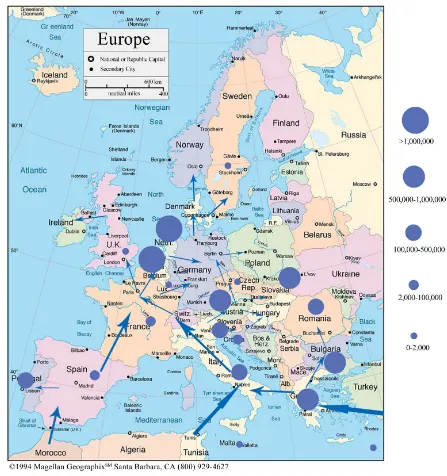
[image:5.595.165.464.426.674.2]We measure the straight line distance between the capital of any two countries in the Europe from the map, and the distance is regarded as the distance which the refugees may go through. The distance is the base on the model’s objective function.
Table 1. The maximum capacity of the European countries [1].
Country Capacity Country Capacity Sweden 28800 Italy 6800 Hungary 26400 Iceland 3840 Austria 27600 Greece 8000 Norway 31200 France 156000 Finland 26400 Ireland 48000 Germany 204000 United Kingdom 27600 Switzerland 30000 Croatia 9600
Belgium 30000 Slovakia 9600 Denmark 12000 Slovenia 6000 Malta 1200 Spain 96000 Luxembourg 2400 Czech Republic 21600 Netherlands 50400 Poland 62400 Bulgaria 12000 Romania 30000 Cyprus 6000 Portugal 24000
Total 997840
Figure 3. Asylum applications per 100,000 local people population 2015 [3]. 4.2. Simulation Results
Clearly, the model is a linear Programming problem with 20,996 variables and 22,496 constraints because of the set of time periods or months in a planning horizon or a year. Lots of polynomial algorithms were introduced to solve the problem, such as simplex method and interior point methods. Nevertheless, due to the huge number of variables and constraints, we compile a program by LINGO to solve.
The problem solution could be obtained by LINGO within 20 seconds, and the result of analogue computation is shown in Table 3 and Figure 4. The amount of the refugees could be got from Table 3, and the route of ref-ugees’ movement could be seen in Figure 4.
4.3. Discussion
[image:6.595.134.496.111.541.2]Table 2. The mortality of three routes in 2015 [2].
Mediterranean
route Summery Arrival Death Mortality Western 3945 3845 100 0.025348542
Central 153,206 150,317 2889 0.018856964
Eastern 802,625 801,919 706 0.000879614
Figure 4. Result of analogue computation.
Table 3. Result of analogue computation.
Country Current number of refugees
Cumulative number of
refugees resettled Population [6]
Current number of refugees/population
Sweden 0 0 9,141,187 0.0000%
Hungary 0 11,264 9,832,087 0.0000%
Austria 143,863 14,720 8,671,043 1.6320%
Norway 0 0 5,192,976 0.0000%
Finland 0 0 5,490,913 0.0000%
Germany 0 21,760 81,132,173 0.0000%
Switzerland 0 11,200 7,695,720 0.0000%
Belgium 0 0 11,270,107 0.0000%
Denmark 0 0 5,662,123 0.0000%
Malta 0 448 431,250 0.0000%
Luxembourg 0 0 568,863 0.0000%
Netherlands 0 0 16,904,745 0.0000%
Bulgaria 208,217 7040 7,180,594 2.8180%
Cyprus 0 3200 1,165,194 0.0000%
Italy 0 9856 1,174,423 0.0000%
Iceland 0 0 331,520 0.0000%
Greece 78,429 61,440 10,891,993 0.7149%
France 0 33,280 64,677,753 0.0000%
Ireland 0 0 4,626,557 0.0000%
United Kingdom 0 0 64,897,438 0.0000%
Croatia 512 5120 4,330,573 0.0118%
Slovakia 168,261 4608 5,422,908 3.0094%
Slovenia 320 3200 2,049,080 0.0156%
Spain 0 0 47,263,733 0.0000%
Czech Republic 0 6912 10,480,761 0.0000%
Poland 0 0 38,477,597 0.0000%
Romania 141,264 16,000 19,956,065 0.7029%
Portugal 0 0 10,568,339 0.0000%
[image:8.595.83.537.101.638.2]Total 740,866 210,048
Table 4. Result of analogue computation a larger scale.
Country Current number of refugees
Cumulative number of
refugees resettled Population [6]
Current number of refugees/population
Sweden 0 7680 9,141,187 0.0000%
Continued
Austria 961,568 16,192 8,671,043 9.9824%
Norway 0 8320 5,192,976 0.0000%
Finland 0 0 5,490,913 0.0000%
Germany 0 87,040 81,132,173 0.0000%
Switzerland 1600 17,600 7,695,720 0.0208%
Belgium 2,246,771 16,000 11,270,107 16.6220%
Denmark 0 4480 5,662,123 0.0000%
Malta 64 704 431,250 0.0148%
Luxembourg 128 1280 568,863 0.0225%
Netherlands 2,101,903 26,880 1,6904,745 11.0588%
Bulgaria 862,874 7040 7,180,594 10.7276%
Cyprus 320 3520 1,165,194 0.0275%
Italy 131,500 10,752 1,174,423 10.0695%
Iceland 0 0 331,520 0.0000%
Greece 570,000 61,440 10,891,993 4.9730%
France 23,770 91,520 64,677,753 0.0367%
Ireland 0 17,920 4,626,557 0.0000%
United Kingdom 1472 14,720 64,897,438 0.0023%
Croatia 96,000 5632 4,330,573 2.1687%
Slovakia 960,000 5120 5,422,908 15.0402%
Slovenia 224,405 3520 2,049,080 9.8705%
Spain 78,348 61,440 47,263,733 0.1655%
Czech Republic 1152 11,520 10,480,761 0.0110%
Poland 0 16,640 38,477,597 0.0000%
Romania 300,000 16,000 19,956,065 1.4810%
Portugal 180,000 14,080 10,568,339 1.6747%
Total 8,743,283 542,528
each country. Then Qit is increased ten times so that the results (Table 4 and Figure 5) can be obtained. Result in Table 4 shows that more refugees cross into the Europe and lead a vagrant life while only 6.2% are resettled. Meanwhile, Slovakia, Slovenia, Italy, Bulgaria, Netherlands, Belgium, Austria, Greece, Portugal and Romania occur serious refugee crisis. Time to resettle the refugees would be prolonged largely which might cause more death and insecurity like crime and riot. Therefore, facing this problem, countries should add the asylum scheme or seek help for countries of other continent as more as possible.
5. Conclusion
Figure 5. Result of analogue computation a larger scale.
software. The results show that the model is available to solve the refugee immigration problem in different scale.
References
[1] The UN Refugee Agency (2014) Statistical Yearbook: Table of Contents for the Excel Annex Tables.
[2] International Organization for Migration. Mediterranean Update: Migration Flows Europe: Arrivals and Fatalities. http://www.iom.int/
[3] BBC Europe. Migrant Crisis: Migration to Europe Explained in Seven Charts. http://www.bbc.com/news/world-europe-34131911
[5] Li, Z. (2001) The Transportation Problem of the Shortest Time Limit and Its Algorithm. Chinese Journal of Manage-ment Science, 9, 50-56.
[6] Li, Z., Xu, Q., Li, N. and Ma, Y. (2011) A Method for Solving the Minimum Cost Transportation Problem with Time Limited. Operations Research and Management Science, 20, 9-14.
[7] Zeng, J., Zhang, X., and Ye, J. (2008) An Interval Programming Model and Algorithm for Transportation Problem. Journal of Sichuan University of Science & Engineering (Natural Science Edition), 21, 30-32.
[8] Han, W. and Zhang, Q. (2008) Linear Integer Programming Model on Transportation Problem. Operations Research and Management Science, 17, 12-15.
[9] Hu, X. and Li, D. (2014) Satisfaction Optimization Transportation Problem. Operations Research Transactions, 18, 36-44.
[10] Wu, Z. (2013) Research on Two Types of the Fuzzy Transportation Problems. MS Thesis, Guangzhou University, Guangzhou.
[11] Rani, D., Gulati, T.R. and Kumar, A. (2014) A Method for Unbalanced Transportation Problems in Fuzzy Environment. Indian Academy of Sciences, 39, 573-581.
[12] Aizemberg, L., Kramer, H., Pessoa, A. and Uchoa, E. (2014) Formulations for a Problem of Petroleum Transportation. European Journal of Operational Research, 237, 82-90.
[13] Schmeidl, S. (2001) Conflict and Forced Migration: A Quantitative Review, 1964-1995. In: Zolberg, A. and Benda, P., Eds., Global Migrants, Global Refugees—Problems and Solutions, Bergham Books, New York, USA.

![Figure 2. Number of migrant EU member states are being asked to take [3].](https://thumb-us.123doks.com/thumbv2/123dok_us/7926377.748405/5.595.165.464.426.674/figure-number-migrant-eu-member-states-asked.webp)
![Table 1. The maximum capacity of the European countries [1].](https://thumb-us.123doks.com/thumbv2/123dok_us/7926377.748405/6.595.134.496.111.541/table-maximum-capacity-european-countries.webp)
![Table 2. The mortality of three routes in 2015 [2].](https://thumb-us.123doks.com/thumbv2/123dok_us/7926377.748405/7.595.91.536.87.658/table-mortality-routes.webp)