RESOLUTION LIMITS ON VISUAL SPEECH RECOGNITION
Helen L. Bear, Richard Harvey, Barry-John Theobald, Yuxuan Lan
School of Computing Sciences , University of East Anglia, Norwich, NR4 7TJ, UK.
[email protected], [email protected], [email protected], [email protected]
ABSTRACT
Visual-only speech recognition is dependent upon a number of factors that can be difficult to control, such as: lighting; identity; motion; emotion and expression. But some factors, such as video resolution are controllable, so it is surprising that there is not yet a systematic study of the effect of resolu-tion on lip-reading. Here we use a new data set, the Rosetta Raven data, to train and test recognizers so we can measure the affect of video resolution on recognition accuracy. We conclude that, contrary to common practice, resolution need not be that great for automatic lip-reading. However it is highly unlikely that automatic lip-reading can work reliably when the distance between the bottom of the lower lip and the top of the upper lip is less than four pixels at rest.
1. INTRODUCTION
A typical lip-reading system has a number of stages: first, the data are pre-processed and normalised; second, the face and lips are tracked; third, visual features are extracted and clas-sified. In practice many systems find tracking challenging, which affects the overall recognition performance. However, the tracking problem is not insurmountable and it is now re-alistic to track talking heads in outdoor scenes filmed with shaky hand-held cameras [2], so we focus on feature extrac-tion using Active Appearance Models (AAMs) [4]. We se-lect AAMs since they have been shown to have robust perfor-mance on a number of datasets ( [8, 9, 10, 11] for example) and out perform other feature types [6].
2. DATASET AND FEATURE EXTRACTION
An AAM is a combined model of shape and appearance trained to fit to a whole video sequence [4]. Training cre-ates a mean model and a set of modes, which may be varied to create shape and appearance changes. In training, a small number of frames are identified and manually landmarked. These models are Procrustes-aligned and the mean and co-variance of the shape are computed. The eigenvectors of the covariance matrix give a set of modes of variation, which are used to deform the mean shape. For appearance a mesh shape-normalizes the images via a piecewise affine transform so the
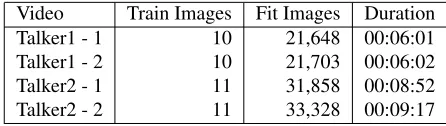
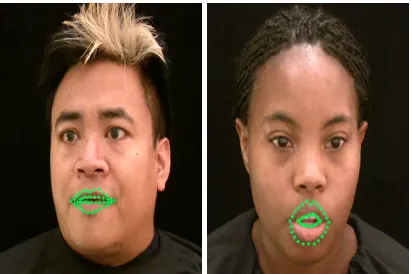
pixels of all images are aligned. We then compute the mean and the eigenvectors of their covariance. Concatenating the shape and appearance features forms the feature vector for training and testing. Having built a model on a few frames, it is fitted to unseen data using inverse compositional fitting [8]. The Rosetta Raven data are four videos of two North Amer-ican talkers (each talker in two videos), reciting Edgar Allen Poe’s ‘The Raven’. The poem was published in 1845 and, re-cited properly, the poem has trochaic octameter [13], but this does not appear to have been followed by the talkers in this dataset. Figure 3(a) shows example frames from the high-definition video of the two talkers. The database summarised
in Table 1 was recorded at1440×1080non-interlaced
reso-lution at 60 frames per second. The talkers wore no make-up.
Video Train Images Fit Images Duration
Talker1 - 1 10 21,648 00:06:01
Talker1 - 2 10 21,703 00:06:02
Talker2 - 1 11 31,858 00:08:52
[image:1.612.323.546.386.449.2]Talker2 - 2 11 33,328 00:09:17
Table 1: Frame images from each video
All four videos were converted into a set of images (one per frame) with ffmpeg using image2 encoding at full
high-definition resolution (1440×1080).
To build an initial model we select the first frame and nine or
ten others randomly. Thesekey framesare hand-labelled with
a model of a face and lips. This preliminary model is then fitted, via inverse compositional fitting [8] to the remaining frames (Table 1 lists total frames for each video). At this stage therefore we have tracked and fitted full face talker dependent AAMs on full resolution lossless PNG frame images as in Figure 1.
origi-Fig. 1: Showing full face mesh for talker T1 (left) and T2 (right)
nal (1440×1080) but contain far less information due to the
downsampling.
1440×1080 960×720 720×540 360×270
240×180 180×135 144×108 120×90
90×67 80×60 72×54 65×49
69×45 55×42 51×39 48×36
[image:2.612.75.279.71.199.2]45×34 42×32
Table 2: Resolutions
We are most interested in the affect of low resolution on the loss of lip-reading information rather than, say the affect it would also have on the tracker (many AAM trackers lose track quite easily at low resolutions and we do not wish to be overwhelmed with catastrophic errors due to tracking prob-lems which can often be solved in other ways [12]). Conse-quently the shape features in this experiment are unaffected by the downsample whereas as the appearance features vary (a useful benchmark as it will turn out).
Fig. 2: Showing lip-only mesh for talker T1 (left) and talker T2 (right)
For talker1 (T1), we retain 6 shape and 14 appearance eters and for talker2 (T2), 7 shape and 14 appearance param-eters. The number of parameters was chosen to retain 95% of
the variance in the usual way [4].
3. RECOGNITION METHOD
vID Phones vID Phones
v01 /p/ /b/ /m/ v10 /i/ /ih/
v02 /f/ /v/ v11 /eh/ /ae/ /ey/ /ay/
v03 /th /dh/ v12 /aa/ /ao/ /ah/
v04 /t/ /d/ /n/ /k/ /g/ /h/ /j/ v13 /uh/ /er/ /ax/
/ng/ /y/
v05 /s/ /z/ v14 /u/ /uw/
v06 /l/ v15 /oy/
v07 /r/ v16 /iy/ /hh/
v08 /sh/ /zh/ /ch/ /jh/ v17 /aw/ /ow/
[image:2.612.318.553.110.270.2]v09 /w/ v18 silence
Table 3: Phone to viseme mapping
To produce the ground truth we listen to each recitation of the poem and produced a ground truth text (some recitations of the poem were not word-perfect). This word transcript is con-verted to an American English phone level transcript using the CMU pronunciation dictionary [3]. However not all phones are visible on the lips, so we select a mapping from phones to
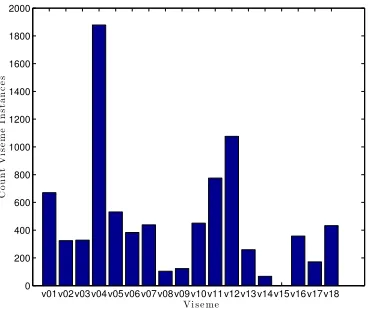
visemes(which are the visual equivalent of phonemes). Here, the viseme mapping is based upon Walden’s trained conso-nants [14] and Montgomery et al’s vowel [7] classifications as illustrated in Table 3. Viseme recognition is selected over phoneme recognition as, on a small data set, it has the bene-fits of reducing the number of classes needed (the model for each class forms a single recogniser) and increasing the train-ing data available for each viseme classifier. Note that not all visemes are equally represented in the data as is shown by the viseme counts in Figures 4 and 5.
For each talker, a test fold is randomly selected as 42 of the 108 lines in the poem. The remaining lines are used as training folds. Repeating this five times gives five-fold cross-validation. Visemes cannot be equally represented in all folds. For recognition we use Hidden Markov Models (HMMs) im-plemented in the Hidden Markov Toolkit (HTK) [15]. An HMM is initialised using the ‘flat start’ method using a pro-totype of five states and five mixture components and the in-formation in the training samples. We choose five states and five mixtures via [9]. We define an HMM for each viseme plus silence and short-pause labels (Table 3) and re-estimate the parameters four times with no pruning. We use the HTK
toolHHEdto tie together the short-pause and silence models
between states two and three before re-estimating the HMMs
a further two times. ThenHViteis used to force-align the
data using the word transcript1.
1We use the-mflag withHVitewith the manual creation of a viseme
[image:2.612.60.291.288.353.2] [image:2.612.74.280.503.640.2](a) (b) (c)
Fig. 3: (a)1440×1080-Original resolution image for T1 & T2, (b)60×45-T1 downsampled, and (c)1440×1080-T1 restored
v01 v02 v03 v04 v05 v06 v07 v08 v09 v10 v11 v12 v13 v14 v15 v16 v17 v18 0
200 400 600 800 1000 1200 1400 1600 1800 2000
C
o
u
n
t
V
i
s
e
m
e
I
n
s
t
a
n
c
e
s
V i s e m e
Fig. 4: Visemes present in both T1 videos
v01 v02 v03 v04 v05 v06 v07 v08 v09 v10 v11 v12 v13 v14 v15 v16 v17 v18 0
200 400 600 800 1000 1200 1400 1600 1800 2000
C
o
u
n
t
V
i
s
e
m
e
I
n
s
t
a
n
c
e
s
V i s e m e
Fig. 5: Visemes present in both T2 videos
The HMMs are now re-estimated twice more, however now we use the force-aligned viseme transcript rather than the original viseme transcript used in the previous HMM re-estimations. To complete recognition using our HMMs we
require a word network. We use HLStats and HBuild
to make both a Unigram Word-level Network (UWN) and a
Bi-gram Word-level Network (BWN). FinallyHViteis used
with the different network support for the recognition task and
HResultsgives us the correctness and accuracy values.
4. RESULTS
Recognition performance of the HMMs can be measured by
both correctness,C, and accuracy,A,
C=N−D−S
N , A=
N−D−S−I
N ,
whereSis the number of substitution errors,Dis the number
of deletion errors,Iis the number of insertion errors andN
[image:3.612.57.558.72.180.2]the total number of labels in the reference transcriptions [15]. We use accuracy as a measure rather than correctness since it accounts for all errors including insertion errors which are notoriously common in lip reading. An insertion error occurs when the recognizer output has extra words/visemes missing from the original transcript [15]. As an example one could say “Once upon a midnight dreary”, but the recognizer out-puts “Once upon upon midnight dreary dreary”. Here the rec-ognizer has inserted two words which were never present and it has deleted one.
Figure 6 shows the acurracy, A, versus resolution for an
UWN. Thex-axis is calibrated by the vertical height of the
lips of each talker in their rest position. For example, at the
maximum resolution of1440×1080talker T1 has a lip-height
of approximately 26 pixels in the rest position whereas T2 has a lip-height of approximately 17 pixels. The worst perfor-mance is from talker T2 using shape-only features. Note that the shape features do not vary with resolution so any variation in this curve is due to the cross-fold validation error (all folds do not contain all visemes equally). Nevertheless the varia-tion is within an error bar. The poor performance is, as usual with lip-reading, a standard error dominated by insertion
er-rors (hence the negative A values). The usual explanation
[image:3.612.84.271.231.387.2] [image:3.612.86.270.424.583.2]1 2 3 4 5 6 7 8 9 10 11 12 13 14 15 16 17 18 19 20 21 22 23 24 25 26 27 −100 −80 −60 −40 −20 0
R e s t i n g l i p p i x e l s
M e a n 5 -f o ld H T K A c c u r a c y %
T 2 S h ap e T 2 A p p e ar an c e T 1 S h ap e T 1 A p p e ar an c e
Fig. 6: Mean viseme recognition accuracy supported by UWN at 18 degraded resolutions shown by vertical resting
lip height in pixels. Error bars show±one standard error.
However it is the appearance that is of more interest since this varies as we downsample. At resolutions lower than four pixels it is difficult to be confident that the shape information is effective. However the basic problem is a very low error rate (shown in Figure 6) therefore we adopt a more supportive word model. 1 2 3 4 5 6 7 8 9 10 11 12 13 14 15 16 17 18 19 20 21 22 23 24 25 26 27 0 10 20 30 40 50 60 70 80
R e s t i n g l i p p i x e l s
M e a n 5 -f o ld H T K A c c u r a c y %
T 2 S h ap e T 2 A p p e ar an c e T 1 S h ap e T 1 A p p e ar an c e
0 1 2 30 40 50 0 1 2 20 30 40
Fig. 7: Mean viseme recognition accuracy supported by BWN at 18 degraded resolutions shown by vertical resting
[image:4.612.60.296.76.255.2]lip height in pixels. Error bars show±one standard error.
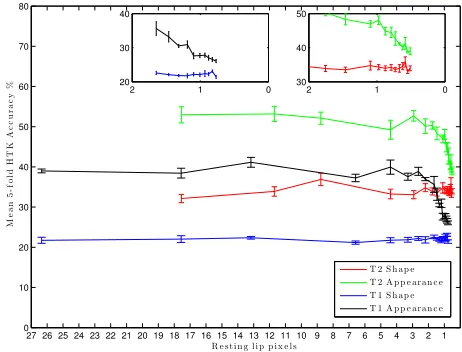
Figure 7 shows the recognition accuracy versus resolution
(represented by the samex-axis calibration in Figure 6) for
a BWN. It also includes two sub-plots which zoom the right-most part of the graph. Again the shape models perform worse than the appearance models but, looking at the zoomed
plots, appearance never becomes as poor as shape perfor-mance even at very low resolutions. As with the UWN ac-curacies, there is clear inflection point at around four pixels (two pixels per lip) and by two pixels the performance has declined noticeably.
Rest Talker 1 Talker 2
Pixels Ins Del Sub ins Del Sub
>4 69.8 667.0 259.6 114.2 467.8 284.6
[image:4.612.320.557.146.199.2]<4 61.0 729.2 271.0 106.0 464.4 300.0
[image:4.612.64.295.419.595.2]Table 4: Error rates for insertions, deletions and substitutions where the pixels are more than four covering the lips at rest (where recognition is still reliable), and less than four pix-els where recognition performance falls. Values are averaged over all five folds.
Table 4 shows the deletion, insertion and substitution error rates for the recognition performance of resolutions which are just above and below the four pixels at rest. We see that the insertion errors are significantly lower than both deletions and substitutions so we are confident that our accuracy scores are accurate insertions despite negative accuracy scores be-ing achieved with the Unigram Word Network support in Fig-ure 6.
5. CONCLUSIONS
We have shown that the performance of simple visual speech recognizers has a threshold effect with resolution. For suc-cessful lip-reading one needs a minimum four pixels across the closed lips. However the surprising result is the remark-able resilience that computer lip-reading shows to resolution. Given that modern experiments in lip-reading usually take place with high-resolution video ([16] and [1] for example) the disparity between measured performance (shown here) and assumed performance is very striking.
Of course higher resolution may be beneficial for tracking but, in previous work we have been able to show other factors be-lieved to be highly detrimental to lip-reading such as off-axis views [5] actually have the ability to improve performance rather than degrade it. We have also noted that previous shib-boleths of outdoor video, poor lighting and agile motion af-fecting performance can all be overcome [1]. It seems that in lip-reading it is better to trust the data than conventional wisdom.
6. ACKNOWLEDGEMENTS
7. REFERENCES
[1] R. Bowden, S. Cox, R. Harvey, Y. Lan, E.-J. Ong,
G. Owen, and B.-J. Theobald. Recent developments
in automated lip-reading. InSPIE Security+ Defence,
pages 89010J–89010J. International Society for Optics and Photonics, 2013.
[2] R. Bowden, S. J. Cox, R. W. Harvey, Y. Lan, E.-J. Ong, G. Owen, and B. Theobald. Is automated conversion of video to text a reality? In C. Lewis and D. Burgess,
edi-tors,Optics and Photonics for Counterterrorism, Crime
Fighting, and Defence VIII, volume SPIE 8546, pages 85460U–85460U–9. SPIE, 2012.
[3] Carnegie Mellon University. CMU pronounciation dic-tionary, 2008.
[4] T. Cootes, G. Edwards, and C. Taylor. Active
ap-pearance models. Pattern Analysis and Machine
In-telligence, IEEE Transactions on, 23(6):681 –685, Jun 2001.
[5] Y. Lan, B.-J. Theobald, and R. Harvey. View
inde-pendent computer lip-reading. InMultimedia and Expo
(ICME), 2012 IEEE International Conference on, pages 432–437. IEEE, 2012.
[6] Y. Lan, B.-J. Theobald, R. Harvey, E.-J. Ong, and R. Bowden. Improving visual features for lip-reading. In
Proceedings of International Conference on Auditory-Visual Speech Processing, volume 201, 2010.
[7] D. Massaro. Perceiving Talking Faces. The MIT Press,
1998.
[8] I. Matthews and S. Baker. Active appearance models
revisited. International Journal of Computer Vision,
60(2):135–164, 2004.
[9] I. Matthews, T. Cootes, J. Bangham, S. Cox, and R.
Har-vey. Extraction of visual features for lipreading.Pattern
Analysis and Machine Intelligence, IEEE Transactions
on, 24(2):198 –213, feb 2002.
[10] E. Ong and R. Bowden. Robust lip-tracking using
rigid flocks of selected linear predictors. In 8th IEEE
Int. Conf. on Automatic Face and Gesture Recognition (FG2008), pages 247–254, 2008.
[11] E. Ong, Y. Lan, B. Theobald, R. Harvey, and R. Bow-den. Robust facial feature tracking using selected
multi-resolution linear predictors. InComputer Vision, 2009
IEEE 12th International Conference on, pages 1483– 1490. IEEE, 2009.
[12] E.-J. Ong, Y. Lan, B. Theobald, R. Harvey, and R. Bow-den. Robust facial feature tracking using selected
multi-resolution linear predictors. InComputer Vision, 2009
IEEE 12th International Conference on, pages 1483– 1490, Sept 2009.
[13] P. F. Quinn. The critical mind of Edgar Poe: Claude
Richard. Edgar Allan Poe: Journaliste et critique. Poe
Studies-Old Series, 13(2):37–40, 1980.
[14] B. E. Walden, R. A. Prosek, A. A. Montgomery, C. K. Scherr, and C. J. Jones. Effects of training on the visual
recognition of consonants.Journal of Speech, Language
and Hearing Research, 20(1):130, 1977.
[15] S. Young, G. Evermann, M. Gales, T. Hain, D. Kershaw, X. A. Liu, G. Moore, J. Odell, D. Ollason, D. Povey,
V. Valtchec, and P. Woodland. The HTK Book (for HTK
Version 3.4). Cambridge University Engineering De-partment, 2006.
[16] Z. Zhou, X. Hong, G. Zhao, and M. Pietik¨ainen. A com-pact representation of visual speech data using latent
variables. Pattern Analysis and Machine Intelligence,