2504
AN ALGORITHM TO ESTIMATE OBSTACLE DISTANCE
FOR ASSISTIVE SYSTEM OF VISUALLY IMPAIRED
1POOJA GUNDEWAR, 2SANIKA PATANKAR, 3HEMANT ABHYANKAR, 4JAYANT
KULKARNI
1Vishwarkama Institute of Technology, Pune, India
2Vishwarkama Institute of Technology, Pune, India
3KJ’s Educational Institute, Pune, India
4Vishwarkama Institute of Technology, Pune, India
ABSTRACT
For safe navigation of visually impaired, an assistive system that can estimate the distance between visually impaired and obstacle and can intimate the user is needed. Estimation of the distance between an obstacle and visually impaired (user) is challenging due to artifacts in the real environment such as variation in speed of obstacle and non-uniform illumination conditions. This paper presents a novel algorithm to estimate the distance of an obstacle from the user using Speeded Up Robust Features (SURF). Instead of traditional distance measurement sensors, SURF features are used for distance measurement of an obstacle from visually impaired. The input video frames are preprocessed, and correction for non-uniform illumination is applied. The dominant points in each input video frame are located. The correspondence between the dominant points in successive frames is derived. For a typical camera, the average magnitude of SURF features is a linear function of a distance between the user and the obstacle. This function is used to estimate the distance between obstacle and user. The proposed algorithm is tested on videos recorded in a dynamic environment. For videos captured with Microsoft webcam, an average % error for distance estimation is 1.31%, and for speed, estimation is 4.18%. For videos captured with an Iball camera, the average % error for distance estimation is 2.134%, and for speed, estimation is 0.399%. The performance of the proposed algorithm is compared with existing techniques on the basis of an error in distance estimation, standard deviation, space complexity, and time complexity.
Keywords: Visually Impaired, Assistive System, Distance Estimation, Speeded Up Robust Features, Feature Matching.
1. INTRODUCTION
Human beings can extract and investigate the information of the real world from visual input. During navigation, the information is being used for ease of environment access. For a normal person, the navigation in a familiar or unfamiliar environment becomes hassle-free as he can avoid the obstacle in the path by taking the appropriate decision and can reach the destination safely.
ISSN: 1992-8645 www.jatit.org E-ISSN: 1817-3195
2505 The proposed system will allow visually impaired to navigate in a dynamic environment independently by informing the distance of the obstacle from visually impaired. It will provide an alert signal to the visually impaired for decision making. This work mainly focuses on distance measurement of moving obstacle/pedestrian coming towards visually impaired. This work focuses on the development of an algorithm to estimate the distance between the obstacle and visually impaired (user) using a single camera mounted at an appropriate location using SURF features. For a typical camera, the average magnitude of SURF features computed around matched dominant points of successive frames is a linear function of a distance between camera and obstacle. The proposed algorithm is tested on the videos captured using two cameras with different specifications. The proposed technique is free from signal interference and noise which are inherent in existing techniques. Also, the memory requirement and computational complexity are less as compared with the system using a stereo camera. The feature descriptor used in the proposed algorithm is compared with SIFT descriptor on the basis of space complexity and time complexity. Also, the other methods based on active sensors like ultrasonic, infrared and laser are compared on the basis of accuracy. The paper is organized into five sections. Section 2 presents a brief review of existing methods. The proposed algorithm is elaborated in Section 3. Experimentation and results are shown in Section 4. Conclusions are discussed in Section 5.
2. RELATED WORK
It is possible to identify the location of an object in three-dimensional space by using two cameras known as stereo cameras. The software can determine the location of an object by taking inputs from two cameras separated by a finite distance. The depth of the object is inversely proportional to the disparity. The disparity is the distance between two corresponding points in the left and right images of the stereo camera [1]. The dense disparity map is used to detect potential obstacles in indoor and outdoor scenes. RANSAC algorithm is used to find ground plane truth to get the location of obstacles [3]. The dense disparity map is also generated using spline and genetic algorithm [4]. It is proven that the dense disparity maps extracted from stereo camera result in inconsistency during navigation and it fails to find out an appropriate waypoint and safe path, so RGB-D cameras are used for indoor navigation [5]. RGB-D cameras
2506 detection for visually impaired in navigating indoor environments is developed [20]. It computes optical flow and tracks the obstacles. A context-aware data fusion technique for the sensors is used to determine the frame rate of the video stream on smartphones. A real-time system [21] detects both static/dynamic objects in a video stream. The interest points which are the pixels located in a cell's center of the image are selected based on image-grid. The Lucas-Kanade algorithm tracks these selected points. The RANSAC algorithm is applied to these points reclusively to detect the background motion. A System based on the SIFT algorithm is described [22] to store the map of the path and SIFT features are used to track the path during navigation of visually impaired. The algorithm for obstacle detection in indoor navigation is proposed [23] for pre-stored floor images, and the acquired floor image is compared with pre-stored images and mean square error of two frames is calculated. Zero mean square error indicates no obstacle on the floor. A novel approach based on SIFT (the Scale Invariant Feature Transform) is used to estimate the depths of objects in two images captured by an un-calibrated camera. Objects in the images are matched using SIFT feature extraction. Lastly, an object’s depth is calculated by the lengths of a pair of straight-line segments [24].
Our work focuses on the development of an algorithm to estimate the distance between the obstacle and visually impaired (user) using a single camera mounted at an appropriate location using SURF features. For a typical camera, the average magnitude of SURF features computed around matched dominant points of successive frames is a linear function of the distance between camera and obstacle. The main difference between existing methods for distance estimation and the proposed method is that the proposed technique does not make use of an ultrasonic sensor or LASER to compute the distance. The proposed method uses features of an obstacle for distance measurement. The existing methods use obstacle features for detecting obstacle only, these features are not used for distance measurement. The proposed algorithm uses the video frames captured by a camera suitably mounted by the user. The proposed technique is free from signal interference and noise which are inherent in existing techniques. Existing methods based on disparity map using stereo cameras require more memory as well as increased computational time as compared to the proposed method. The proposed method uses a single camera
to estimate the distance of the obstacle from the user.
3. PROPOSED METHODOLOGY
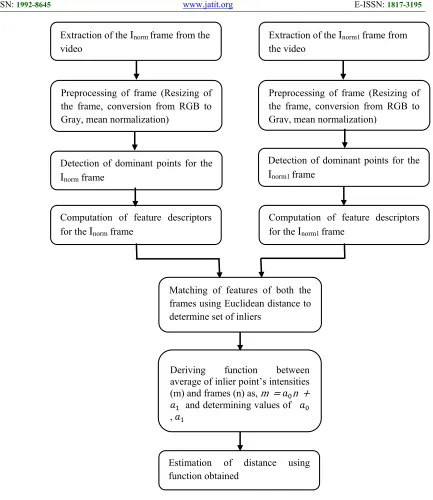
This paper presents a technique for estimation of the distance between obstacle and user using Speeded Up Robust Features (SURF). Figure 1 presents a flow chart of the proposed algorithm. Initially, the frames of the videos captured under uncontrolled environments provide inputs to this algorithm and frames are preprocessed which includes resizing and applying the correction for non-uniform illumination using mean normalization. For every pair of successive input frames, the dominant points on the moving obstacle are detected and matched using SURF. For a typical camera, the average magnitude of SURF features computed around matched dominant points is a linear function of the distance between obstacle and user. The stages of the algorithm are elaborated in detail in the following subsections.
3.1 Preprocessing
As the input videos are captured under the unconstrained environment, the preprocessing of each frame is necessary. Initially, the frame is converted to size n x n. Further, the color image is converted to an 8-bit gray scale image for further processing [25, 26]. For the given image 𝐼 𝑥, 𝑦 , the gray scale image is obtained as Equation (1),
𝐼 𝑥, 𝑦 0.2989𝐼 𝑥, 𝑦 0.5870𝐼 𝑥, 𝑦 0.1140𝐼 𝑥, 𝑦 (1)
where
𝐼 𝑥, 𝑦 = Output 8 bit gray scale image
𝐼 𝑥, 𝑦 = Red channel input image 𝐼 𝑥, 𝑦 = Green channel input image 𝐼 𝑥, 𝑦 = Blue channel input image
Due to non-uniform illumination present in the input image, correction for the same is applied. Non-uniform illumination is corrected by applying normalization [27]. For the gray scale image obtained from Equation (1), mean normalized image I 𝑥, 𝑦 is obtained as in Equation (2),
ISSN: 1992-8645 www.jatit.org E-ISSN: 1817-3195
[image:4.612.98.531.74.574.2]2507
Figure 1: Flowchart Of The Proposed Method
where MinI 𝑥, 𝑦 , MaxI 𝑥, 𝑦 and
𝑀𝑒𝑎𝑛𝐼 𝑥, 𝑦 are minimum, maximum and mean intensity values of gray scale image 𝐼 𝑥, 𝑦 . The normalized image is converted to an 8-bit image.
3.2 Detection of Dominant Points
Feature points of consecutive frames, i.e., Inorm and Inorm1 frame are detected using the SURF
algorithm. It is Speeded up robust feature algorithm
[28] based on the multiscale analysis. The detection of features in SURF is based on scale-space representation. The scale-space theory is used to handle the image structure at different scales. Scale-space representation is parameterized by the size of the smoothing kernel. It is known as scale parameter σ. SURF uses first and second-order differential operators. These operations are speeded up by the use of box filter techniques [29]. The box filters are evaluated using integral images. Integral Estimation of distance using
function obtained
Matching of features of both the frames using Euclidean distance to determine set of inliers
Deriving function between average of inlier point’s intensities (m) and frames (n) as, m 𝑎 n 𝑎 and determining values of 𝑎 ,𝑎
Extraction of the Inormframe from the video
Extraction of the Inorm1 frame from the video
Preprocessing of frame (Resizing of the frame, conversion from RGB to Gray, mean normalization)
Preprocessing of frame (Resizing of the frame, conversion from RGB to Gray, mean normalization)
Detection of dominant points for the
Inorm frame
Detection of dominant points for the
Inorm1frame
Computation of feature descriptors for the Inorm frame
2508 images offer speed gain and reduced computational
complexity [30, 31]. At any point 𝑋 𝑥, 𝑦 in the normalized gray scale imageIimage I 𝑥, 𝑦 is given by Equation (3), 𝑥, 𝑦 , integral 𝐼 𝑥, 𝑦 ∑ ∑ 𝐼 𝑥, 𝑦 (3)
So in an integral image, the value of any point is the sum of all the pixels above and to the left of 𝑋 𝑥, 𝑦 in the original image [32]. Dominant points in an image are the points of maximum intensity change in the image. A blob detector based on the Hessian matrix is used to localize the dominant points. Initially a multiscale representation 𝐿 𝑥, 𝑦, 𝜎 of the integral image 𝐼 𝑥, 𝑦 is obtained as in Equation (4),
L(x, y, σ) = g(x, y, 𝜎) * Iintegral(x, y) (4)
where g(x, y, 𝜎 is the Gaussian kernel given by Equation (5),
g(x, y, 𝜎) = 𝑒 (5)
where 𝜎 is the scale parameter of the Gaussian kernel at point 𝑋 𝑥, 𝑦 in image 𝐼 𝑥, 𝑦 . Multi-scale blob detectors can be obtained from
local maxima and local minima of
the Laplacian operator or the determinant of the Hessian matrix. Given a point 𝑋 𝑥, 𝑦 in an Integral image𝐼 𝑥, 𝑦 , the Hessian matrix 𝐻 𝑋, 𝜎 in X with scale σ [33] is defined as in Equation (6),
𝐻 𝑋, 𝜎 𝐿𝐿 𝑋, 𝜎𝑋, 𝜎 𝐿𝐿 𝑋, 𝜎𝑋, 𝜎 (6)
where 𝐿 X, σ is the convolution of the Gaussian second order derivative with the image 𝐼 𝑥, 𝑦 , as shown by Equation (7), and similarly 𝐿 X, σ and 𝐿 X, σ are the second-order derivatives of the integral image.
𝐿 𝑋, 𝜎 𝑔 𝜎 ⊗ 𝐼 𝑋 (7)
[image:5.612.313.402.428.550.2]The determinant of the Hessian matrix is given by Equation (8),
|𝐻 𝑋, 𝜎 | = (𝐿 𝐿 𝐿 ) (8)
To speed up the calculations, SURF
approximates 𝐿 , 𝐿 , 𝐿 with the box filter resulting respectively in 𝐷 , 𝐷 , 𝐷 [28, 34] as given by Equation (9),
𝐻 𝑋, 𝜎 =𝐷𝐷 𝑋, 𝜎𝑋, 𝜎 𝐷𝐷 𝑋, 𝜎𝑋, 𝜎 (9)
The maximum value of the determinant of Hessian gives an interest point. Thus, the interest points, including their scales and locations, are detected in approximate Gaussian scale space. The size of the box filter is varied with octaves and intervals as given by Equation (10),
𝐹𝑖𝑙𝑡𝑒𝑟 𝑆𝑖𝑧𝑒 3 2 𝑖𝑛𝑡𝑒𝑟𝑣𝑎𝑙 1 (10)
Interest points are identified at different scales to search for correspondence. Gaussian filter is applied to the images repeatedly to smooth the image with scale factor given by Equation (11),
𝜎 𝑐𝑢𝑟𝑟𝑒𝑛𝑡 𝑓𝑖𝑙𝑡𝑒𝑟 𝑠𝑖𝑧𝑒 (11)
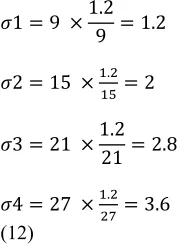
The output of the 9×9 filter is considered as the initial scale layer with scale parameter σ=1.2 [28]. The image is filtered with a size of 9×9, 15×15, 21×21, 27×27 and so on. The scale space is divided into a number of octaves. Scale parameter for octave 1 are calculated as shown in Equation (12) using Equation (10) and Equation (11),
𝜎1 9 1.2 9 1.2
𝜎2 15 . 2
𝜎3 21 1.2 21 2.8
𝜎4 27 . 3.6
(12)
Box space octaves with intervals, filter size, and corresponding scales are tabulated in Table 1. Each octave spans a number of scales that are analyzed using different size filters. The feature descriptor is computed based on the regions extracted around the feature detected. The descriptors are calculated using local gradient computations.
Table 1: Box Space Octaves With Intervals, Filter Size, And Scales
Octave Interval Filter size Scale σ
1
1 9 1.2
2 15 2.0
3 21 2.8
4 27 3.6
ISSN: 1992-8645 www.jatit.org E-ISSN: 1817-3195
2509
2 27 3.6
3 39 5.2
4 51 6.8
3 1 27 3.6
2 51 6.8
3 75 10
4 99 13.2
3.3. Computation of Feature Vectors
Feature vectors are the descriptors of the dominant points. These feature vectors are computed for every dominant point obtained earlier for every image. A square region of a size 20 times of filter scale, σ is extracted around the detected dominant point [28]. The interest region is then split into smaller 4 × 4 sub-regions, and for every sub-region, Haar wavelet responses are obtained in the horizontal and vertical direction. All 4 ×4 sub-regions are sampled 5 × 5 times to obtain the Haar wavelet response. These responses are weighted with Gaussian function centered at the interest point [35]. Let 𝑑 = Haar response in the horizontal direction and 𝑑 =Haar response in the vertical direction. The Haar wavelet responses 𝑑 and 𝑑 are summed up for every sub-region and are the part of the feature vector. Absolute values of |𝑑 | and 𝑑 are calculated to know the polarity of intensity changes and are also part of the feature vector. So each sub- region is represented by a feature vector as given by Equation (13),
v = ∑ 𝑑 ∑ 𝑑 ∑|𝑑 | ∑ 𝑑 (13)
This results in a descriptor vector, Φ for all 4 × 4 subregions feature vectors (v1,v2,v3……v16) concatenated of length 64 as given by Equation (14),
Φ = 𝑣1 𝑣2 𝑣3 … … 𝑣16 (14)
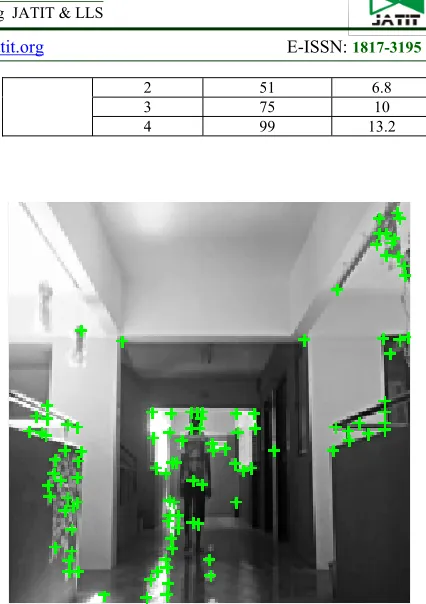
[image:6.612.309.522.55.357.2]This descriptor is normalized to make it invariant to illumination changes. Figure 2 shows a sample image with 83 dominant points detected.
Figure 2: Dominant Points Of The 10th Frame
3.4. Matching of Dominant Points
The feature descriptor represents every feature vector. Two features are matched if the distance between two descriptor vectors is minimum/small. For the feature matching process, the method proposed by Lowe [36] is referred. The Euclidian distance between SURF descriptors is used to determine the corresponding feature point pairs in consecutive images. This feature matching process gives a set of inliers, i.e. dominant points discarding outliers. A set of inliers is used further for the estimation of the distance between user and
obstacle. For two consecutive
framesI 𝑥, 𝑦 and I 𝑥, 𝑦 the number of features to be matched are 𝑓 and 𝑓 , the corresponding feature descriptors are (𝛷 , 𝛷 , 𝛷 , ….., 𝛷 )norm and (𝛷 , 𝛷 , 𝛷 ….. 𝛷 )norm1. All
feature descriptors are 64-dimensional vectors.
For feature comparison, for every feature descriptor 𝛷 of frameI 𝑥, 𝑦 , Euclidean distance 𝑑 , is calculated with respect to all candidate feature descriptors 𝛷 of frame I 𝑥, 𝑦 as given by Equation (15) [31],
2510 The strong match of dominant points is the minimum Euclidean distance [31] as given by Equation (16),
𝑑 , = argmin 𝑑 , (16)
3.5. Estimation of Distance
[image:7.612.95.305.248.374.2]Feature descriptors of dominant points are used to derive the correspondences between the dominant points of consecutive frames. These dominant points are referred to as inlier points. Figure 3 shows the matching of dominant points known as inliers.
Figure 3: Matching Of Dominant Points (Inliers) Of 10th And 11th Frame
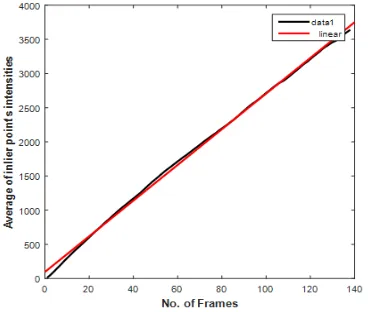
The inlier points are further used to estimate the distance of the obstacle from the user. For every frame, the average feature intensities are calculated. The graph of frames vs. average of inlier point’s intensities are plotted, and the relationship is established as given by Equation (17),
m = 𝑎 n + 𝑎 (17)
where n= number of frames, m = average of inlier point’s intensities. For a typical Microsoft webcam used in experimentation, 𝑎 = 26 and 𝑎 = 42. The average of the feature intensities is used to estimate the distance of the obstacle from the visually impaired.
4. EXPERIMENTATION & RESULTS
[image:7.612.319.504.351.510.2]For implementation and testing of the proposed algorithm the hardware platform, Intel Core i5, [email protected] GHz and RAM 6 GB with Windows 10, MATLAB 8.5 (R2015a) computational facility is used. The performance of the proposed algorithm is evaluated on databases. Databases are created using Microsoft webcam and Iball camera. The specifications of these cameras are mentioned in Table 2.
Table 2: Cameras Used For Creating Databases
Camera Specifications
Microsoft webcam
15 frames/sec, 640*480 resolution Iball Camera 30 frames/sec, 320*240
resolution
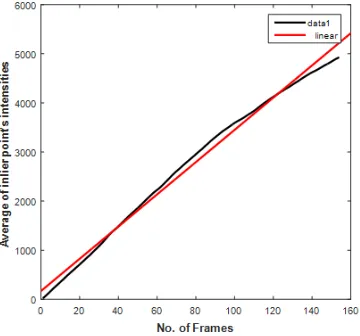
The proposed algorithm is tested on indoor videos as well as outdoor videos. The object (pedestrian) is moving towards the camera. Databases are created under dynamic environment, i.e. the change in the parameter like the height of the object, the speed of the object, the distance between camera and obstacle, the height of the camera, ambient light condition. Dominant points are extracted and matched using SURF descriptors; these points are known as inliers. The average of inlier point’s intensities is calculated, and frames vs. average are plotted as shown in Figure 4, 5, 6.
[image:7.612.318.509.560.716.2]ISSN: 1992-8645 www.jatit.org E-ISSN: 1817-3195
[image:8.612.88.268.131.299.2]2511 Figure 5: Plot Of Frames Vs. Average Of Inlier Point’s
Intensities For Video 2 Captured By Microsoft Webcam. Figure 6: Plot Of Frames Vs. Average Of Inlier Point’s Intensities For Video 3 Captured By IBALL Camera.
The number of frames is plotted on the x-axis, and the average of inlier point’s intensities is plotted on the y-axis. The Video 1 captured by Microsoft webcam is of 6-sec duration in which the pedestrian covers 6 m to 1.5 m distance towards the camera. The Video 2 captured by Microsoft webcam is of 9-sec duration in which the pedestrian covers 6 m to 1.5 m distance towards the camera. The Video 3 captured using IBALL camera, is of 5-sec duration in which the pedestrian covers 6 m to 2 m distance towards the camera. The frame number and inlier feature intensities are linear with the values of 𝑎 and 𝑎 as shown in Table 3.
Table 3: Values Of 𝑎 And 𝑎
Sr.
No. Video 𝒂𝟎 𝒂𝟏
1 Video 1 Microsoft
webcam 26 42
2 Video 2 Microsoft
webcam
26 97
3 Video 3 IBALL camera 33 1.7×10
The relation between m and n are approximated with Ist order polynomial as given by Equation (18),
(19) and (20) for videos 1, 2 and 3 respectively,
m = 26n +42 (18)
m = 26n + 97 (19)
m = 33n + 1.7×10 (20)
where n= number of frames, m = average of inlier point’s intensities.
4.1 Calibration Curve
The video 2 is captured with a 15fps rate; the pedestrian (moving object) covers 6 m to 1.5 m distance towards the camera. The total duration of the video is 9 sec. So, using the basic fitting equation, the relation between n, number of frame and D, the distance of an obstacle from the camera is obtained as given by Equation (21),
𝐷 0.033𝑛 6 (21)
[image:8.612.83.306.497.588.2] [image:8.612.314.512.594.718.2]2512 Figure 7: Distance Vs. Average Of Inlier Point’s
Intensities For Video 2 Captured By Microsoft Webcam.
The results are derived with zooming Figure 5 as shown in Figure 8, for intensity, m= 1664, the actual frame is 58 and the estimated frame is 60.03. Using Equation (21), actual obstacle distance is 4.02 meters and the estimated obstacle distance is 4.09 meters. Absolute error of obstacle distance= -0.07 meters, % error of obstacle distance = -1.64%. For actual speed, frame number 40 and 58 are considered. For 18 frames, with 15fps camera specification, time required is 1.2 sec, distance covered is 4.68 - 4.09= 0.59 meters and actual speed = 0.59/1.2 = 0.5m/sec.
Using estimated frame number and estimated distance, estimated speed = 0.501 m/sec. Absolute
[image:9.612.316.532.44.276.2]speed error and % speed error is calculated. Figure 8: Actual And Estimated Frame Number And The Corresponding Average Of Inlier Point’s Intensities For Video 2 Captured By Microsoft Webcam. Table 4: Frame Number, The Average Of Inlier Point's Intensities, Obstacle Distance, Absolute Error And Speed For
Video 2 Captured By Microsoft Webcam
Sr. No.
Actual frame number
Actual Obstacle
distance (T) in meters, D
Estimat ed Frame number , n
Average of inlier point’s
intensities, m
Estimated obstacle distance (M) in meters, D
% error for distance=
𝐌 𝐓 𝟏𝟎𝟎/𝐓
Actual Speed, m/sec
SA
Estimate d Speed, m/sec
SE
% error for speed
=𝑺𝑬 𝑺𝑨 𝟏𝟎𝟎/𝐒𝐀
1 20 5.34 19.39 602.70 5.36 0.38 - - -
2 40 4.68 41.17 1172.00 4.64 -0.83 0.50 0.50 0.00
3 58 4.09 60.03 1664.00 4.02 -1.64 0.50 0.50 1.21
4 80 3.36 80.46 2197.00 3.34 -0.45 0.61 0.50 -17.52
5 100 2.70 100.30 2715.00 2.69 -0.37 0.50 0.49 -0.81
6 120 2.04 119.30 3211.00 2.06 1.13 0.50 0.50 0.40
7 134 1.58 131.90 3539.00 1.65 4.39 0.50 0.49 -1.41
The video 3 is captured with the 30fps rate for the pedestrian (moving object) who covers 6 m to 2 m distance towards the camera. The total duration of the video is 5 sec. So, using the basic fitting equation, the relation between the number of frame and distance of an obstacle from the camera is obtained as given by Equation (22),
D= -0.026n+6 (22)
[image:9.612.84.531.355.535.2]ISSN: 1992-8645 www.jatit.org E-ISSN: 1817-3195
[image:10.612.84.529.122.300.2]2513
Table 5: Frame Number, The Average Of Inlier Point’s Intensities, Obstacle Distance, Absolute Error And Speed For Video 3 Captured By IBALL Camera
Sr. No.
Actual frame number
Actual Obstacle distance (T) in meters, D
Frame number,
n
The ave. of inlier point’s intensities,
m
Estimated obstacle distance (M) in meters, D
% error for distance=𝐌
𝐓 𝟏𝟎𝟎/𝐓
Actual Speed, m/sec SA
Estimated Speed,
m/sec SE
% error for speed =
𝑺𝑬 𝑺𝑨 𝟏𝟎𝟎/𝐒𝐀
1 20 5.48 16.53 710.60 5.57 1.65 - - -
2 40 4.96 40.09 1486.00 4.96 -0.05 -0.780 -0.777 -0.41792
3 60 4.44 62.69 2228.00 4.37 -1.58 -0.780 -0.783 0.408441
4 80 3.92 84.96 2953.00 3.79 -3.29 -0.780 -0.781 0.169251
5 100 3.40 104.30 3592.00 3.29 -3.29 -0.780 -0.776 -0.56479
6 120 2.88 120.50 4123.00 2.87 -0.45 -0.780 -0.778 -0.2849
7 140 2.36 135.80 4622.00 2.47 4.63 -0.780 -0.784 0.553042
The actual speed is calculated using the actual frame number, actual obstacle distance, and camera frame rate. The estimated speed is obtained using frame number, estimated obstacle distance, and camera frame rate. The absolute error between actual and estimated distance/speed is calculated. The spread of absolute error around mean absolute error is given by standard deviation. The standard
deviation for absolute error is given by Equation (23),
2514 where p = value of the parameter (distance or speed), μ = mean of data set of parameters (distance or speed), N = number of data set points of a parameter.
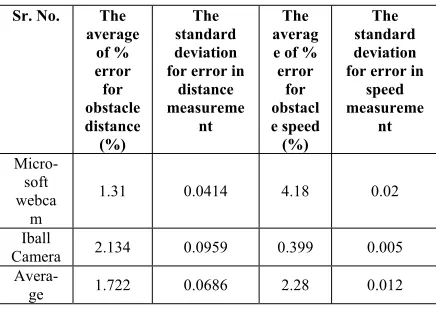
[image:11.612.85.303.363.518.2]The actual distance and estimated distance are nearly the same as shown in Tables 4 and 5. The speed of an obstacle is calculated using actual distance and frames per sec capture rate of the camera. The % error for obstacle distance and speed is determined. The standard deviation for absolute error is obtained. The small value of standard deviation for error in distance measurement (standard deviation for Table 4 is 0.0414) indicates that estimated obstacle distance and actual obstacle distance is nearly equal. The small value of the standard deviation for error in speed measurement (standard deviation for Table 4 is 0.02) indicates that the estimated obstacle speed is nearly equal to actual obstacle speed. The algorithm performance for different videos captured by the different cameras is tabulated in Table 6.
Table 6: Algorithm Performance For Different Videos
Sr. No. The
average of % error for obstacle distance (%) The standard deviation for error in
distance measureme
nt
The averag e of % error for obstacl e speed (%) The standard deviation for error in
speed measureme nt Micro-soft webca m
1.31 0.0414 4.18 0.02
Iball
Camera 2.134 0.0959 0.399 0.005
Avera-ge 1.722 0.0686 2.28 0.012
5. CONCLUSIONS
This paper presents an algorithm to measure the distance of the obstacle from visually impaired and to provide an alert to visually impaired during their navigation. The proposed algorithm uses Speeded up robust feature extraction and matching technique for getting the average of
features. For two consecutive
framesI 𝑥, 𝑦 and I 𝑥, 𝑦 the number of features to be matched are 𝑓 and 𝑓 , the corresponding feature descriptors are (𝛷 , 𝛷 , 𝛷 ,….., 𝛷 )norm and (𝛷 , 𝛷 , 𝛷 ….. 𝛷 )norm1. All
feature descriptors are 64-dimensional vectors. To obtain the correspondence of feature points between two consecutive frames using SURF,
number of computations required = k×l×64, whereas in SIFT (Scale Invariant Feature Transform), feature descriptors are 128-dimensional vectors [37], number of computations required = k×l×128. So time complexity is less in SURF i.e. feature matching time is less in SURF.
Similarly, space complexity in SURF to derive the correspondence of feature points between two consecutive frames is given by, (64×k) + (64×l) + (64×m) whereas using SIFT, it is (128×k) + (128×l) + (128×m). So space complexity is less in SURF.
The algorithm is tested with different objects (heights) with variable walking speed under different illumination. The estimated distance between the moving object and still camera is obtained. The actual distance and estimated distance is compared. The % error and standard deviation for distance and speed are calculated. A value of standard deviation for error in distance measurement (0.0414 & 0.0959) indicates that observed values of obstacle distance and actual distance are very near to mean value. The speed of a moving obstacle is calculated using the camera frame rate and obstacle distance. A value of standard deviation for error in speed measurement (0.02 & 0.005) indicates that observed values of obstacle speed and actual speed are very near to mean value.
ISSN: 1992-8645 www.jatit.org E-ISSN: 1817-3195
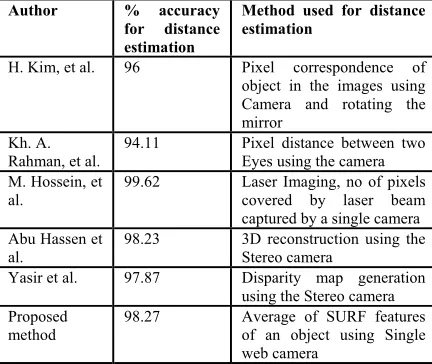
[image:12.612.86.302.286.468.2]2515 Disparity maps generated from stereo cameras are used to determine the distance of moving an object from the camera by Yasir et al. [42] with a Nikon 5300 DLSR camera, EF 50-mm f/1.8L lens. They have obtained a 2.13% error in distance measurement. Our results are compared with work done by other authors as shown in Table 7. Our method is superior as compared to the stereo camera in terms of % accuracy, time complexity, memory complexity and number of cameras. Other methods need additional tools such as a laser or rotating mirror. The proposed method provides a SURF feature-based novel solution for distance measurement using a single camera.
Table 7: Comparison Of Proposed Method Findings With Other Methods
Author % accuracy
for distance estimation
Method used for distance estimation
H. Kim, et al. 96 Pixel correspondence of object in the images using Camera and rotating the mirror
Kh. A. Rahman, et al.
94.11 Pixel distance between two Eyes using the camera M. Hossein, et
al.
99.62 Laser Imaging, no of pixels covered by laser beam captured by a single camera Abu Hassen et
al.
98.23 3D reconstruction using the Stereo camera
Yasir et al. 97.87 Disparity map generation using the Stereo camera Proposed
method
98.27 Average of SURF features of an object using Single web camera
The information about obstacle distance and speed of moving obstacle can be utilized for safe navigation of visually impaired.
REFERENCES:
[1] M. Mahammed, A. Melhum, Faris A. Kochery, "Object distance measurement by a stereo vision", International Journal of Science and
Applied Information Technology (IJSAIT),
Vol.2, No.2, Pages: 05-08 (2013).
[2] R.Bourne, Seth R Flaxman, T. Braithwaite, M. Cicinelli, A, Das, J. Jonas, J. Keeffe, J. Kempen, J. Leasher, H. Limburg, K. Naidoo, K. Pesudovs, S. Resnikoff, A. Silvester, G. Stevens, N. Tahhan, T. Wong, H. Taylor, “Magnitude, temporal trends, and projections of the global prevalence of blindness and distance and near vision impairment: a systematic review and meta-analysis”, Lancet, Vol.5, Sept. 2017.
[3] A. Rodr´ ıguez, J. Yebes, P. Alcantarilla, L. Bergasa, J. Almazan, A. Cela, “Assisting the visually impaired: obstacle detection and warning system by acoustic feedback", Sensors
2012, 12, 17476-17496;
[4] Dah-Jay Lee et al., "Hardware Implementation Of A Spline-Based Genetic Algorithm For Embedded Stereo Vision Sensor Providing Real-Time Visual Guidance To The Visually Impaired", EURASIP Journal on Advances in
Signal Processing, December 2008.
[5] Y.H. Lee, G. Medioni, “RGB-D Camera Based Navigation for the Visually Impaired",
iris.usc.edu/Outlines /papers/2011/lee-medioni-rd11.pdf.
[6]Huang, H.C, Hsieh, C.T., “An Indoor Obstacle Detection System Using Depth Information and Region Growth”, Sensors 2015, 15, 27116–27141.
[7] V. Hoang, T. Nguyen, T. Le, T. Tran, T. Vuong, N. Vuillerme, “Obstacle detection and warning system for visually impaired people based on electrode matrix and mobile Kinect", Vietnam Journal of Computer
Science, Volume 4, Issue 2, pp 71–83, May
2017.
[8] L. Scalise,V. Primiani, P. Russo, D. Shahu, V. Mattia, A. Leo,G. Cerri, “Experimental investigation of electromagnetic obstacle detection for visually impaired users: A Comparison With Ultrasonic Sensing", IEEE Transactions on Instrumentation and
Measurement, Volume 61, Issue 11, Nov. 2012.
[9] V. Diana Earshia, S. Kalaivanan, K.Bala Subramanian, “A Wearable Ultrasonic Obstacle Sensor for Aiding Visually Impaired and Blind Individuals”, International Journal of Computer Applications® (IJCA) (0975 – 8887) National Conference on Growth of Technologies in Electronics, Telecom and Computers - India's Perception, GOTETC-IP'13.
[10] R. Katzschmann, B. Araki, D. Rus, “Safe Local Navigation for Visually Impaired Users With a Time-of-Flight and Haptic Feedback
Device”, IEEE Transactions On Neural
Systems and Rehabilitation Engineering, Vol.
26, No. 3, March 2018.
[11] R. Saffoury , P. Blank, J. Sessner, B. Groh , C. Martindale, E. Dorschky , J. Franke, B. Eskofier, “ Blind Path Obstacle Detector using Smartphone Camera and Line Laser Emitter”,
2516
on Technology and Innovation in Sports, Health
and Wellbeing, 2016.
[12] K. Palaguta, А. Krukov, S. Troikov and I. Shubnikova, “Aid system for visually impaired people at spatial orientation", In IOP Conf. Series: Materials Science and Engineering 151
(2016) 012028
DOI:10.1088/1757-899X/151/1/0120282016.
[13] Surachai Panich, “Comparison of Distance Measurement between Stereo Vision and Ultrasonic Sensor”, Journal of Computer,
Volume 6, Issue 10, October 2010.
[14] P. Costa, H. Fernandes, J. Barroso, H. Paredes, L. Hadjieontiadis, “Obstacle detection and avoidance module for the blind”, World
Automation Congress, 2016, IEEE Xplore: 6
Oct 2016.
[15] H. Su, Q. Huang, N. Mitra, Y. Li, Leonidas, “Estimating image depth using shape collections”, Siggraph 2014.
[16]https://courses.cs.washington.edu/courses/cse5 76/book/ch12.pdf.
[17] A. Saxena, M. Sun and A. Ng, “Make3D: Depth perception from a single still image”, http://www.cs.cornell.edu/~asaxena/reconstruct ion3d/saxena_depth erception_aaai08.pdf. [18] Q. Wei, “ Converting 2D to 3D: A Survey”,
Information and Communication Theory Group (ICT), 2005.
[19] R. Praveen, Roy P Paily, “Blind navigation assistance for visually impaired based on local depth hypothesis from a single image”, In:
International Conference on Design and
Manufacturing, IConDM 2013, Procedia
Engineering 64 (2013) 351 – 360, ScienceDirect.
[20] P. Gharani, H. Karimi, “Context-Aware obstacle detection for navigation by visually impaired”, Image and Vision Computing
Journal, Elsevier, Volume 64, August 2017,
Pages 103-115.
[21] Tapu, R.; Mocanu, B.; Zaharia, T., " Real-time static/dynamic obstacle detection for visually impaired persons”, In Proceedings of the 2014 IEEE International Conference on Consumer
Electronics (ICCE), Las Vegas, NV, USA, 10–
13 January 2014.
[22] Abbas M. Ali, Md Jan Nordin, “Indoor Navigation to Support the Blind Person Using
True Pathway within the Map”, Journal of
Computer Science 6 (7): 740-747, 2010.
[23] S. Rahman, S. Ullah, S. Ullah, “Obstacle Detection in Indoor Environment for Visually Impaired Using Mobile Camera”, Journal of
Physics: Conference Series, Volume
960, Conference 1, 2018.
[24] Lixin He, Jing Yang , Bin Kong , Can Wang , “An Automatic Measurement Method for Absolute Depth of Objects in Two Monocular Images Based on SIFT Feature”, May 2017, Applied Sciences, MDPI.
[25] C. Kanan, G.W. Cottrell, “Color-to-Grayscale:
Does the Method Matter in Image
Recognition?” PLoS ONE 7(1): e29740, 2012. [26]http://in.mathworks.com/help/matlab/ref/rgb2gr
ay.html.
[27] Bikesh Kumar Singh, Kesari Verma, A. S. Thoke, “Investigations on Impact of Feature Normalization Techniques on Classifier’s Performance in Breast Tumor Classification”, International Journal of Computer Applications
(0975 – 8887) Volume 116 – No. 19, April 2015.
[28] H. Bay, A. Ess, T. Tuytelaars, and L. van Gool, "Speeded-up robust features (SURF)”,
Computer Vision and Image Understanding,
vol.110,no.3,pp.346–359,2008.
[29] F. Schweiger, G. Schroth, R. Huitl, Y. Latif, E. Steinbach, “Speeded-Up Surf: Design of an efficient multiscale feature detector”, In 2013 IEEE International Conference on Image Processing.
[30] Shoaib Ehsan, Adrian F. Clark, Naveed ur Rehman, Klaus D. McDonald-Maier, “Integral Images: Efficient Algorithms for Their Computation and Storage in Resource-Constrained Embedded Vision Systems”,
Sensors (Basel), 2015 Jul; 15(7): 16804–16830.
[31] Edouard Oyallon, Julien Rabin, “An Analysis of the SURF Method”, IPOL, July 2015. [32] B. Taylor, "Smartphone-based indoor guidance
system for the visually impaired”, 2012-03-13,
Brigham Young University – Provo.
[33] David Chi Chung Tam, Ryerson University, “SURF: Speeded Up Robust Features”, In http://www.computerrobotvision.org/2010/tutor ial_day/tam_surf_rev3.pdf, CRV Tutorial Day 2010.
[34] Yang, Shen, Yap, “Image mosaicking using SURF features of line segments”, PLoS One
2017; 12(3): e0173627.
[35] Jacob Toft Pedersen, “Study group SURF: Feature detection & description”, surf feature detection and description q4 2011.
ISSN: 1992-8645 www.jatit.org E-ISSN: 1817-3195
2517
[37] Nadia Kanwal , “ Low-Level Image Features and Navigation Systems for Visually Impaired People”, Phd Thesis, 2013.
[38] H Kim et al., “Distance Measurement Using a Single Camera with a Rotating Mirror”,
International Journal of Control, Automation,
and Systems, vol. 3, no. 4, pp. 542-551,
December 2005.
[39] Kh. A. Rahman et al., “Person to Camera Distance Measurement Based on Eye-Distance”, Third International Conference on
Multimedia and Ubiquitous Engineering, 2009.
[40] Hossein Zivarian, Mohammad Hossein Doost Mohammadi, “An Accurate Scheme for Distance Measurement using an Ordinary Webcam”, International Journal of Electrical
and Computer Engineering (IJECE), Vol. 7,
No. 1, February 2017, pp. 209~215.
[41] M.F. Abu Hassan et al, “3D Distance
Measurement Accuracy On Low-Cost Stereo Camera”, Sci.Int.(Lahore),29(3),599-605, May June 2017 ISSN: 1013-5316; CODEN: SINTE 8.
[42]Yasir D. alman, Ku Ruhana Ku-Mahamud, Eiji Kamioka, “Distance Measurement for Self-Driving Cars Using Stereo Camera”,
Proceedings of the 6th International Conference on Computing and Informatics,