http://dx.doi.org/10.4236/aer.2014.23012
Adaptation and Validation of a Proteolytic
Activity Methodology Using Dye-Crosslinked
Substrate Tablets
Fernanda Martins, Elaine C. Ramires
3M, Infection Prevention Division, Health Care Group, Sumaré, Brazil Email: [email protected], [email protected]
Received 27June 2014; revised 28July 2014; accepted 19August 2014
Copyright © 2014 by authors and Scientific Research Publishing Inc.
This work is licensed under the Creative Commons Attribution International License (CC BY). http://creativecommons.org/licenses/by/4.0/
Abstract
Enzymatic activities are important to be quantified in products as enzymatic cleaners, which are used in medical and surgical devices reprocessing. Enzymatic activities are critical for the proper chemical cleaning that intends to remove solid organic dirt from inaccessible sites. The most im-portant enzyme for this purpose is the protease, which is able to dissolve the main dirt attached to medical and surgical instruments. In this context, this study contributes to the development of a new proteolytic activity quantification method and its validation. The methodology is based on colorimetry and uses a UV-Vis spectrophotometer to measure the substrate hydrolysis by the blue color intensity, employing Protazyme AK tablets as substrate.
Keywords
UV-Vis Spectrophotometry, Protease, Protazyme, Enzymatic Cleaner, Azurine-Crosslinked Casein, Colorimetry
1. Introduction
In the last years, with the understanding increase of the disinfection and sterilization process in hospitals, the importance of the cleaning step in the whole process efficacy has been raised [1] [2].
The presence of residual tissue and other body fluids on the instruments can result in layers of organic material that may be difficult to remove and disinfect, and this situation is aggravated by the formation of biofilms [3].
moval from medical and surgical instruments is known.
Disinfection processes such as heat, aldehydes or alcohols kill vegetative microorganisms but do not neces-sarily remove other organic contamination, including biofilm. Additionally, organic residues impair the result of low-temperature sterilization processes and heat-stable organic residues may give rise to clinical symptoms in the patient [5].
In this context, the products employed in the organic residues removal from medical and surgical devices have gained attention, particularly the enzymatic cleaners which are responsible for organic material hydrolyses in sites of difficult access for a mechanical cleaning. These products are used to help penetration into soil on in-strument surfaces, and in suspension of contaminants removed from inin-struments to avoid redeposition [6]. En-zymes can degrade the biofilm, by means of eroding, softening or promoting the collapse of the biofilm matrix. The biofilm removal can be achieved either by progressive erosion or by fragmented detachment [7].
The cleaning efficacy and its products have become so important that the regulatory agency in Brazil, Anvisa, published a specific regulation for enzymatic detergents in Nov. 2012, where there are official methodologies for both proteolytic and amylolytic activities quantification [8]. These enzymatic activities need to be declared in the detergent label regarding the end of its shelf life, proving the presence of active enzymes before the expiring date. The importance of the protease was outstanding in the legislation, being required its presence in enzymatic cleaners [8]; mainly because proteins are present in great quantities in many body fluids as blood and in biofilm as well. The official proteolytic evaluation methodology was validated by the National Institute of Health Qual-ity Control, Oswaldo Cruz Foundation (INCQS-Fiocruz) in Rio de Janeiro, in partnership with Anvisa [8], showing specificity, linearity, detection and quantification limits as well as precision (repeatability and interme-diate precision), accuracy and robustness.
Besides the official methodology, several methods have been described for detection and determination of proteolytic activities [9] [10]. Among them, the simplest and most accessible method uses colorimetric reactions, which are detected and quantified by spectrophotometry [6] [11] [12]. The main advantage of spectroscopy is being quantitative, at a low operational cost and easy to use [13].
Megazyme Company has several analytical kits for this purpose including Protazyme AK tablets [14]. Mega- zyme suggests a quantification method for protease using its tablets. In this work, some adaptation of this me- thod using different reagents that are more available locally as well as less costly are shown.
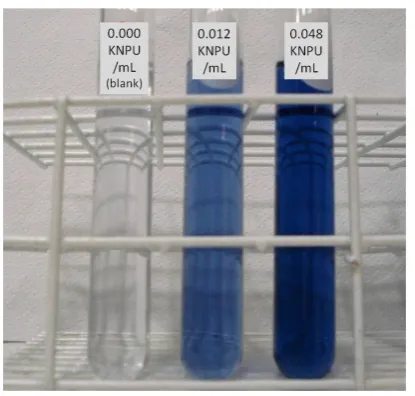
The principle of the method is that the Protazyme AK tablets contain a blue dye-crosslinked with the protease substrate, casein, which is insoluble in the original form. With the generation of substrate fragments by the en-zymatic hydrolysis, associated part of the dye becomes soluble and the solution becomes blue [14]. The advan-tage of this method is the visualization of the hydrolysis by the blue color intensity in the solution. Therefore, the quantification can be done by using a spectrophotometer in the visible range as well as employing a blue color intensity pattern kit. It is also possible to compare samples visually without any additional device, only by the blue color intensity, having qualitative results (Figure 1).
The proteolytic activity visualization in a simple way is very helpful during the use of enzymatic cleaners and guarantees that the product is working and also it can help in the cleaning validation in the hospital.
In this paper, a reliable method for protease activity quantification is demonstrated using Protazyme AK. This method proved to be specific, robust and repeatable. Besides that, it can be used as an alternative methodology of protease activity evaluation in hospitals, contributing with the enzymatic cleaners control and consequently the sterilization or disinfection efficacy.
2. Experimental
2.1. MaterialsProtease (from Bacillus subtilis, Savinase family), amylase, cellulase and lipase were obtained from Novozymes, Protazyme AK tablets from Megazyme, hydrochloric acid p.a from Dinâmica (Brazil), tris (hydroxymethyl)- aminomethane (Tris) p.a was purchased from Nuclear (Brazil) and trichloroacetic acid p.a (TCA) from Synth (Brazil).
2.2. Apparatus
Figure 1. Qualitative visualization of the hydrolysis by the blue color intensity in the solution.
ure at 590 nm wavelength (λ); Centrifuge Excelsa II, Mod.206BL-Fanem; and Heater bath Tecnal TE-055.
2.3. Reagents Preparation
1) Tris buffer stock solution. 242 g of Tris was added to a 1 L flask with deionized water. The final volume
was fixed with water after pH adjustment to 8.5 with 1 M HCl.
2) Diluted Tris buffer. 100 mL of Tris stock solution is diluted in 1 L of deionized water, with a final pH 8.3.
3) TCA reaction stop reagent. 10 g of TCA is added to a flask with 100 mL of deionized water.
4) Enzymatic standard stock solution. 15 g of protease (16 KNPU/g) is added to a flask with 100 mL of
de-ionized water, resulting in a solution of 2.4 KNPU/ml.
5) Enzymatic standard diluted solutions. The standard stock solution is additionally diluted to 9 different
concentration (0.0014, 0.0029, 0.0060, 0.0120, 0.0156, 0.0192, 0.0240, 0.0360 and 0.0480 KNPU/mL) using 100 mL flasks with 10 mL diluted Tris buffer and completing the volume with deionized water.
6) Blank solution. A solution prepared with diluted Tris buffer, with no enzymatic standard stock solution
ad-dition.
7) Enzymatic detergent solution samples. A detergent base has been prepared, containing buffer, stabilizers
and surfactants, in which 15 g of protease was added (2.4 KNPU/mL), and the volume was completed to 100 mL with the detergent base.
8) Reference solution sample. A sample of a detergent base without enzyme addition.
9) Sample preparation. 1 mL of each sample solution or diluted standard solution was added to 100 mL flasks
with 10 mL diluted Tris buffer, completing the volume with deionized water. The sample solution is diluted 1:100 (v:v) considering the working range to have good sensibility to read the absorbance.
2.4. Enzymatic Activity Evaluation Procedure
The procedure was based on the Megazyme assay of endo-protease using Protazyme AK tablets [14] with modi-fications. The Protazyme AK tablet is composed by azurine-crosslinked casein and is prepared by dyeing and crosslinking casein to produce a material which hydrates in water but is not soluble. Hydrolysis by proteases produces water soluble dyed fragments; the rate of their release is directly related to an increase in absorbance at 590 nm as well as to proteolytic activity [14].
that is the stop reagent indicated by Anvisa’s methodology [8]. The other modification was the way to isolate the insoluble tablet from the reacted solution, using centrifugation instead of filtration, which was considered much more practical. Hereafter, the proposed assay procedure is described.
One Protazyme AK tablet is added to each 20 mL test-tube following addition of 1 mL of diluted Tris buffer. The tubes are heated to 40˚C, using a heating bath, for 5 minutes or until tablets disintegration. 1 mL of sample is added to each test-tube with a 30 seconds interval among each sample tube. The tubes are shaken gently. Each tube stays in the heating for 10 exact minutes, checked in the chronometer. Thereafter, 10 mL of TCA reaction stop reagent is added followed by vortex agitation. Then, samples are centrifuged at 2260 g for 10 minutes and the supernatant absorbance is read at 590 nm. The wavelength 590 nm is in the visible range and measures the intensity of blue color that can be seen in the samples. A blank was prepared using the same conditions as assay except that instead of using an enzymatic sample, it was used a buffer, as described in 2.3.6, Blank solution. The blank reading values were discounted in the read samples absorbances. The method was done in triplicate for each sample.
2.5. Validation Methodology
The method validation is based on Anvisa standard method, Resolution RE 899 of May, 29th, 2003―Guide for Analytical and Bioanalytical Methods Validation [15].
The parameters recommended to be obtained by test type, component quantification, are: robustness, specific-ity, linearspecific-ity, precision and intermediate precision as well as accuracy. Additionally, the detection and quantifica-tion limits were calculated. The related procedures are described, as follows.
1) Specificity. The specific action of the protease under the substrate hydrolysis was tested by the presence of other compounds in the samples, as the detergent base; other enzymes: amylase, lipase and cellulase; and impu-rities, denatured enzymes. The samples were tested by comparing the absorption at 590 nm of the standard sam-ple with protease enzyme only. Means were compared by statistical analysis.
2) Robustness. The influence of many different possible variables was evaluated in the methodology: solution base type, pH, temperature and time of reaction. The absorbance means and standard deviations were calculated and compared graphically.
3) Linearity. The linearity curve range was determined by evaluating 9 points of proteolytic activity, from 0 to 0.048 KNPU/mL, being the point zero, the blank solution. The result is a mathematical expression used for the calculus of enzymatic activity in the samples. The obtained Equation (1) is represented by the expression:
y= +a bx (1)
being,
y: measured absorbance;
x: proteolytic activity;
a: intersection with y, when x = 0;
b: slope of the line (sensibility).
4) Limits of detection and quantification. The limits were defined from statistical calculus by average slope and activity standard deviation of 3 linear curves. Following the Equations (2) and (3):
3
s DL
b
= (2)
10
s QL
b
= (3)
being,
DL: detection limit;
QL: quantification limit;
S: standard deviation of the intersection with y-axis;
b: slope of the line.
(4) obtained from ISO 5725-3 [16]:
( )
(
)
2
1 2
,
1
1 2
t
j j
j k
j
Si y y
t =
= ×
∑
− (4)where,
Si: intermediate precision standard deviation;
j: the sample number, being t the number of samples;
k: the number of assays;
yjk: result of sample j and the assay k.
6) Accuracy. Samples of 3 different known proteolytic activities in a detergent base were prepared and as-sayed in triplicate. The activity results were compared to the known values.
2.6. Statistical Analyses
All the statistical analyses and charts were obtained by using Minitab Software, however intermediate precision was calculated by Equation (4).
3. Results and Discussion (Validation Studies)
3.1. SpecificityThe specificity study results are presented, as follow.
3.1.1. Other Compounds Present in Formulation Influence
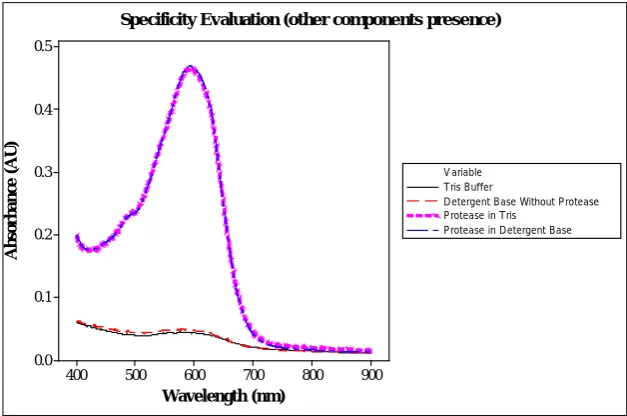
In order to verify the best wavelength to read the absorbance of the analysis, wavelength scans were performed reading samples of blanks and protease standards in buffer (Tris) and detergent base as well. Figure 2shows the maximum absorbance peak at 590 nm, visible blue color reading, without significant interference of other de-tergent base components. Considering this results, 590 nm was defined as a feasible wavelength for absorbance reading, in which were obtained all the following sample results.
3.1.2. Other Enzymes Presence Influence
The protease activity alone was compared to amylase, lipase and cellulase activities in order to demonstrate that only the protease acts on the hydrolysis of azurine-crosslinked casein, resulting in blue color.
The evaluated samples were prepared by adding the other enzymes in the enzymatic standard stock solution (sample: enzymes) and by preparing a stock solution with only lipase, cellulase and amylase (sample: other en-zymes).
Figure 3 shows the absorbance results of the evaluated samples. Both samples with protease have the same activity, 0.024 KNPU/mL, demonstrating that the other enzymes do not interfere in the result. This result is in agreement with our expectation considering that the enzymatic action is specific to the corresponding substrate.
Hence, the method can be considered selective in relation to the most usual enzymes found in enzymatic de-tergents of hospitals. The enzymes amylase, cellulase and lipase do not change the blue color intensity measured by spectroscopy, as shown in Figure 3.
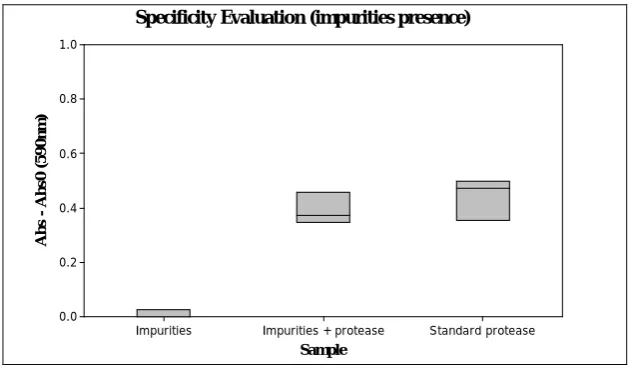
3.1.3. Impurities Presence Influence
The presence of impurities was obtained by heating the enzymatic standard stock solution with addition of the enzymes amylase, lipase and cellulase to 100˚C for 5 minutes, leading to the enzymes denaturation and impuri-ties generation. After cooling to room temperature, protease was added to 0.024 KNPU/ml in part of the sample, identified as impurities + protease; another part was measured without extra protease addition, called impurities. As a reference, enzymatic standard solution was prepared without being heated. The protease activity addition is the same in all samples.
Figure 4 shows the absorbance results of samples with or without impurities.
The most probable impurities in an enzymatic cleaner, denatured enzymes, do not affect significantly the pro-teolytic activity determined by the proposed methodology, as shown in Figure 4.
900 800 700 600 500 400 0.5
0.4
0.3
0.2
0.1
0.0
Wavelength (nm)
A
b
so
rb
a
n
ce
(
A
U
)
Tris Buffer
Detergent Base Without Protease Protease in Tris
Protease in Detergent Base V ariable
Specificity Evaluation (other components presence)
Figure 2. Evaluation of the protease specificity and determination of wavelength for sample reading by wavelength scan of analysis samples: Tris buffer, detergent base, protease in Tris and protease in detergent base.
Standard Protease Other Enzymes
Enzymes 1.0
0.8
0.6
0.4
0.2
0.0
A
b
s
A
b
s
0
(
5
9
0
n
m
)
[image:6.595.155.469.84.292.2]Specificity Evaluation (other enzymes presence)
Figure 3. Evaluation of the protease specificity by amylase, lipase and cellulose pres-ence, being Abs0 the blank sample absorbance, and Abs the prepared sample absorb-ances. Enzymes: sample with protease, amylase, lipase and cellulase; other enzymes: amylase, lipase and cellulase; standard protease: enzymatic standard stock solution.
with no influence of other compounds in blue color generation.
3.2. Robustness
The parameters to be evaluated in the robustness study were chosen based on the knowledge about enzymatic activity main influences, as: pH, temperature and reaction stop time.
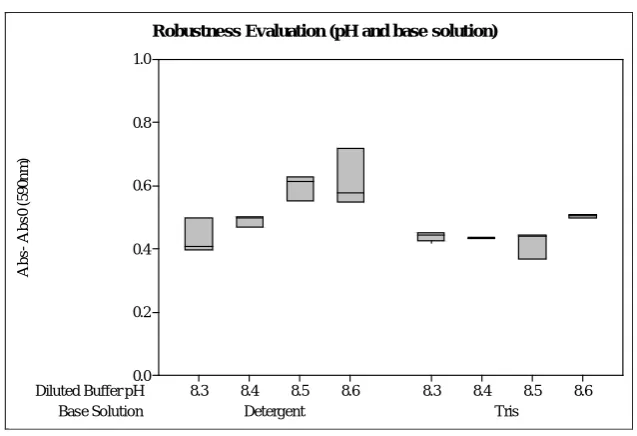
3.2.1. Solution Base Type and pH Influences
[image:6.595.156.471.338.525.2]Standard protease Impurities + protease
Impurities 1.0
0.8
0.6
0.4
0.2
0.0
Sample
A
b
s
A
b
s
0
(
5
9
0
n
m
)
Specificity Evaluation (impurities presence)
Figure 4. Evaluation of the methodology specificity by impurities presence, being Abs0 the blank sample absorbance, and Abs the prepared sample absorbances. Impuri-ties: thermal denatured enzymes; impurities + protease: thermal denatured enzymes with extra protease addition; standard protease: enzymatic standard stock solution.
Instead of studying the influence of different solvent brands, recommended by RE 899 [15], the influence of solution base was studied, because this condition was evaluated to be more critical to the methodology. The presence of a different buffer in the detergent base sample can lead to a greater pH difference than a different brand of the same buffer. The pH is a critical parameter in the enzymatic activity since the activity has a pH op-timal range.
Figure 5 shows the absorbance results and deviations of the study.
The results show a significant difference between pHs 8.3 - 8.4 and 8.5 - 8.6 for the detergent base and be-tween pHs 8.3 - 8.5 and 8.6 in the Tris buffer base. Considering the differences bebe-tween the two sample basis kinds, the differences increase with the pH. For pH 8.3, it is not observed significant difference between the bases. However, the standard deviations are higher for the detergent basis. Probably, the final pH of the reaction solution is less stable by the presence of another buffer in the sample. At higher pHs, the initial diluted buffer (pH 8.3) had a greater addition of sodium hydroxide solution to achieve the pH of the test, which may also have led to higher pH ranges. Moreover, the detergent base has an alkaline buffer, which intensifies the pH increase, leading to a more pronounced increase in the absorbance intensities to the detergent base samples.
According to the pH influence study, the hydrolysis rate is increased from pH 8.3 to 8.6, what is expected considering the optimum pH activity of Savinase, over pH 9. Hence, the pH adjustment needs to be precise and the same diluted solution preparation must be employed in all the samples in the same assay.
3.2.2. Influence of the Reaction Temperature
Figure 6 shows the absorbance results of the same sample reacted with temperature variation.
Although the protease activity temperature dependency is known, in the tested range it was not statistically significant, as shown in Figure 6.
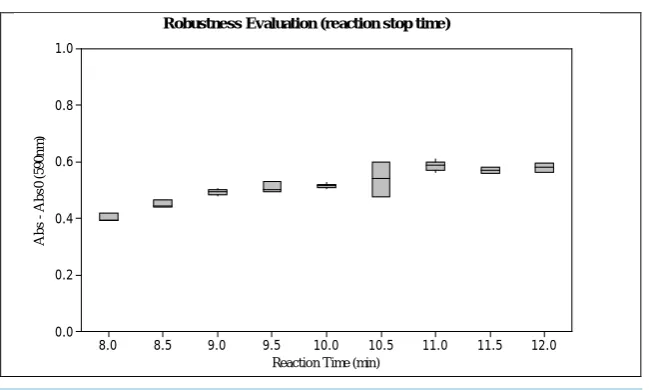
3.2.3. Reaction Stop Time Influence
The study of reaction time influence was conducted by using the same samples and preparations and stopping the reaction with TCA in different times. Figure 7 presents this study absorbance results.
[image:7.595.155.473.83.270.2]Figure 5. Evaluation of the methodology robustness by diluted buffer pH variation and different base solution, being Abs0 the reference sample absorbance for detergent so-lution, and blank sample for standard stock solution; and Abs the prepared sample ab-sorbance. 41 40 39 1.0 0.8 0.6 0.4 0.2 0.0 T (°C) A b s - A b s 0 ( 5 9 0 n m )
Robustness Evaluation (reaction temperature)
Figure 6. Evaluation of the methodology robustness by temperature variation, being Abs0 the blank sample absorbance, and Abs the prepared sample absorbances.
quently in enzymatic activities results.
Considering all parameters in the robustness evaluation and comparing the relative standard deviation (RSD) of the means for each studied variable, the most critical variable in the tested ranges is the base solution, being RSD over 10%, which is the most difficult to control as well. Hence, in order to increase the method accuracy, a standard curve needs to be sampled in each assay, containing the same base solution of the samples to be ana-lyzed. This procedure may decrease the influence of base solution type in the activity determination.
3.3. Linearity
The linearity was studied in a large range, larger than 80% to 120% of the active agent, because it needs to be general for different protease activities present in different enzymatic detergents, being this range the recommend- ed working range. Samples with higher proteolytic concentrations than the working range need to be diluted to the limits presented in this study and showed in the Figure 8 and Section 3.4 (QL value) for evaluation. The de-
Base Solution Diluted Buffer pH
Tris Detergent 8.6 8.5 8.4 8.3 8.6 8.5 8.4 8.3 1.0 0.8 0.6 0.4 0.2 0.0 A b s - A b s 0 ( 5 9 0 n m )
[image:8.595.156.471.351.534.2]Figure 7. Evaluation of the methodology robustness by reaction stop time variation, be-ing Abs0 the blank sample absorbance and Abs the prepared sample absorbances.
fined working range leads the methodology to acceptable accuracy level as showed in Section 3.6, Table 5.
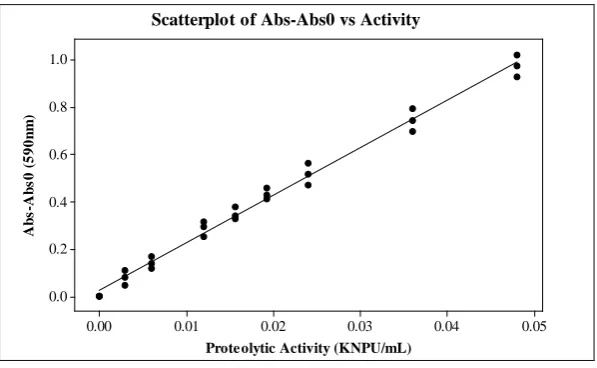
Figure 8 shows the measured absorbance profile in relation to the protease activity, from where it was possi-ble to define the detection as well as the quantification limits.
Statistical calculi were done using the obtained profile to verify its linearity. The following data was deter-mined: correlation coefficient (r), intersection with y-axis (a), slope of the line (b), sum of squared residuals of linear regression (SS); the F ratio (F) and the probability value (p) as well. The y-variables were obtained by the difference between each sample and the blank measured absorbance.
Through analysis of variance the linearity of method can be tested as well as the statistical significance of the plotted curve [17]. Table 1 shows this analysis, being DF: degree of freedom and MS: mean square error.
From the F-test table, Fcritical is 4.2, hence F calculated (Table 1) is much higher than Fcritical, being the re-gression hypothesis not null. Additionally, the p result shown in Table 1, lower than 0.05, indicates that the lin-ear regression data is valid and significant with 95% of confidence. So, it was possible to obtain a standard curve for the activity. The regression parameters obtained by the minimum square method are presented in Table 2.
Evaluating the probability values of null hypothesis in theTable 2, it was concluded that the equation pa-rameters a and b were valid.
Hence, the follow regression equation was determined as the standard proteolytic activity profile (Equation (5)):
(
)
Abs-Abs0=0.03 20.1 Protease activity KNPU mL+ (5)
where: r = 0.995.
3.4. Limits of Detection and Quantification
The detection and quantification limits were calculated from the linear regression, by using Equations (2) and (3), respectively, being S = 0.010.
0.002 KNPU mL 0.005 KNPU mL
DL= QL=
3.5. Precision and Intermediate Precision
Precision or repeatability was obtained with a fixed proteolytic activity in the average of the working range, on the same day and operator. The results are presented in Table 3, where the relative standard deviation can be seen.
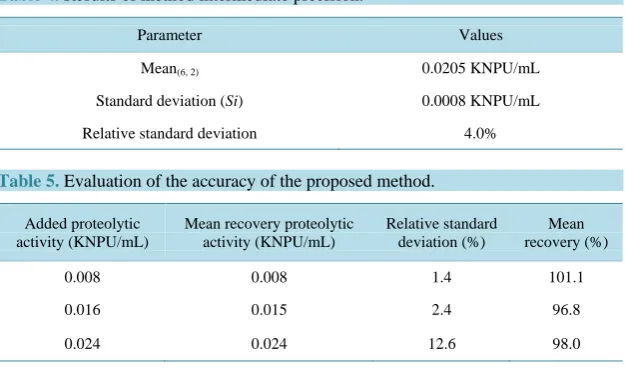
Intermediate precision repeated the precision procedures on a different day and operator, its results were cal-culated by expression (4), considering 6 samples (t) and 2 assays, and are shown in Table 4.
12.0 11.5 11.0 10.5 10.0 9.5 9.0 8.5 8.0 1.0
0.8
0.6
0.4
0.2
0.0
Reaction Time (min)
A
b
s
A
b
s
0
(
5
9
0
n
m
)
0.05 0.04
0.03 0.02
0.01 0.00
1.0
0.8
0.6
0.4
0.2
0.0
Proteolytic Activity (KNPU/mL)
A
b
s
-A
b
s
0
(
5
9
0
n
m
)
Scatterplot of Abs-Abs0 vs Activity
Figure 8. Absorbance profile in relation to proteolytic activity, being Abs0 the
blank sample absorbance, and Abs the prepared sample absorbances.
Table 1. Analysis of variance (ANOVA).
Source DF SS MS F p
Regression 1 2.4231 2.4231 2219.2 0.000
Residual error 25 0.0273
Total 26 2.4504
Table 2. Regression parameters of minimum square method.
Predictor Coefficient Standard error coefficient T p
Constant 0.027 0.010 2.71 0.012
Activity 20.098 0.427 47.11 0.000
Table 3. Results of method repeatability for proteolytic activity.
Parameter Values
Mean, n = 10 0.022 KNPU/mL
Standard deviation 0.001 KNPU/mL
Relative standard deviation 3.8%
The results shown in Table 3 and Table 4 demonstrate that the variation grade of the proteolytic activities (relative standard deviation) using the proposed method are acceptable for both the repeatability and intermedi-ate precision, considering the RE 899/2003 (maximum 5%) [15].
3.6. Accuracy
In order to obtain the accuracy of the method, samples with 3 different known enzymatic activities were pre-pared adding the protease in detergent base solution. The results were obtained calculating the recovery activity in relation to the expected values and are shown in Table 5. Each activity was evaluated in triplicate.
The recovery percentage is acceptable, being in the range of 95% - 105%. Thus, the method can be considered accurate.
4. Conclusions
[image:10.595.164.463.83.267.2]Table 4. Results of method intermediate precision.
Parameter Values
Mean(6, 2) 0.0205 KNPU/mL
Standard deviation (Si) 0.0008 KNPU/mL
Relative standard deviation 4.0%
Table 5. Evaluation of the accuracy of the proposed method.
Added proteolytic activity (KNPU/mL)
Mean recovery proteolytic activity (KNPU/mL)
Relative standard deviation (%)
Mean recovery (%)
0.008 0.008 1.4 101.1
0.016 0.015 2.4 96.8
0.024 0.024 12.6 98.0
onstrated. Therefore, Protazyme tablets can be considered good substrate for protease, resulting in blue color in-tensity with good relation to the enzymatic activity, being adequate for analysis of enzymatic cleaners, including aging studies.
Despite the presented method being validated in specific and controlled conditions, its evaluation demon-strates that the Protazyme tablets have reproducible results and can be used for visual comparison among differ-ent samples in Cdiffer-entral of Sterilization Supply Departmdiffer-ent of hospitals, as the absorbances are measured at a visible wavelength, although in this case there will not be quantitative results.
Thus, the method is appropriate for quantification of proteolytic activities. In addition, the used tablets can be very useful to help in enzymatic detergent evaluation in hospitals, visually comparing products in real use condi-tions.
References
[1] Rutala, W.A. and Weber, D.J. (2013) Disinfection and Sterilization: An Overview. American Journal of Infection Control, 41, S2-S5. http://dx.doi.org/10.1016/j.ajic.2012.11.005
[2] Killeen, S. and McCourt, M. (2012) Decontamination and Sterilization. Surgery, 30, 687-692.
[3] Murdoch, H., Taylor, D., Dickinson, J., Walker, J.T., Perrett, D., Raven, N.D.H. and Sutton, J.M. (2006) Surface De-contamination of Surgical Instruments: An Ongoing Dilemma. Journal of Hospital Infection, 63, 432-438.
http://dx.doi.org/10.1016/j.jhin.2006.02.015
[4] Augustin, M., Ali-Vehmas, T. and Atroshi, F. (2004) Assessment of Enzymatic Cleaning Agents and Disinfectants against Bacterial Biofilm. Journal of Pharmaceutical Sciences, 7, 55-64.
[5] Ransjö, U., Engström, L., Håkansson, P., Ledel, T., Lindgren, L., Lindqvist, A.L., Marcusson, E. and Rudbäck, K. (2001) A Test for Cleaning and Disinfection Processes in a Washer-Disinfector. APMIS, 109, 299-304.
[6] Lopes, L.S., Silva, F.S.Q., Silva, A.S. and Delgado, I.F. (2013) Validation of a UV Spectrophotometric Method for Determination of Proteolytic Activity of Enzymatic Detergents. Journal of Surfactants and Detergents, 16, 445-448.
http://dx.doi.org/10.1007/s11743-013-1440-x
[7] Orgaz, B., Neufeld, R.J. and SanJose, C. (2007) Single-Step Biofilm Removal with Delayed Release Encapsulated Pronase Mixed with Soluble Enzymes. Enzyme and Microbial Technology, 40, 1045-1051.
http://dx.doi.org/10.1016/j.enzmictec.2006.08.003
[8] Agência Nacional de Vigilância Sanitária (Anvisa) (2012) RDC nº 55 de 14 de novembro de 2012—Dispõe sobre os detergentes enzimáticos de uso restrito em estabelecimentos de assistência à saúde com indicação para limpeza de dis-positivos médicos e dá outras providências. Diário Oficial da União, Brasília.
[9] Valls, C., Pujadas, G., Garcia-Vallve, S. and Mulero, M. (2011) Characterization of the Protease Activity of Detergents.
Biochemistry and Molecular Biology Education, 39, 280-290. http://dx.doi.org/10.1002/bmb.20488
[10] Silva, C.J.S.M., Zhang, Q., Shen, J. and Cavaco-Paulo, A. (2006) Immobilization of Proteases with a Water Soluble- Insoluble Reversible Polymer for Treatment of Wool. Enzyme and Microbial Technology, 39, 634-640.
[11] Bendicho, S., Martí, G., Hernández, T. and Martín, O. (2002) Determination of Proteolytic Activity in Different Milk Systems. Food Chemistry, 79, 245-249. http://dx.doi.org/10.1016/S0308-8146(02)00126-7
[12] Sarath, G., Zeece, M.G. and Penheiter, A.R. (2001) Protease Assay Methods. In: Beynon, R. and Bond, J.S., Eds.,
Proteolytic Enzymes, Oxford University Press, New York, 45-51.
[13] Galo, A.L. and Colombo, M.F. (2009) Long Optical Path Length Spectrophotometry in Conventional Double-Beam Spectrophotometers: A Simple Alternative for Investigating Samples of Very Low Optical Density. Química Nova, 32, 488-492. http://dx.doi.org/10.1590/S0100-40422009000200036
[14] Megazyme International Ireland Ltd. Assay of endo-Protease Using Protazyme AK Tablets [Internet].
https://secure.megazyme.com/files/BOOKLET/T-PRAK200_0811_DATA.pdf
[15] Agência Nacional de Vigilância Sanitária (Anvisa) (2003) Resolução RE 899 de 29 de maio de 2003—Guia para Vali-dação de Métodos Analíticos e Bioanalíticos. Diário Oficial da União, Brasília.
[16] International Organization for Standardization (1994) ISO 5725-3. Accuracy (Trueness and Precision) of Measurement Methods and Results—Part 3: Intermediate Measures of the Precision of a Standard Measurement Method. ISO/TC 69 Applications of Statistical Methods. Geneva.
[17] Polonini, H.C., Santos, F.C., Vaz, U.P., Brandão, M.A.F., Raposo, N.R.B. and Ferreira, A.O. (2011) Development and Validation of Analytical Method for Determination of Simvastatin in Capsules. Química Nova, 34, 516-519.