Statistical properties of strongly nonlinear waves within a resonator
V. B. Efimov,1,2,*
A. Ganshin,1and P. V. E. McClintock11
Department of Physics, Lancaster University, Lancaster LA1 4YB, United Kingdom 2
Institute of Solid State Physics RAS, Chernogolovka, Russia 共Received 1 September 2008; published 31 December 2008兲
An experimental investigation of nonlinear waves is reported for a system of one-dimensional second sound waves in superfluid helium within a cylindrical resonator of high Q quality factor. The strong nonlinear dependence of the wave velocity on amplitude distorts the wave shape and leads to the formation of multiple harmonics. The restricted geometry of the resonator results in a discrete energy spectrum, where the energy is transmitted from the driving frequency to the high-frequency edge of the spectrum, where dissipation occurs—a Kolmogorov-like energy distribution. It is found that the main resonance occurs at the driving frequency, and that the next few harmonics are approximately sinusoidal, coherent with the driving force, but that higher harmonics appear to be chaotic and are no longer phase coherent with the drive. For developed turbulence, the probability density function of the high-frequency harmonics is well approximated by a Gauss-ian distribution. Thus, the nonlinear acoustic waves exhibit the statistical properties distinctive of weak turbu-lence, confirming that they can properly be treated in terms of a statistical description.
DOI:10.1103/PhysRevE.78.066611 PACS number共s兲: 43.25.⫹y, 67.25.dk, 47.27.⫺i, 47.35.Rs
I. INTRODUCTION
Turbulence is a far-from-equilibrium state of a nonlinear physical system whose energy distribution extends over many degrees of freedom. The most important physical pro-cess in turbulence is that of energy transformation to heat, via dissipation, starting from the form of energy that is being pumped into the system from an external source. The turbu-lence behavior may be defined by the physical nature of the processes providing the energy pumping and energy transfor-mation. In this sense we may distinguish between kinetic, convectional, and acoustic turbulence. These are described by similar nonlinear equations, but their driving and inertial forces are different in nature, and there are different reasons for the instabilities in the motion of the media, and different processes of energy transformation. In each case, however, the dissipative process is the viscosity of the medium. Ki-netic turbulence in a moving fluid appears when the inertial effects of motion are greatly dominant over viscous forces— the situation of high Reynolds numbers. Convective turbu-lence appears for steady heating of a liquid in a gravitational field, when the ratio between the Archimedean and viscous forces becomes large 共high Rayleigh numbers兲. A similar situation arises in a medium for which with the dependence of wave velocity on amplitude becomes nonlinear for waves of large amplitude. Nonlinear effects then dominate over dis-sipative processes共high acoustic Reynolds numbers兲. This is the case of acoustic turbulence. It is characterized by steep-ening of the wave at either front or back, leading to the formation of wave breakdown and shock waves and to the creation of high-frequency harmonics of an initially har-monic driving force.
For turbulence in an incompressible liquid, for example, kinetic energy is pumped in through external mechanical forcing and is finally dissipated by viscosity. As suggested by
Richardson 关1兴, the kinetic energy at first flows in a dissipation-free manner towards successively smaller length scales. This is called the inertial interval. The cascadelike energy transfer process is eventually terminated by viscous damping, once the Reynolds number approaches unity. On each length scale it is possible to attribute a frequency to the corresponding excitation mode.
The process of energy transformation through the inertial interval is dependent on interactions between the different modes. These are described as weak, giving rise to weak turbulence, in cases when the energy exchange ⌬E in the interaction process is much less than the energy E of each mode. Strong turbulence is the opposite case, where ⌬E
⬃E.
From a theoretical point of view, the simplest case is the turbulence of weakly interacting waves, when there is strong dispersion of waves in the medium but the mutual interac-tions of the wave packets are weak, and the phases of the different waves are consequently random关2,3兴. This approxi-mation allows us to develop a statistical description for a very wide class of pumping forces. The cascade idea ex-plains the basic macroscopic manifestation of turbulence: The mean rate of viscous energy dissipation does not depend on viscosity at large Reynolds numbers.
The statistics of the velocity fluctuation distribution in turbulent flows was quantified by Kolmogorov 关4,5兴, who derived the “−5/3 law” for the energy spectrum at interme-diate scales Ek⬃k−5/3, within the inertial interval of high
Reynolds number flows. In the ideal case, the energy density is homogeneous共statistically invariant under translation兲and isotropic共statistically invariant under rotation and reflection兲 in the three Cartesian velocity dimensions. One-dimensional weak turbulence with a constant energy flux P is described by the relationship关6兴
Ek⬃P1/3k−5/2
in the case ofk=兩k兩afora⬎1, where processes of the type k↔k1+k2+k3 are significant, amounting to say⬎15%
of all interactions. They result in a stationary energy flux to the high-frequency edge of the spectrum where dissipation occurs. The wave amplitude of weak turbulence in the iner-tial interval is expected to exhibit statistics close to Gaussian. One example of weak turbulence is the interaction of waves on the surface of a fluid关7,8兴. The turbulent nature of the surface waves is very close to the case of acoustic turbulence—nonlinear dispersive waves propagate along the fluid surface and form a weak, interacting wave packet sub-ject to negligible dissipation. The statistical behavior of a surface wave can be described within the framework of the random wave theory关9兴.
Strong turbulence corresponds to the case where the as-sumption of weak interaction between harmonic waves does not apply. The time of interaction between different wave modes is then comparable to the time of wave propagation and the waves are cophasal. Intense acoustic waves in media with high nonlinearity, weak dissipation, and weak 共or ab-sent兲 dispersion provide typical examples of strong turbu-lence 关10,11兴. The propagation of dispersionless nonlinear waves is described by Burgers’ equation关12兴 and in a one-dimensional geometry can be written as
du dt +u
du dx=
d2u dx2,
where is the coefficient of dissipation. Strong interactions between the harmonics leads to wave disturbance and the formation of shock waves 关13兴. The origin of the traveling waves is the same—some external force, which in the case of second sound is a periodic heating by selected shape of sig-nal from a generator. Theoretical investigation of the ran-domly forced Burgers’ equation has shown 关14兴 that the ve-locity gradient should have a probability density function
共PDF兲with a power-law dependence on the velocity gradi-ent. If the system is excited by noise, a statistically average random signal is to be expected, which subsequently trans-forms due to the nonlinearity in the wave velocity. Higher pulses merge with smaller ones during the process of wave propagation 关15兴. This reformation drastically changes the statistically average random distribution to a nonequilibrium one.
Any harmonic wave launched into a medium with a non-linear dependence of wave velocity on amplitude must even-tually transform towards sawtooth waves. Its main dissipa-tive processes arise though the formation of shocks 关16兴, with dissipation acting to smooth the breakdown of the wave. The extreme case in the transformation of a harmonic nonlinear wave is a sawtooth shaped wave
u兩共t兲兩02=u0+
兺
n=1 ⬁
1
nsin共nt兲.
The energy spectrum of such a wave is similar to the Kol-mogorov spectrumE⬃−2, though the component harmon-ics of this wave are cophasal and the PDF is a flat uniform distribution. This distribution differs from the case of weakly interacting wave modes, and the random phases of the sinu-soidal modes justifies a statistical approach to the wave in-teractions.
In this paper we report the results of an experimental study of the statistical behavior of nonlinear second sound waves in superfluid 4He in a quasi-one-dimensional resona-tor pumped by a harmonic signal. The resonant conditions allow us to raise the amplitude of the standing wave suffi-ciently to facilitate investigation of the influence of nonlin-earity, but without significant disturbance of the medium by the net heat flux from the emitter. The standing wave in the resonator can be described by the sum of two counterpropa-gating waves periodically pumped by the emitter. Given the strong nonlinearity of the medium, such waves would adopt a sawtooth shape as the limiting case of wave transforma-tion. The PDF of their sum is a nonequilibrium one. In what follows, we study the PDF of such standing waves in a high-Q共quality factor兲resonator and try to understand how strongly the different multiple modes in the resonator are mutually correlated.
II. EXPERIMENTS
The velocity c2of a second sound wave in HeIIdepends strongly on its amplitude␦T and can be approximated as
c2=c20共1 +␣␦T兲,
wherec20is the wave velocity at negligibly small amplitude,
␦T is the wave amplitude, and␣ is the nonlinearity coeffi-cient of the second sound velocity.
There are huge advantages in the use of roton second sound waves in HeII for model studies of acoustic turbu-lence. Within the experimentally convenient temperature range 2.17– 1.5 K the nonlinearity coefficient ␣ can be tuned, just by changing the bath temperature: ␣→−⬁ near the normal-to-superfluid transition T= 2.17 K; ␣ passes through zero at T␣= 1.88 K; and ␣⬃+ 2 K−1 at T⬃1.5 K
关17兴. Thus one can study the dynamics of both nearly linear and strongly nonlinear waves with positive共such as conven-tional sound兲or negative nonlinearity while using exactly the same experimental techniques. The experiments atT=T␣ al-low us to study the propagation of waves of high intensity for the case of a cubic nonlinearity. Such possibilities are unavailable in conventional experiments. Second sound waves have only a tiny dispersion in the lower frequency range below 1 MHz. The fact that the velocity of second soundu20艋20 m/s is more than an order of magnitude less than the velocity of conventional sound in gases and in con-densed media allows us to increase the time resolution of the measurements.
Details of the experimental design have been given else-where关18,19兴but, briefly, the resonator was formed from a quartz tube of diameter ⬃15 mm and lengthL= 70 mm. Its two ends were capped by a thin film heater and supercon-ducting Cu+ Sn bolometer关20兴, respectively. A meander strip heater provided a spatially uniform heat flux. The bolometer had a sensitivity of up to ⬃10 V/K. An external magnetic field was used to adjust the temperature of its maximum sensitivity. The heater was driven by an external sinusoidal voltage generator within the frequency range 0.1– 100 kHz. The frequency of the second sound emitted from the heater
equal to one of the longitudinal resonant frequencies of the cavity. It should be borne in mind in what follows that some radial modes may also have been excited due to small non-idealities of the cell construction. The resonance correspond-ing to the eleventh longitudinal mode was of exceptionally high quality: We note that it coincided closely with the first Bessel solution, and we suspect that this is no coincidence. Thus we do not know the precise nature of the mode excited at the frequency we identify as the eleventh longitudinal resonance.
TheQfactor of the resonator, determined from the widths of resonances at small heat flux densities, wasQ艋1000 for resonant numbers p⬍10, and Q⯝3000 for 30⬍p⬍100. The resonance conditions allow the formation of standing waves of high intensity共␦Tup to a few mK兲with excitation levels W艋50 mW/cm2. The Mach number can reach M =␣␦T⬃10−4– 10−2, and the acoustic Reynolds number, de-fined关21兴as Reac=␣c20共␦T/x兲/⬃␣␦T, can reach a value up to 100.
III. RESULTS AND DISCUSSION
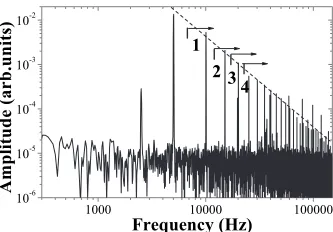
Given the highQof the resonator, a sufficiently high sinu-soidal drive amplitude leads to the formation of multiple discrete harmonics. Energy is thus transformed, moving from the driving frequency towards the high-frequency edge of the spectrum, where it then dissipates due to viscosity and im-perfections of the resonator, i.e., a Kolmogorov-like cascade as shown in Fig.1. Such behavior is a distinctive feature of turbulent processes.
We determined the statistics of standing waves in the resonator experimentally at T= 2.08 K by analysis of a de-veloped acoustic cascade with multiple harmonics 关22,23兴. The main harmonic comes of course from the excitation by the driving signal and is cophasal with the pumping excita-tion. The driving signal may affect the first few higher har-monics until the mutual interactions of the higher modes deemphasize the influence of the phase of the pumping sig-nal. We therefore used a digital filter to eliminate the lower
harmonics and computed the PDF of the rest of the signal. The resultant changes in shape of the signal are shown in Fig. 2, the corresponding changes in its PDF are shown in Fig.4, and Fig.3for those in the filtered spectra.
It is evident that, as expected, the main harmonic is de-fined by the resonant driving signal and corresponds to a strongly distorted sine wave. The PDF of its main harmonic is similar to that of a sine wave. The driving signal also influences directly the next first harmonics, but fades out for the higher harmonics. Filtration of the low-frequency har-monics transforms a PDF from one that is close to that of a sine wave to the Gaussian-like distribution shown in Fig.4, which is characteristic of arbitrary wave fields. The intensity of noise in the measurement system was an order of magni-tude less than the random fluctuations in second sound inten-sity. Although the PDF of the signal was approximately Gaussian after removal of the lower harmonics, some asym-metry was visible in all measurements, as shown in Fig. 4. Its origin is evident in the nonsinusoidal shape of the re-corded signals as shown, e.g., in Fig.2共a兲. The heating peak
[image:3.609.90.257.66.182.2]is accompanied by distinctive breakdowns at the front or tail FIG. 1. Power spectrum of a second sound standing wave
show-ing the amplitudes of the multiple harmonics in developed acoustic turbulence. The resonator was pumped at frequency fd= 5030 Hz corresponding to the 51st resonance; the driving amplitude from the generator was UG= 5 V at fd/2 共heat flux W= 25 mW/cm2兲. The arrows indicate the frequencies below which the initial signal was cut by digital filtration. The peak at f⬃2.5 kHz is an artifact cor-responding to direct electrical pick-up of the driving signal.
[image:3.609.354.519.71.180.2]FIG. 2. Second sound wave signal before and after low-frequency filtration. The cavity was excited at its 33rd resonance withfd= 3227 Hz andW= 25 mW/cm2.共a兲Original signal.共b兲 Af-ter removal of the main harmonic.共c兲With retention of only the 4th and higher harmonics. 共d兲With retention of only the seventh and higher harmonics.
[image:3.609.348.519.522.661.2]depending on the sign of the nonlinear coefficient ␣. Com-parable asymmetry was observed for first sound resonances in closed tubes关24兴, as well as for heating and cooling shock waves in superfluid helium 关25兴 and measurements of the PDF of capillary surface waves关9兴. In the present case, be-cause the minima in␦T are more rounded than the maxima, there is a corresponding asymmetry in the PDF. It decreases for the higher harmonics but does not completely disappear within the experimentally accessible range.
The extent to which the Gaussian distribution is devel-oped corresponds to the extent of development of the turbu-lent energy cascade: The more developed the energy cascade, the closer the PDF becomes to a Gaussian distribution. Fig-ure5共a兲shows the PDF after removal of the main harmonic
共circles兲, and after removal of both it and the second har-monic 共triangles兲 which clearly brings it closer to being Gaussian in shape. Figure5共b兲for a higher excitation exhib-its Gaussian behavior for all harmonics except the main one. Second sound waves in helium have an approximately linear dispersion ratio⬀k. The quasi-one-dimensional lon-gitudinal waves in the resonator have three- and four-wave interactions. The energy transformation to higher frequencies
共Kolmogorov-like cascade兲is the result of three-wave inter-action: d+1→2, causing the amplitudes of the higher harmonic to increase towards their equilibrium values.
The increasing amplitudes of the higher harmonics leads to intensive interactions between the independent modes within the framework of three-or four-wave processes d
+1↔2 andd+1↔2+3; there will be similar inter-actions not involving waves at the driving frequency. Such processes will lead to substantial mixing of the phases of the higher frequency modes, which will therefore be less af-fected by that of the driving force.
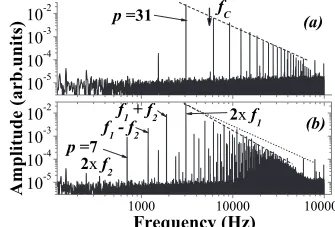
We also investigated the effect of increasing the number of wave interactions by adding an additional excitation to the system. Pumping the system by two signals from two sepa-rate sine wave generators launches four waves 2⫻f1G, 2
⫻f2G,f1G−f2G, and f1G+f2Ginto the resonator. With
pump-ing only at the 31st resonance, a developed cascade was formed as shown in Fig. 6共a兲. The addition of a weak
exci-tation at a lower frequency changes the picture substantially.
The interactions of the resultant four waves give rise to nu-merous combinational signals, as shown in Fig. 6共b兲.
[image:4.609.352.517.66.319.2]Fur-thermore, interactions between the main and combinational waves lead to attenuation of the developed turbulent cascade and change the distribution function within the inertial inter-val 关26兴. Suppression of the main turbulent cascade is indi-cated by a change in the frequency dependence of the spec-tral maxima from A⬀f−1.79 in 共a兲 to A⬀f−2.18 in 共b兲. This phenomenon is connected with a redistribution of the energy FIG. 4. PDF of the higher harmonics plotted in coordinates
[image:4.609.87.257.71.194.2]cho-sen to reveal a Gaussian distribution: A logarithmic ordinate and a squared abscissa. A Gaussian would yield two straight lines of equal but opposite slope. The䊊points correspond to cutting frequencies below 15 kHz and the ⫹ to cutting below 20 kHz. fd= 3227 Hz, 33rd resonance,UG= 5 V,W= 25 mW/cm2.
FIG. 5. Increasingly Gaussian behavior as turbulent processes develop.共a兲At an excitation ofW= 9 mW/cm2after removal of the main harmonic䊊, and removal of the main and second harmonics
䉱.共b兲AtW= 25 mW/cm2. The⫹are the PDF of the initial signal. The filled circles show the PDF after removal of the main harmonic, and the䊊are the same points with a 5⫻abscissa expansion. The cavity was driven at its 11th resonance with fd= 1060 Hz.
[image:4.609.348.516.535.649.2]flux between a large number of additional interacting combi-national modes. A similar effect was observed for the system of surface waves on liquid hydrogen 关27兴.
The appearance of a set of combinational waves, and the increasing number of interactions between the different har-monics, lead to the formation of a Gaussian-like PDF in the higher spectral range. The result of cutting the spectrum of the signal below fc= 5900 Hz is shown in Fig. 7. Note that
the frequency cut共arrows in Fig. 6兲is made below the sec-ond harmonic of the developed cascade with a single excita-tion signal.
Finally, we enter two caveats in relation to the above dis-cussion. First, we note that the resonant frequency of the forcing signal differs slightly from the frequency of free os-cillation due to the presence of the small heat flux from the heater 关28兴. Thus, the wavelength of the driving signal at resonance is not exactly equal to the wavelength of the trav-eling wave corresponding to the eigenfrequency in the cavity and the integer length of higher harmonics. Correspondingly, the influence of the phase of the driving force diminishes in the higher harmonics. The effect is clearly visible for our so-called “eleventh resonance”共Fig.5兲, which we suspect is coupled to the first radial resonance 共see above兲: The fre-quencies of the fundamental radial mode and higher radial modes are incommensurate. Second, the differing velocities corresponding to the different amplitudes of the harmonics in
the cascade mean that the phases and resonant frequencies of the different modes are slightly different from those ex-pected.
IV. CONCLUSIONS
The main conclusion is that the removal of low-frequency components in the signal from turbulent second sound in our resonator yields probability densities with Gaussian-like dis-tributions: With successive removal of the lower harmonics, the strong influence of the driving signal 共with cophasal be-havior兲weakens, and the PDF changes from the shape cor-responding to a sine wave towards a Gaussian distribution, representing the statistical average of random multiple har-monics. It was already known that the Kolmogorov-like power-frequency distribution arising from a high-intensity pumping signal takes the formAi⬀−n, wheren⬃1.5. More intense driving yields a lower value of the powern, a longer inertial interval, and relatively larger amplitude of higher harmonics 关23兴. We have also found that, under some cir-cumstances, an inverse energy cascade can exist, carrying wave energy towards lower frequencies 关29兴. We have now shown that, although the driving signal exerts a strong ence on the first few harmonics in the resonator, this influ-ence quickly dies out in the higher harmonics where the PDFs become nearly Gaussian, apparently corresponding to chaoticlike behavior. Such phenomena are to be anticipated in wave turbulent systems quite generally but, to our knowl-edge, have not previously been demonstrated experimentally. Pumping the system with an additional weak excitation leads to the formation of numerous combinational waves, and a partial suppression of the main energy cascade. The interaction between the combinational waves and the main driving signal shifts the region with a Gaussian-like PDF towards lower frequencies. Thus, the form of acoustic turbu-lence revealed by the experiments apparently exhibits the features of both strong wave interaction and weak turbu-lence.
ACKNOWLEDGMENTS
We acknowledge valuable discussions with G. V. Kolma-kov, A. A. Levchenko, E. A. Kuznetsov, V. Krasnosselskikh, V. S. L’vov, V. V. Lebedev, and L. P. Mezhov-Deglin. The work was supported by Engineering and Physical Sciences Research Council共UK兲and by the Royal Society of London.
关1兴L. F. Richardson, Weather Prediction by Numerical Process 共Cambridge University Press, Cambridge, 1922兲.
关2兴V. Zakharov, G. Falkovich, and V. L’vov,Kolmogorov Spectra of Turbulence I共Springer, Berlin, 1992兲.
关3兴V. E. Zakharov and N. N. Filonenko, J. Appl. Mech. Tech. Phys. 8, 37共1967兲.
关4兴A. N. Kolmogorov, C. R.共Dokl.兲Acad. Sci. URSS 31, 301 共1941兲.
关5兴A. N. Kolmogorov, C. R.共Dokl.兲Acad. Sci. URSS 31, 538 共1941兲.
关6兴V. E. Zakharov, O. A. Vasilyev, and A. I. Dyachenko, JETP Lett. 73, 68共2001兲.
关7兴I. P. D. De Silva and H. J. S. Fermando, Phys. Fluids 6, 2455 共1994兲.
[image:5.609.88.256.68.187.2]关8兴E. Henry, P. Alstrom, and M. T. Levinsen, Europhys. Lett. 52, 27共2000兲.
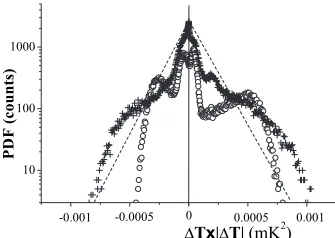
FIG. 7. Effect on the PDF of a second sound signal of adding a second weak forcing. The high-frequency band-pass filter removed frequencies below fC= 5900 Hz, thus eliminating the fundamental frequency of the main turbulent cascade as illustrated in Fig.6. The
关9兴E. Falcon, C. Laroche, and S. Fauve, Phys. Rev. Lett. 98, 094503共2007兲.
关10兴B. B. Kadomtsev and V. I. Karpman, Sov. Phys. Usp. 103, 193 共1971兲.
关11兴S. N. Gurbatov, A. I. Saichev, and G. Yakushkin, I, Sov. Phys. Usp. 141, 221共1983兲.
关12兴J. M. Burgers, Proc. R. Acad. Sci. Amsterdam 43, 2共1940兲. 关13兴V. B. Efimov, G. V. Kolmakov, A. S. Kuliev, and L. P.
Mezhov-Deglin, Fiz. Nizk. Temp. 24, 81共1998兲.
关14兴Weinan E and E. Vanden Eijnden, Phys. Rev. Lett. 83, 2572 共1999兲.
关15兴O. V. Rudenko, Sov. Phys. Usp. 149, 413共1986兲. 关16兴O. V. Rudenko, Sov. Phys. Usp. 163, 1011共1995兲.
关17兴A. J. Dessler and W. M. Fairbank, Phys. Rev. 104, 6共1956兲. 关18兴I. Y. Borisenko, V. B. Efimov, and L. P. Mezhov-Deglin, Fiz.
Nizk. Temp. 14, 1123共1988兲.
关19兴V. B. Efimov, A. N. Ganshin, P. V. E. McClintock, G. V. Kol-makov, and L. P. Mezhov-Deglin, J. Low Temp. Phys. 145, 155共2006兲.
关20兴M. Giltrow, M. J. Boylett, N. S. Lawson, A. Hammiche, O. J. Griffiths, J. K. Wigmore, and V. B. Efimov, Meas. Sci.
Tech-nol. 14, N69共2003兲.
关21兴H. Davydowitz, Y. L’vov, and V. Steinberg, Physica D 84, 635 共1995兲.
关22兴V. B. Efimov, A. N. Ganshin, P. V. E. McClintock, G. V. Kol-makov, and L. P. Mezhov-Deglin, J. Low Temp. Phys. 148, 251共2007兲.
关23兴G. V. Kolmakov, V. B. Efimov, A. N. Ganshin, P. V. E. Mc-Clintock, and L. P. Mezhov-Deglin, Phys. Rev. Lett. 97, 155301共2006兲.
关24兴W. Chester, J. Fluid Mech. 18, 44共1964兲.
关25兴G. V. Kolmakov, V. B. Efimov, A. S. Kuliev, and L. P. Mezhov-Deglin, Czech. J. Phys. 46, S1, 83共1996兲.
关26兴P. V. E. McClintock, V. B. Efimov, A. N. Ganshin, G. V. Kol-makov, and L. P. Mezhov-Deglin, J. Low Temp. Phys. 150, 394共2008兲.
关27兴L. V. Abdurakhimov, M. Yu. Brazhnikov, and A. A. Levchenko, J. Low Temp. Phys. 150, 431共2008兲.
关28兴D. Greywall and G. Ahlers, Phys. Rev. A 7, 2145共1973兲. 关29兴A. N. Ganshin, V. B. Efimov, G. V. Kolmakov, L. P.