Performance and Evolution of Routing Protocol DSR,
AODV and AOMDV in MANET
Neha Trivedi MTECH Student, Electronics &
Communication Engineering Department, NRI Institute Of Information Science & Technology, Bhopal
India
G.Kumar Professor, Electronics & Communication Engineering Department,NIRT, Bhopal India
Teena Raikwar
Assistant Professor Electronics & Communication Engineering Department,NRIIST, Bhopal India
ABSTRACT
A Mobile ad hoc network is a collection of various number of mobile nodes connected through wireless links forming a temporary network without any type of fixed topology, centralized access point and infrastructure. A variety of routing protocols have been proposed and several have been extensively simulated. In this paper we compared the performance of AODV, AOMDV AND MAODV. AOMDV incurs more routing overhead and packet delay than AODV but it had a better efficiency when it comes to number of packets dropped and packet delivery.
Keywords:Ad-hoc networks; routing protocols; MANET, AOMDV, AODV, DSR, RREQ, RREP, RERR
1.
INTRODUCTION
A mobile ad-hoc network or MANET is a collection of mobile nodes sharing a wireless channel without any centralized control or established communication backbone. They have no fixed routers with all nodes capable of movement and arbitrarily dynamic. These nodes can act as both end systems and routers at the same time.
In on-demand or reactive routing protocols, the routes are created on requirement basis. To find a path from source to destination, it invokes the route discovery mechanisms. Only the routes that are currently in use are maintained, thereby maintaining low control overhead and reducing the network load since a small subset of all available routes is in use at any time. Performance can be adversely affected by high route discovery latency and frequent route discovery in dynamic networks. This can be reduced by computing multiple paths in a single route discovery attempt. Multiple paths can be formed for both traffic sources and intermediate nodes with new routes being discovered only when needed, reducing route discovery latency and routing overheads. Multiple paths can also balance network load by forwarding data packets on multiple paths at the same time. In our paper, we concentrate on two on-demand routing protocols: AODV and AOMDV.
2.
RELATED WORK
There are many performance analysis works done by many researchers so far, but very few did the simulation with realistic mobility model. The mobility generator that is given in NS-2 is good for MANET. We need more realistic mobility model. Also in performance comparison few factors are used like varying number of connections.
3.
ROUTING PROTOCOL
Routing protocols are required to ensure multihop communications. Indeed, if nodes are within the range of each other, a routing protocol is not necessary. Nodes can move or would communicate with a node out of their range. Intermediate nodes are needed to organize the network which
takes care of data transmission. Routing protocols must choose some criteria to make routing decisions, for instance the number of hops, latency, transmission power, bandwidth, etc. Routing protocols are divided into two basic classes:
Proactive routing protocols
2) Reactive routing protocols
(1) AODV Routing Protocol
Ad-hoc On-Demand Distance Vector is based on the Bellmann-Ford distant vector algorithm for ad-hoc networks. When a node needs to send a packet to a destination. AODV uses a mechanism of Route Discovery to built a route. It uses also a Route Maintenance for errors. Route Discovery consists of RREQ (Request) and RREP (Reply) when a node would like to send a packet. Route Maintenance consists of RERR messages, HELLO messages and precursor lists. Sequence numbers provide fresh routes and avoid routing loops. All nodes monitor their own neighbours. When a node, in an active route, gets lost, a route error message (RERR) is sent to notify the link lost. Nodes use a HELLO message to inform only neighbours that the link is still alive. When a node receives a HELLO message it refreshes its lifetime from the neighbour information in the routing table.
(2) AOMDV Routing Protocol
The Ad Hoc On-demand Multipath Distance Vector Routing is a improvement of AODV. Contrary to AODV, AOMDV discovers multiple paths between the source and the destination during the route discovery operation. It is more efficient for highly dynamic ad hoc networks since errors occur frequently. The AOMDV protocol has two main principles:
_ a route update rule to establish and maintain multiple loop-free paths at each node.
_ a distributed protocol to find link-disjoint paths.
Multipath routing protocols, such as AOMDV, try to reduce the high latency of route discovery which can decrease performances.
(3) DSR Routing Protocol
route maintenance mechanism. The connection setup delay is higher than in table driven protocols. In static and low-mobility, DSR behaves with high efficiency. But due to source-routing, routing overhead increases when mobility and path length increase too, so performance decreases quickly.
4.
METHODOLOGY
In the proposed algorithm, multipath is discovered and maintained in advance at the time of route discovery, but instead of considering each and every RREQ at each node it will consider only specified number of requests for particular destination. At destination or intermediate node, RREP is sent to every received RREQ from unique node. Thus more than one path is maintained but the best path in terms of less hop count will be used for data transfer, while the other paths are stored in cache, which will be used while link breakage.
Proposed algorithm also has three phases, Route Discovery, Data Sending and Route Maintenance
(1) Route Discovery
Route discovery is initiated by the source node when it has some data to send and does not have the route table entry for
the destination. It broadcasts RREQ packet to its neighbors. When Intermediate node gets RREQ, it will check for the route table entry, for the destination mentioned in the RREQ packet. If it finds route table entry for the destination in its route table, it will generate RREP packet and send it to the source. If it doesn’t have the route table entry for that destination it will rebroadcast the RREQ packet, after updating the route entry for the source i.e. reverse path setup. At each node, it will consider first RREQ_THRESHOLD number of RREQ packet which represent shortest path and for that it maintains one counter for each RREQ_ID. When RREQ packets reach at the destination, it will generate RREP packet for each RREQ packet, and unicast it to the source. At each intermediate node, route to the destination will be established by recording the next hop to the destination. Flow of this phase can be well understood by figure 1.
(2) Data Sending
Data will be sent as soon as the first RREP packet comes to the source and path is established according to the packet.
Figure: 1 Basic Flow Diagram of Route Discovery Phase of proposed System (3) Route Maintenance
If a link break is detected, it will check for the unreachable destination and if any, it will broadcast a Route Error (RERR) packet. As we have alternate paths, when data packets arrive,
Figure: 2 Basic Flow Diagram of Route Maintenance Phase of Proposed System
(4) Network Simulator Tools
There are many simulators such as NS-2, OPNET Modeler, GloMoSim, OMNeT++ etc. In this paper, we use
NS-2.34. NS is an object oriented, discrete event driven network simulator developed at UC Berkely written in C++ and OTcl.
(5) Performance Metrics
In our experiment we mainly focus on three important performance metrics. There are as follows.
•Drop ratio:
The ratio of the data packets dropped to those generated by the CBR sources.
DROP RATIO= ∑CBR dropped / ∑CBR sent Eq. (1)
•Average End to end data delay:
This is average end to delay of all successfully transmitted data packets from source to destination. Formula for average end to end delay is:
Avg end to end delay = ∑( CBR sent time – CBR received time) / ∑ CBR received Eq. (2)
• Normalized Routing Load(NRL)
NRL is number of routing packets transmitted per data packet delivered at the destination. Formula for NRL is:
NRL = ∑ routing packet / ∑ CBR received Eq. (3)
(6) Simulation and Performance Evaluation
To simulate routing protocols we are using ns-2.34 under LINUX Mint environment. We have followed the general idea of previous study of simulation. In ns-2.34, the RREQ packets are treated as broadcast packets in the MAC. RREP and RERR and data packets are all uni-cast packets with a specified neighbor as the MAC destination.
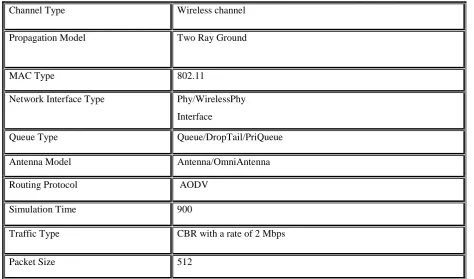
(7) Simulation Parameters
Table 1. Network AND simulation parameters those are fixed
Channel Type Wireless channel
Propagation Model Two Ray Ground
MAC Type 802.11
Network Interface Type Phy/WirelessPhy
Interface
Queue Type Queue/DropTail/PriQueue
Antenna Model Antenna/OmniAntenna
Routing Protocol AODV
Simulation Time 900
Traffic Type CBR with a rate of 2 Mbps
Packet Size 512
(8) Performance under the Varying Number of Nodes
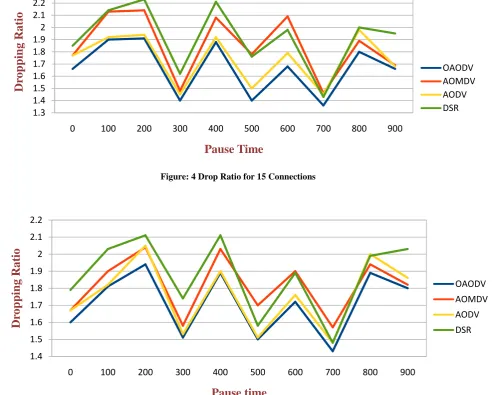
Figure 3,4 and 5 shows the relationship between Drop Ratio and Pause time. Pause time indicates mobility.In case of lower mobility, AODV performs better than AOMDV and DSR. Theoretically it should not be the case, i.e. in stable network also AOMDV should perform better or equal than AODV. While in case of higher mobility, AOMDV performs better than AODV and DSR. It is because at the higher mobility, link breaks occur more frequently, and so multiple stored
paths can be used. However it can be seen from the graph that O-AODV performs better than AODV, DSR and AOMDV because it has more path than AODV.
1.3 1.4 1.5 1.6 1.7 1.8 1.9 2 2.1 2.2 2.3 2.4 2.5
0 100 200 300 400 500 600 700 800 900
Dr
op
p
in
g
Rat
io
Pause time
OAODV
AOMDV
AODV
[image:4.595.122.366.511.700.2]In general with increase in pause time (decrease in mobility), Drop ratio should be decreased. But we can see four unusual spikes in all three graphs for all four protocols, i.e. 100, 400, 600 and 800. It is because of random unpredictable behaviour of the node.
[image:5.595.67.536.131.292.2]Further it can be seen from the graph than behaviour of all three protocols is same.
[image:5.595.59.554.141.536.2]Figure: 4 Drop Ratio for 15 Connections
Figure: 5 Drop Ratio for 20 Connections
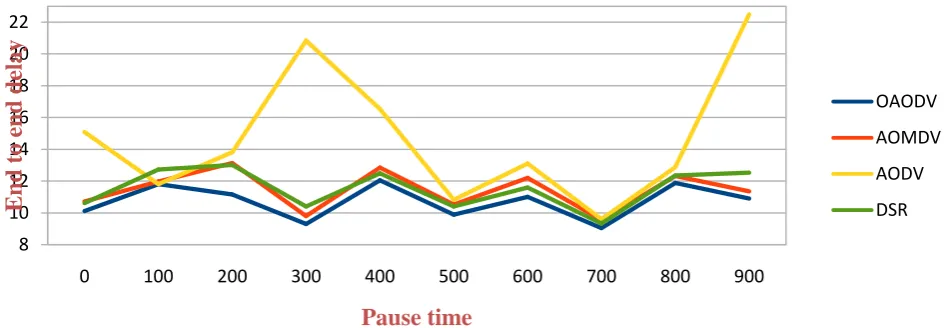
Fig 6, 7 and 8 show average end-to-end delay for 10 15 and 20 Connections respectively. As seen in all the plots the end-to-end average delay is continuously decreasing with increase in pause time as compare to basic AODV, AOMDV and DSR.
The reason behind that is at lower pause time, the failure of the route recovery attempts are more therefore the number of packets transferred between the source and destinations are also more. It causes time taken to recover the route at lower pause time is more.
1.3 1.4 1.5 1.6 1.7 1.8 1.9 2 2.1 2.2 2.3
0 100 200 300 400 500 600 700 800 900
Dr
op
p
in
g
Rat
io
Pause Time
OAODV AOMDV AODV DSR
1.4 1.5 1.6 1.7 1.8 1.9 2 2.1 2.2
0 100 200 300 400 500 600 700 800 900
Dr
op
p
in
g
Rat
io
Pause time
[image:5.595.60.549.345.537.2]Figure: 6 Average End to End Delay For 10 Connections
Figure: 7 Average End to End Delay for 15 Connections
[image:6.595.76.544.100.251.2]We find that end-to-end average delay is lower in OAODV than basic AODV, AOMDV and DSR protocol.
Figure: 8 Average End to End Delay for 20 Connections
8 9 10 11 12 13 14 15 16
0 100 200 300 400 500 600 700 800 900
E
n
d
to e
n
d
d
elay
Pause time
OAODV
AOMDV
AODV
DSR
8 10 12 14 16 18 20
0 100 200 300 400 500 600 700 800 900
E
n
d
to e
n
d
d
elay
Pause time
OAODV
AOMDV
AODV
DSR
8 10 12 14 16 18 20 22
0 100 200 300 400 500 600 700 800 900
E
n
d
to e
n
d
d
elay
Pause time
OAODV
AOMDV
AODV
[image:6.595.58.532.512.676.2]mobility, which in turn reduces the requirements of route discovery. At lower pause time, (pause time 0) link layer reports high route failure to its upper layer.
We see that AOMDV has more routing overhead that AODV for any range of pause time. This is attributed to the different mechanism of AODV and AOMDV. Due to AODV being a
unipath routing protocol, once a link breaks the packet delivery along that route stops. But AOMDV is a multipath routing protocol and it searches for alternate paths if the current route breaks by flooding the network with RREQ packets. Hence AOMDV incurs more routing overhead than AODV.
Figure: 9 Normalized Routing Load For 30 Connections
Figure: 10 Normalized Routing Load For 30 Connections
0 2 4 6 8 10
0 100 200 300 400 500 600 700 800 900
NRL
Pause Time
OAODV
AOMDV
AODV
DSR
0 1 2 3 4 5 6 7 8 9
0 100 200 300 400 500 600 700 800 900
NRL
Pause Time
OAODV
AOMDV
AODV
Figure: 11 Normalized Routing Load For 30 Connections
However, fig. also depicts some typical conditions, in which, the routing load is seen to be increased when pause time is high. A detailed analysis of simulation-based experiments under this condition revealed that the routing load increases because of the rise in number of Route Request packets (with ttl value of 0) being dropped. This led to more frequent RREQ and RERR packets increased as compared to the previous shorter pause time.
This compels for the initiation of fresh route discovery causing increase in routing load. The specific conditions exhibiting this behaviour are occurring because of a typical location of nodes in MANET, which is random in nature. However in an average the routing load of the O-AODV is lower than that AODV, AOMDV and DSR.
5.
CONCLUSION
The proposed algorithm will generate slightly higher overhead than that of AODV for first time at the time of route discovery. But once route discovery is over, it will be beneficial for route maintenance. And this overhead overcomes the route overhead generated at the time of link failure.
i.e. Normalized routing overhead , End-to-End Delay and dropped ratio for O-AODV will be lower than that of AODV , AOMDV and DSR.
The Proposed algorithm is better in case of moderate mobility and moderate to higher traffic. Because of its multipath, at the time of link failure, it will not create overhead. And once the data transfer is started, it will not be interfered by link failure.
6.
REFERENCES
[1] S.A Ade and P.A. Tijare, “Performance Comparison of AODV, DSDV, OLSR, DSR rouitng protocols in Mobile Ad hoc Networks”, International Journal of Information Technology and Knowledge Management, Vol. 2, no. 2, pp. 545-548, July – December 2010.
[2] V ramesh, Dr. P. Subbaiah, N. Koteswar Rao and M. Janardhana Raju, “Performance Comparison and analysis of DSDV and AODV for MANET”, INFOCOM 2000. Vol. 02, no. 02, pp. 183-188, 2010.
[3] S.R.Biradar, Koushik Majumder, Subar Kumar Sarkar, and Puttamadappa C, “Performance Evaluation and Comparison of AODV and AOMDV”, (IJCSE) International Journal on Computer Science and Engineering. Vol. 02, no. 02, pp. 373-377, 2010.
[4] A. Boukerche, L. Mokdad, and M. Sene, “Call admission control performance analysis in mobile networks using stochastic well-formed petri nets,” IEEE Transactions on Parallel and Distributed Systems, vol. 22, no. 8, pp. 1332–1341, 2011.
[5] A. N.Thakare and M. M. Y. Joshi, “Performance analysis of aodv & dsr routing protocol in mobile ad hoc networks,” IJCA Special Issue on MANETs, pp. 211– 218, 2010, published by Foundation of Computer Science.
[6] (2013) Mobile Ad Hoc Networks MANET. [Online]. Available: http: //www.ietf.org/html.charters/manet charter.html
[7] (2013) The Network Simulator NS-2. [Online]. Available: http://www.isi.edu/nsnam/ns/
0 2 4 6 8
0 100 200 300 400 500 600 700 800 900
NRL
Pause Time
OAODV
AOMDV
AODV