2020 4th International Conference on Modelling, Simulation and Applied Mathematics (MSAM 2020) ISBN: 978-1-60595-674-9
Optimization of Stock Multifactor Model based on Machine Learning
Yue WANG, Yu-xue WANG and Xiao-ping REN
School of Mathematics and Statistics, Northeast Petroleum University, High-Technology District, Daqing city, Heilongjiang Province, China
*Corresponding Author
Keywords: Machine learning, Multifactor model, Sharp ratio, Fuzzy clustering.
Abstract. In recent years, with the development of the financial market in China, in the background of information and big data, the quantitative products in the domestic market are gradually increasing. Multifactor model is an important stock selection model, its advantage is that it can synthesize a lot of information and get a stock selection result, which has a wide range of applications in the stock market. The purpose of this paper is to find some factors most related to the rate of return by establishing a multifactor model, and to select different weight factors to construct a stock selection model. The article is intended to select the stock combination to make it greater than or equal to the market index in the future, and to obtain the optimal benefit. Compared with the traditional linear multifactor model, machine learning algorithm can find more precise market signals through the nonlinear expression of factors, in order to obtain more robust excess returns.
Introduction
The U. S. economist, Eugene Fama (1993), found that most of the U.S. stock market could be explained by market value, value of assessment, and market earnings by studying the recent decades of data in the U.S. market [1]. Mohanram (2004) improves the multifactor quantitative stock selection model, selects 9 indexes from the three parts of growth stability, profitability and financial conservatism, and scores the top 1 and 5 stocks of PB [2].
In China, investors in the market will judge the rise and fall of stocks according to some factors. When a group of traders adopt a factor at the same time, it will cause the factor to be effective, and there is a causality between these factors and the rate of return at the same time. The traditional multifactor model based on financial factors (such as market value, price-earnings ratio, etc.) and long-cycle volume-price factors (such as monthly trading volume, monthly reversal, etc.) has obtained more robust excess returns in A-share market. The purpose of the multifactor model is to study which factors in the market play a great role in the final rate of return, and to count their performance at different stages of the market. Machine learning algorithm plays a very important role in the research of artificial intelligence, and its application has been all over all branches of artificial intelligence. Zhang Chenyu (2017) uses the aggregation function of data mining technology to analyze and predict the stock. The results show that the yield growth of the selected stock by this method is larger than that of the Shanghai and Shenzhen 300 index in the same period [3].
Research Significance and Ideas
In quantitative stock selection strategy, multifactor strategy has always been a main research direction. The factors used in the strategy are usually calculated by mathematical formulas, so the factor data can be understood as a signal to define the criteria for the selection of stocks, the purchase and sale of stocks and the decision of trading stock share.
value, which has an impact on the modeling. Therefore, firstly, Matlab code is used to obtain the factor data of A-share market stock in Auto-Trader software for data processing and analysis. Secondly, according to the processed factor data, the clustering algorithm is used to classify the factors. Then the factor validity test of the factors in each category is carried out, and the factors that optimize the Sharp ratio are selected [4].
Research on Stock Selection Strategy
Selection and Preprocessing of Data
In this paper, the stock factor data of China's A-share market from January 1, 2016 to September 30, 2018 are selected as the research object, and the data are extracted by Matlab programming built into Auto-Trader software. In the preliminary extracted factor data, it is necessary to process the data because of the influence of null value and missing value.
(1) Null value: In the extracted factor data, some factors cannot be calculated, the data in the time interval is null value, if we continue to use the data containing null value, the process of data mining will fall into chaos, resulting in unreliable or wrong output results, which is not meaningful for analysis and research, so the factor is eliminated and no research is done.
(2) Missing value: The existence of missing values loses a lot of useful information in the process of data mining, and makes the uncertainty of the system more significant. Missing value treatment includes deletion and filling. However, the deletion method is valid only if the deleted factor with missing value is very small compared with the amount of data of all factors. At the same time, because the factor is deleted, the information hidden in these factors is also discarded. The filling method is based on the principle of statistics and fills the null value with a specific value to make the data complete. In this paper, we consider setting a threshold of missing value of factor data, selecting filling method within threshold range and deleting method beyond threshold range, so as to avoid the output of unreliable conclusion.
Sharp Ratio
Sharp ratio is used to measure the relative performance of product risk and return. When the Sharp ratio is positive, it shows that the average rate of return of the product in the weighing period exceeds the risk-free interest rate, and the higher the Sharp ratio is[5], the higher the risk return per unit risk of the product is.
Generally, the one-year fixed interest rate is used as the risk-free rate of return. The formula is:
m
REX
REX S
. (1)
Of which, Smindicates the Sharp ratio of a unit time product, REX indicates the average excess
rate of return per unit time, REX indicates the standard deviation of excess returns per unit time.
The average calculation formula for excess yield is:
1
1 n
t f t
REX R R
n
. (2)Of which, Rt indicates the sequence data of the product yield, Rf indicates market risk-free
rate of return, n indicates the number of yields determined by time frequency. Calculation formula of annualized Sharp ratio:
Cluster Analysis
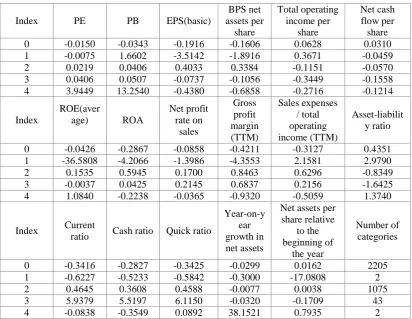
Table 1. Fuzzy clustering results.
Index PE PB EPS(basic)
BPS net assets per share Total operating income per share Net cash flow per share 0 -0.0150 -0.0343 -0.1916 -0.1606 0.0628 0.0310 1 -0.0075 1.6602 -3.5142 -1.8916 0.3671 -0.0459 2 0.0219 0.0406 0.4033 0.3384 -0.1151 -0.0570 3 0.0406 0.0507 -0.0737 -0.1056 -0.3449 -0.1558 4 3.9449 13.2540 -0.4380 -0.6858 -0.2716 -0.1214
Index
ROE(aver
age) ROA
Net profit rate on sales Gross profit margin (TTM) Sales expenses / total operating income (TTM) Asset-liabilit y ratio
0 -0.0426 -0.2867 -0.0858 -0.4211 -0.3127 0.4351 1 -36.5808 -4.2066 -1.3986 -4.3553 2.1581 2.9790 2 0.1535 0.5945 0.1700 0.8463 0.6296 -0.8349 3 -0.0037 0.0425 0.2145 0.6837 0.2156 -1.6425 4 1.0840 -0.2238 -0.0365 -0.9320 -0.5059 1.3740
Index Current
ratio Cash ratio Quick ratio
Year-on-y ear growth in net assets
Net assets per share relative to the beginning of the year Number of categories
0 -0.3416 -0.2827 -0.3425 -0.0299 0.0162 2205 1 -0.6227 -0.5233 -0.5842 -0.3000 -17.0808 2 2 0.4645 0.3608 0.4588 -0.0077 0.0038 1075 3 5.9379 5.5197 6.1150 -0.0320 -0.1709 43 4 -0.0838 -0.3549 0.0892 38.1521 0.7935 2
Redundancy Factor Elimination Model
Among the five kinds of factors obtained by clustering, different subclass factors may appear logical intersection and information overlap, that is, factor collinearity, due to the fact that the internal driving factors are about the same. If we continue to do the factor stock selection strategy, the selected stock portfolio will have a high consistency in the composition and return of individual stocks, so some of the factors need to be eliminated, and only the factors with the highest discrimination and the best return in the same category of factors will be retained.
Taking the first category as an example, it is necessary to select k effective subclass factors for a total of 21 months. Firstly, according to the size of different factors, the stocks are divided into 356 combinations (each 10 stocks are a group), and the n combinations under different factors are scored according to the combination rate of return, and the scores of each stock in the combination are the scores of the combination. The correlation matrix between the scores of different factors is calculated month by month, and the average value of the correlation matrix during the data period is calculated. Set a threshold, the score correlation average matrix of the elements larger than the threshold corresponding to the first class of factors, retain and other factors more effective, less correlation subclass factors, the others are eliminated as redundant factors.
Factor Descriptive Statistics and Validity Test
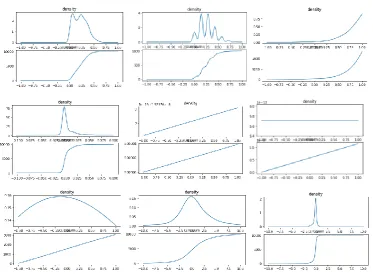
Figure 1. Analysis result diagram.
According to the descriptive statistics of the selected factors and the probability density, it is found that the technical index factor is more focused on obeying the positive distribution, especially the OBV factor, but the MACD factor obviously appears in this stage as the continuous growth stage, while the basic financial index factor produces different volatility of individual stocks[6].
Factor validity test generally includes two methods, monotonicity test: according to the size of the factor, the stock is divided into groups, and the historical cumulative return, information ratio and Sharp ratio of each group are observed from the point of view of time series. The higher the winning rate of the dominant group, the stronger the monotonicity, which indicates that the differentiation ability and stock selection ability of the index are stronger. Correlation test refers to the calculation of the correlation between the factor of stock at the same time and Sharp ratio, and then carries on the significance test, the stronger the correlation, the stronger the stock selection ability.
Conclusion
The basic idea of the multifactor model is to select a series of factors as the criteria of the selection, and the stocks that meet these factors are bought and sold. For the same information input, the computer draws a clear, unique, objective, rational, quantitative investment can reduce the load of the human brain, in order to obtain more efficient investment. In this paper, the daily frequency data of each group of factors in Auto-Trader software are used for single factor strategy research and performance analysis, data processing and clustering analysis are carried out, descriptive statistics and validity tests are made for factors, and the factors that optimize the annualized Sharp ratio are selected. The combination of machine learning and quantitative research is very necessary, which can complement and improve the traditional investment.
Acknowledgement
References
[1] Fama, E.F. and French, K.P. The cross-section of expected stock returns[J]. Journal of Finance, 1992(47):427-465.
[2] Mohanram P S. Separating Winners from Losers among Low Book-to-Market Stocks using Financial Statement Analysis [J]. Social Science Electronic Publishing, 2004, 10(2-3):133-170.
[3] Zhang Chenyu. Design and implementation of A-share market selection system based on data mining technology[J]. Information technology and information, 2017(05):23-27.
[4] David Pei. Research on Multifactor Stock Price forecasting method based on depth Learning [D]. China University of Science and Technology, 2019:25-45.
[5] Felipe Dias Paiva, Rodrigo Tomás Nogueira Cardoso, Gustavo Peixoto Hanaoka, Wendel Moreira Duarte. Decision-Making for Financial Trading: A Fusion Approach of Machine Learning and Portfolio Selection[J]. Expert Systems with Applications, 2018:65-80.