ISSN Online: 2153-1293 ISSN Print: 2153-1285
Hybrid Swarm Algorithm for Multiobjective
Optimal Power Flow Problem
K. Rajalashmi
1, S. U. Prabha
21Department of Electrical and Electronics Engineering, Bannari Amman Institute of Technology, Sathyamangalam, India 2Department of Electrical and Electronics Engineering, Sri Ramakrishna Engineering College, Coimbatore, India
Abstract
Optimal power flow problem plays a major role in the operation and planning of power systems. It assists in acquiring the optimized solution for the optimal power flow problem. It consists of several objective functions and constraints. This paper solves the multiobjective optimal power flow problem using a new hybrid technique by combining the particle swarm optimization and ant colony optimization. This hybrid method overcomes the drawback in local search such as stagnation and pre-mature convergence and also enhances the global search with chemical communica-tion signal. The best results are extracted using fuzzy approach from the hybrid algo-rithm solution. These methods have been examined with the power flow objectives such as cost, loss and voltage stability index by individuals and multiobjective func-tions. The proposed algorithms applied to IEEE 30 and IEEE 118-bus test system and the results are analyzed and validated. The proposed algorithm results record the best compromised solution with minimum execution time compared with the particle swarm optimization.
Keywords
Multiobjective, OPF, Optimization, Hybrid
1. Introduction
The power system is an interconnected electric network, which has generating plant and loads that are connected through transmission and distribution networks. It is a complicated network and it has many objectives to be solved. The reliable result of the objectives is obtained using optimal power flow. Optimized solution for the objective functions is attained by satisfying the power flow equations and constraints of the en-tire power system network. Various control variables are also influenced to achieve an
How to cite this paper: Rajalashmi, K. and Prabha, S.U. (2016) Hybrid Swarm Algori- thm for Multiobjective Optimal Power Flow Problem. Circuits and Systems, 7, 3589- 3603.
http://dx.doi.org/10.4236/cs.2016.711304
Received: May 17, 2016 Accepted: May 28, 2016 Published: September 8, 2016
Copyright © 2016 by authors and Scientific Research Publishing Inc. This work is licensed under the Creative Commons Attribution International License (CC BY 4.0).
optimal solution. Many conventional techniques are applied to solve the optimal power flow problem. They are quadratic programming [1], interior programming [2], linear programming [3], gradient method [4] and newton’s method [5]. The drawback of these methods is that it is a local solver only. The solutions from these classical methods are not the most reasonable for nonlinear, discrete and continuous functions with constraints.
In order to overcome the drawbacks of classical methods, many computational me-thods are used to solve the optimal power flow problem. Particle Swarm Optimization (PSO) [6] inspires the school of fishes and a flock of birds and trapped in local optima. Genetic algorithm [7][8] solves the optimal power flow problem using a random selec-tion of starting values of voltage angles, but it has no control over global and local in-vestigation. Evolutionary programming [9] algorithm solves the problem by enhancing the gradient of the function, and it has the problem of long computational time. Tabu search [10] solves the optimal power flow problem which is more composite for classic-al method. These manuscripts give the optimclassic-al solution for individuclassic-al objective. Con-versely the real world problem needs a concurrent optimal solution for all the objectives.
Multiobjective optimal power flow problem is solved by differential evolution, for ac-tive and reacac-tive power dispatch [11] and fuel cost, voltage profile, and voltage stability enhancement [12]. The drawback of this technique is that the convergence time is more. Enhanced genetic algorithm [13] solves the problem with the combination of new developed quadratic load flow and its demerit is that it gets trapped in local opti-ma. Self adaptive evolutionary programming [14] combines the evolutionary pro-gramming and random search technique and it has the problem of long computational time. As particle swarm optimization is improved [15], the particles avoid being trapped in local optima. Harmony search algorithm [16] inspires the analogy with music im-provisation which has solved the problem with slow convergence. These techniques solve the problem with the long computation time and being trapped in local optima.
In the weighted sum method [17], different objectives are formatted into a single function. In this method, the demerit is to run the problem with multiple time to desire the optimal solution. Voltage security costs [18] are optimized using a penalty method which has the drawback of deciding the suitable penalty. The importance of each objec-tive is not preserved while merging all the objecobjec-tive function into a single objecobjec-tive function. In order to maintain the significance of each objective pareto optimal method is adopted.
In the PSO algorithm, if the particles are small, local minimum problem will occur and the outcome could be evaluated in multiple runs. If the particles are too large, the global solution is obtained in each run and it reduces the speed of the algorithm. In or-der to overcome these difficulties and to increase the efficiency of PSO in this paper, a new hybrid technique technique is proposed by combining the particle swarm optimi-zation and ant colony optimioptimi-zation with chemical communication signal.
cases. In the first case, all the objective functions are simulated individually. In the second case, two objectives are considered simultaneously for optimization such as cost-loss, cost-VSI, loss-VSI and in the third case three objectives are considered con-currently as cost-loss-VSI. These objectives are optimized using the proposed technique with the IEEE 30 and IEEE 118-bus test system. A short introduction of an optimal power flow system has been presented in this section. This paper is planned as a tag on the section. In Section 2, the optimal power flow problem is formulated and discussed. Section 3 explains the central concepts of PSO, Ant colony Optimization (ACO) and Hybrid Swarm Optimization. Section 4 presents the simulated results with discussions of PSO, ACO and hybrid PSO. The conclusion is dealt in the Section 5.
2. Problem Formulation for OPF Solution
In this paper the cost, transmission loss, voltage stability index are optimized, which is satisfying equality and voltage, generator, shunt VAR and transformer constraints.
2.1. Problem Objectives
1) Minimization of Fuel Cost:
This objective is to minimize the cost. The total fuel cost can be expressed as
( )
1Minimization n
i i
i
F P =
∑
(1)( )
2i i i i i i i
F P =a P +b P+c (2)
min max
i i i
P ≤ ≤P P (3) ai, bi, ciis the cost coefficients of the ith generator, Piis the real power output of the ith
generator.
2) Minimization of Transmission Loss:
This objective is to minimize the real power transmission loss. The transmission loss can be stated as
(
)
(
)
2 2
1 2 cos
n
k i j i j i j
k
TL=
∑
= g V −V − VV θ θ− (4)Viis the voltage at the ith line, Vjis the voltage at the jth line, gk conductance.
3) Minimization of Voltage Stability Index:
This objective is to minimize the voltage stability index. The voltage level ought to maintain below critical level. If the voltage level greater than the critical limit the entire system becomes unstable. The fast voltage stability index expressed as
2 2
4
ij ij j i ij
FVSI = Z Q V X (5)
ij
Z is the impedance of line between i and j, Xij is the reactance of line between i and j, Vi is the sending end voltage, Qi is the receiving end reactive power.
2.2. Problem Constraints
The bus voltage maintained the maximum and minimum level. The voltage limit conveyed as
min max
i i i
V ≤ ≤V V (6)
min
i
V , Vimax Minimum, maximum values of voltage magnitudes at bus i. 2) Generation Constraints:
The real and reactive power of generation sustained the maximum and minimum limit. The generation level of real and reactive power is expressed as
min max
Gi i Gi
P ≤ ≤P P (8)
min max
Gi i Gi
Q ≤Q ≤Q (9)
min
Gi
P , PGimax Minimum, maximum values of real power allowed at bus i. min
Gi
Q , QGimax Minimum, maximum values of reactive power allowed at bus i.
3) Transformer Constraints:
The transformer tap setting values are maintained within the maximum and mini-mum level. The transformer tap setting limit is expressed as
min max
i i i
T ≤ ≤T T (10)
min
i
T , max
i
T Minimum, maximum values of transformer tap settings allowed at bus i. 4) Shunt VAR Constraints:
The shunt VAR restricted the maximum and minimum level. The shunt VAR limit is stated as
min max
Ci i ci
Q ≤Q ≤Q (11)
min
Ci
Q , max
ci
Q minimum, maximum values of Shunt VAR allowed at bus i. 5) Equality Constraints:
The equality constraints are expressed as
(
)
(
)
1 cos sin 0
n
Gi Di i j j ij i j ij i j
P −P −V
∑
=V Gδ δ
− +Bδ δ
− = (12)(
)
(
)
1 cos sin 0
n
Gi Di i j j ij i j ij i j
Q −Q −V
∑
=V Gδ δ
− +Bδ δ
− = (13)n: Number of buses.
PGi, QGi Real, reactive power generation at bus i.
PDi, QDi Real, reactive load demand at bus i.
Vi, Vj Voltage magnitudes at bus i and j respectively.
Gij, Bij Transfer conductance and susceptance between bus i and j respectively.
δi, δj Voltage angle at bus i and j respectively.
3. Concepts of Swarm Intelligence
3.1. Basics of PSO
the bounded area. Each particle has its local best (lbest) or a personal best. The best po-sition brings into being by all neighbours particles in the specific solution is global best (gbest). The optimal solution is acquired in the specific solution in the course of its current velocity and the experience.
The formation of individual best is
(
1 , ,)
pbest pbest
i i in
Pbest = x x (14)
The pattern of global best is
(
1 , ,)
gbest gbest
i i in
Gbest = x x (15)
The velocity and the positions are updated in the each iteration. The updating of ve-locity is
(
)
(
)
1
1 1 2 2
k k k k k k
i i i i i i
V + =ωV +c rand× Pbest −X +c rand × Gbest −X (16)
The updating of position of the particle is
1 1
k k k
i i i
X + =X +V + (17)
k i
V current velocity of individual i at iteration k, Vik+1 Modified velocity of indi-vidual i at iteration k + 1, k
i
X Current position of individual i at iteration, ω Inertia weight parameter, c1, c2 Acceleration factors, rand1, rand2 Random numbers between 0
and 1, k i
Pbest Best position of individual i until iteration k, k i
Gbest Best position of the group until iteration k.
3.2. Ant Colony Optimization
Ant colony optimization (ACO) is an evolutionary and adaptive algorithm inspired by the behavior of real ant colonies. The ant when searching food and find food sources, it deposits a chemical called pheromone as a trail during the return path. Based on the quantity and quality of the food available the quantity of pheromone deposited. The pheromone trails allow the ants to identify the shortest path between the ant nest and the food source. Ant colony optimization algorithm updates pheromone values in order to update solutions during run time [19].
The pheromone trail updating equation is stated as
(
) (
1) ( )
ij ij ij
T t+ ∆ = −t α T t + ∆T (18)
α is the pheromone trails evaporation co-efficient, which lies between 0 and 1, ΔTij is
the increment of edge for the period Δt.
To enhance the tempo of search in the optimal power flow problem, the chemical communication between the insects will help. It is the signal of wasp which produces alarm pheromone to the inspiration of anxiety in the colony. This increases the speed of search in the problem area.
The chemical communication signal is expressed as
(
2)
(
4)
A is the chemical signal, B is the emission rate, D is the diffusion coefficient, r is the radius of the active space, t is the time from the beginning of emission, Comperr is the complementary error function.
3.3. Hybrid Swarm Intelligence
ACO not suitable for large optimization problems because it takes long time to search the result and premature convergence. To overcome of finding the best solution with large search space, combine with another algorithm (PSO) which has a better solution. In the hybrid PSO-ACO, the PSO algorithm is used for pheromone update of ACO. This improves the global exploration capabilities of ACO algorithm. This also improves convergence performance of ACO.
The velocity updating equation is expressed as
1 1 2 2
1 1
k
n n
local
k global
ij ij ij ij
k k
T A T c rand T c rand T
= =
∆ = +
∑
∆ + × ∆∑
+ ×∆ (20)A is the chemical communication signal, k ij
T
∆ is the increment of pheromone trails
laid on the edge by ant between t and t + Δt, localk ij
T
∆ is the local update value of ant k,
global ij
T
∆ is the global update value of edge.
3.4. Fuzzy Approach
In the proposed method, the aim is to achieve a set of solution of the multiobjective op-timal power flow problem. In the opop-timal power flow problem with conflicting objec-tives the single optimal solution does not determine the real solution. The Pareto op-timal approach, it is feasible to find the set of solution instead of the single opop-timal so-lution. From the set of solution, the best solution is obtained from the fuzzy approach. The equation for the fuzzy approach for best solution is expressed as
1 1 1
j x j
l l l
i i
i l i
µ
µ
µ
= = =
=
∑
∑∑
(21)x total number of non-dominated solutions.
l i
µ = 0 when the objective function is greater than the maximum value of ith objec-tive function.
l i
µ = 1 when the objective function is greater than the minimum value of ith objec-tive function.
3.5. Proposed Hybrid Algorithm for the Optimal Power Flow Problem
Step 1: Read input data include equality and inequality constraints. Step 2: Initialize the population.
Step 3: Calculate the objective function.
Step 4: Apply Pareto optimal method to get the set of solution. Step 5: Update the velocity using hybrid velocity updating equation. Step 6: Update the position using position updating equation.
stop else go to step 5.
Step 8: Apply Pareto method and determine the non-dominated solution. Step 9: Find the best solution using fuzzy approach.
4. Simulation Results
The proposed system has been tested to IEEE 30-bus test system. The 30-bus IEEE test system has 41 transmission lines, six generators and four transformers (T6-9, T6-10, T4-12 and T27-28). The transformer taps are set between 0.9 to 1.1. The proposed algo-rithm has the particles of 30.
Case 1: Single objective optimization.
The proposed algorithms analyzed with the various values of acceleration factors (c1
and c2) individually. This analysis assists to achieve the suitable value of the acceleration
factor for the further process. This optimal power flow problem was simulated with the acceleration factor (c1) varied from 1 to 3, using hybrid algorithm. The best value is
ob-tained at c1 > 2.5. Table 1 shows the best values of the cost, loss and VSI for c1 = 2.5 are
$801.7/hr, 5.21 MW and 0.14 p.u. respectively. The hybrid algorithm also simulated with the various values of the acceleration factor (c2). The best value is obtained at c2 >
2. Table 2 shows the best values of the cost, loss and VSI for c2 = 2 are, $801.72/hr, 5.24
MW and 0.13 p.u. respectively.
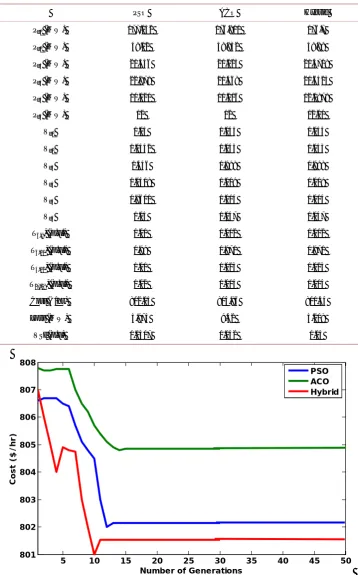
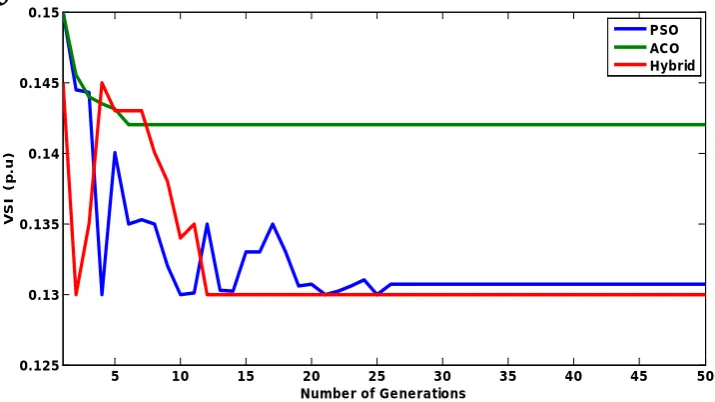
[image:7.595.194.555.541.605.2]Table 3 shows the single objective optimized values with the control variables using the algorithms of PSO, ACO and Hybrid algorithm respectively. It shows that, the reli-able generation cost of PSO, ACO and Hybrid are $802.15/hr, $804.86/hr and $801.54/hr respectively. Figure 1 displays the generation cost convergence characteristics of a sin-gle objective optimization of IEEE 30 test bus system using PSO, ACO and Hybrid al-gorithm. Figure 2 indicates the reduction of transmission loss using PSO, ACO and Hybrid algorithms is 5.974 MW, 9.42 MW and 5.208 MW respectively. Figure 3 indi-cates the voltage stability of PSO, ACO and Hybrid algorithms are 0.1307 p.u., 0.142 p.u. and 0.13 p.u. respectively. These results show that, hybrid algorithm results are distributed.
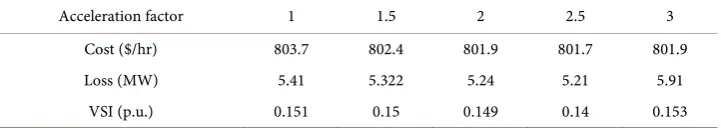
Table 1. Best optimized values of different C1 using hybrid algorithm.
Acceleration factor 1 1.5 2 2.5 3 Cost ($/hr) 803.7 802.4 801.9 801.7 801.9 Loss (MW) 5.41 5.322 5.24 5.21 5.91
[image:7.595.195.555.637.702.2]VSI (p.u.) 0.151 0.15 0.149 0.14 0.153
Table 2. Best optimized values of different C2 using hybrid algorithm.
Acceleration factor 1 1.5 2 2.5 3 Cost ($/hr) 803.89 802.75 801.72 801.76 801.78 Loss (MW) 5.319 5.27 5.24 5.25 5.254
Table 3. Single objective optimized values of cost, loss and VSI using PSO, ACO and Hybrid al-gorithms.
PSO ACO Hybrid
Pg1 (MW) 177.132 176.901 176.7
Pg2 (MW) 48.12 49.932 48.89
Pg3 (MW) 21.356 21.125 21.4719
Pg4 (MW) 22.878 21.468 21.6423
Pg5 (MW) 10.121 10.116 12.0878
Pg6 (MW) 12 12 12.00
Vg1 1.05 1.045 1.045
Vg2 1.0442 1.043 1.043
Vg3 1.446 0.998 0.998
Vg4 1.0408 1.009 1.009
Vg5 0.9601 1.014 1.014
Vg6 1.05 1.047 1.047
T6-9, (p.u.) 1.01 1.012 1.012
T6-10, (p.u.) 0.99 0.971 0.971
T4-12, (p.u.) 1.01 1.023 1.023
T27-28, (p.u.) 1.02 1.014 1.014
Cost ($/hr) 802.15 804.86 801.54
Loss (MW) 5.974 9.42 5.208
[image:8.595.194.553.103.678.2]VSI (p.u) 0.1307 0.142 0.13
Figure 1. The generation cost convergence characteristics of a single objective optimization of IEEE 30 test bus system using PSO, ACO and hybrid algorithm.
5 10 15 20 25 30 35 40 45 50
801 802 803 804 805 806 807 808
Number of Generations
C
o
st
(
$
/
hr
)
The accuracy of the proposed system is measured using the mean and standard devi-ation. Table 4 indicates the mean and standard values of the PSO, ACO and Hybrid algorithms. It is obvious that the proposed hybrid algorithm can achieve better result in the best solution search. The convergence time for the cost optimization using a hybrid technique is 1.05 s, which is a faster than the PSO and ACO methods (1.24 s and 1.12 s
[image:9.595.194.552.393.594.2]Figure 2. The transmission loss convergence characteristics of a single objective optimization of IEEE 30 test bus system using PSO, ACO and Hybrid algorithm.
Figure 3. The voltage stability index convergence characteristics of a single objective optimiza-tion of IEEE 30 test bus system using PSO, ACO and hybrid algorithm.
Table 4. Performance measure of PSO, ACO and hybrid algorithms.
ACO PSO Hybrid
Mean 0.212 0.234 0.259
STD 0.042 0.036 0.024
5 10 15 20 25 30 35 40 45 50
5 6 7 8 9 10 11
Number of Generations
L
o
ss (
M
W
)
PSO ACO Hybrid
5 10 15 20 25 30 35 40 45 50
0.125 0.13 0.135 0.14 0.145 0.15
Number of Generations
V
S
I (
p
.u)
[image:9.595.193.552.658.708.2]respectively). The convergence time taken for the hybrid technique is less. The accuracy and speed of convergence of hybrid are more than the ACO and PSO. Because the hy-brid algorithm overcome the drawback in local search such as stagnation and prema-ture convergence by the local experience of the ant and it processed in parallel. This enhances the chance of locating the finest solution in rapidity. The global search in-creased by the divergence of the pheromone tracks and also with the chemical commu-nication signal. This leads the particle move the quickly to reach the solution. The glob-al utilization, speed up the search and it support to acquire the best solution.
This optimal power flow problem was worked out using P4, 3 GHz. To evaluate the difficulty of the proposed system, the IEEE 14 bus is chosen to solve this OPF problem. The convergence time for this optimization in IEEE 14 bus system of hybrid method is 0.63 s. The convergence time for the hybrid technique is for IEEE 30 bus test system is 1.05 s The convergence speed of the IEEE 30 bus system is twice the times of IEEE 14 bus test system. This will persuade to carry on the proposed technique in higher buses.
Case 2: Two objective optimization.
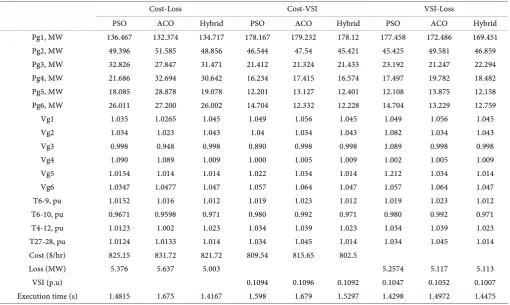
[image:10.595.44.555.402.707.2]In a real world, the problems involve simultaneous optimization of several objective functions. These functions are non commensurable and conflicting objective functions. It gives rise to a set of optimal solutions, instead of one optimal solution. The reason for the optimality of many solutions is that no one can be considered to be better than any other with respect to all objective functions. Table 5 shows the optimized values of two
Table 5. Optimal solution for objective functions with different algorithms.
Cost-Loss Cost-VSI VSI-Loss
PSO ACO Hybrid PSO ACO Hybrid PSO ACO Hybrid Pg1, MW 136.467 132.374 134.717 178.167 179.232 178.12 177.458 172.486 169.451 Pg2, MW 49.396 51.585 48.856 46.544 47.54 45.421 45.425 49.581 46.859 Pg3, MW 32.826 27.847 31.471 21.412 21.324 21.433 23.192 21.247 22.294 Pg4, MW 21.686 32.694 30.642 16.234 17.415 16.574 17.497 19.782 18.482 Pg5, MW 18.085 28.878 19.078 12.201 13.127 12.401 12.108 13.875 12.158 Pg6, MW 26.011 27.200 26.002 14.704 12.332 12.228 14.704 13.229 12.759 Vg1 1.035 1.0265 1.045 1.049 1.056 1.045 1.049 1.056 1.045 Vg2 1.034 1.023 1.043 1.04 1.034 1.043 1.082 1.034 1.043 Vg3 0.998 0.948 0.998 0.890 0.998 0.998 1.089 0.998 0.998 Vg4 1.090 1.089 1.009 1.000 1.005 1.009 1.002 1.005 1.009 Vg5 1.0154 1.014 1.014 1.022 1.034 1.014 1.212 1.034 1.014 Vg6 1.0347 1.0477 1.047 1.057 1.064 1.047 1.057 1.064 1.047 T6-9, pu 1.0152 1.016 1.012 1.019 1.023 1.012 1.019 1.023 1.012 T6-10, pu 0.9671 0.9598 0.971 0.980 0.992 0.971 0.980 0.992 0.971 T4-12, pu 1.0123 1.002 1.023 1.034 1.039 1.023 1.034 1.039 1.023 T27-28, pu 1.0124 1.0133 1.014 1.034 1.045 1.014 1.034 1.045 1.014 Cost ($/hr) 825.15 831.72 821.72 809.54 815.65 802.5
Loss (MW) 5.376 5.637 5.003 5.2574 5.117 5.113
objective optimization such as cost-loss, cost-VSI and loss-VSI using PSO, ACO and Hybrid algorithm. It is not easy to pinpoint the correct concert solution from a single run for the corresponding objective. So, to get the appropriate solution 30 numbers of pare to solution sets are obtained from 30 generations.
In the cost-loss minimization, objectives contrasts to each other. The cost-loss diver-gence optimization, the cost and loss for the PSO, ACO and Hybrid techniques are $825.15/hr, $831.72/hr, $821.72/hr and 5.376 MW, 5.375 MW, 5.043 MW respectively. The reduction of cost and loss in hybrid is 1.12% and 11%higher than PSO and ACO techniques. Figure 4 indicates the compromised solution of cost and loss are $821.72/hr and 5.43 MW obtained using hybrid algorithm. It shows that, the cost-loss multiobjec- tive optimization, the hybrid solution is best in cost and less reduction.
To avoid the stability problem in the system, the VSI should be maintained below critical limit. In addition to the VSI, cost also to be reduced. The cost-VSI conflict op-timization, the cost and VSI for the PSO, ACO and Hybrid techniques are $809.54/hr, $815.65/hr, $802.5/hr and 0.1094 p.u, 0.1096 p.u., 0.1092 p.u, respectively. The reduc-tion of cost and VSI of hybrid technique is 1.63% and 0.36% respectively. Figure 5
shows that the best compromised solution of cost and VSI are $802.5/hr and 0.1092 p.u, obtained using hybrid algorithm. The execution time of the hybrid technique for the cost-VSI divergence optimization is 1.5297 s, which is a faster than the PSO and ACO methods (1.598 s and 1.679 s respectively).
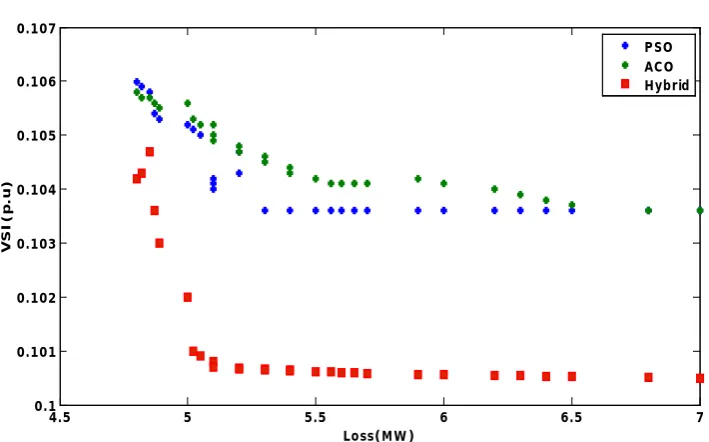
[image:11.595.197.550.458.675.2]In the loss-VSI case, the loss is minimized with the voltage stability, which is main-tained below critical limit. The loss-VSI contrast optimization, the loss and VSI for the PSO, ACO and Hybrid techniques are 5.2574 MW, 5.117 MW, 5.113 MW and 0.1047 p.u, 0.1052 p.u., 0.1007 p.u, respectively. It shows that the reduction of loss in the ACO technique is less than the PSO technique Figure 6 indicates the divergence of hybrid is
Figure 4. Loss-Cost optimization using PSO, ACO and hybrid algorithms of IEEE 30 test bus system.
4.5 5 5.5 6 6.5 7
800 850 900 950
Loss(MW)
C
o
s
t (
$
/
hr
)
Figure 5. Loss-voltage stability index optimization using PSO, ACO and hybrid algorithm of IEEE 30 test bus system.
Figure 6. Voltage stability index-cost optimization using PSO, ACO and hybrid algorithm of IEEE 30 test bus system.
more than the ACO and PSO. The best compromised solution of loss and VSI are 5.113 MW and 0.1007 p.u, obtained using SPPSO algorithm. This result indicates the hybrid optimized result from the loss-VSI multiobjective optimization is better compared to the PSO and ACO techniques.
From the two objective optimization the reduction of cost is more in cost-VSI than the cost-loss optimization. The loss is optimized more in cost-loss multiobjective than the loss-VSI. Optimizing two objectives will give the dissimilar result for the same ob-jective function. It initiates the obob-jectives which are considered for the optimal power flow should be optimized simultaneously.
4.5 5 5.5 6 6.5 7
0.1 0.101 0.102 0.103 0.104 0.105 0.106 0.107
Loss(MW)
V
S
I(
p
.u)
PSO ACO Hybrid
795 800 805 810 815 820 825 830
0.106 0.108 0.11 0.112 0.114 0.116 0.118 0.12
Cost ($/hr)
V
S
I(
p
.u)
[image:12.595.197.553.327.525.2]Case 3: Three objective optimization.
Table 6 indicates the optimal values of the three objectives such as cost-loss-VSI, using PSO, ACO and Hybrid algorithms. The cost of the three objective optimization using PSO, ACO and Hybrid algorithms are $814.76/hr, $815.6/hr and $805.5/hr re-spectively. In this, the cost reduced in the hybrid 1% more than the ACO and PSO techniques. The loss of the three objective optimization of the PSO, ACO and Hybrid techniques are 9.924 MW, 9.98 MW and 6.321 MW respectively. The loss reduction of hybrid technique is 57% higher than the PSO and ACO. The VSI of the PSO, ACO and Hybrid for the multi objective optimization are 0.1407 p.u, 0.1482 p.u and 0.1127 p.u respectively. The hybrid algorithm results, 24% more reduction in VSI than the PSO and ACO techniques. Table 6 shows, the hybrid technique results the better accuracy compare to the PSO and ACO algorithm for multiobjective optimization problem.
In order to confirm the performance of the proposed algorithm in large systems, hy-brid algorithm applied in IEEE 118 test bus system. The particles are increased to 50. To get the appropriate solution, 30 numbers of pareto solution sets are obtained from 30 generations. Table 7 indicates the optimal solutions for the cost, loss and VSI opti-mized with a single objective, two objectives and three objective function using a hybrid
Table 6. Multiobjective optimal solution for Cost-Loss-Voltage Stability Index with different al-gorithms.
Variables PSO ACO Hybrid
Pg1, MW 168.163 167.937 105.71
Pg2, MW 46.232 45.827 74.445
Pg3, MW 23.957 23.211 38.329
Pg4, MW 15.328 18.185 35.517
Pg5, MW 18.541 17.248 19.278
Pg6, MW 23.789 25.157 12.248
Vg1 1.065 1.074 1.045
Vg2 1.054 1.063 1.043
Vg3 0.9002 0.9098 0.998
Vg4 1.100 1.104 1.009
Vg5 1.017 1.019 1.014
Vg6 1.066 1.078 1.047
T6-9, pu 1.015 1.019 1.012
T6-10, pu 0.980 0.998 0.971
T4-12, pu 1.034 1.045 1.023
T27-28, pu 1.016 1.017 1.014
Cost ($/hr) 814.76 815.6 805.4
Loss (MW) 9.924 9.98 6.321
VSI (p.u) 0.1407 0.1482 0.1127
Table 7. The optimal solution of single objective and multi objective functions using hybrid al-gorithm for IEEE 118 test bus system.
Objectives Single objective Two objectives Three objectives Cost Loss VSI Cost-loss Cost-VSI Loss-VSI Cost-loss-VSI Cost ($/hr) 128945 152014 149156 131992 131129 131119 Loss (MW) 139.5 123.3 138.6 115.4 125.12 143.5
VSI (p.u.) 0.47 0.479 0.412 0.431 0.429 0.442 Execution time (s) 35.487 35.897 35.127 48.087
algorithm for IEEE 118 test bus system. It indicates the values of cost, loss and VSI of the single objective optimization are less when compared to the multiobjective optimi-zation. It states that while considering more objective function, the optimized value and execution time are increased concurrently. Because of nonlinearity in large system the front is less consistent comparing to the smaller system.
5. Conclusion
In this paper optimal power flow problem has three objectives with constraints, and it works out in the multiobjective optimization approach. This multiobjective problem is solved by single objective, two-objective optimization such as cost-loss, cost-voltage stability index, loss-voltage stability index, and three-objective optimization of cost-loss- voltage stability index using PSO, ACO and hybrid techniques. Hybrid swarm intelli-gence is used to avoid the stagnation of global and local search and get the best solution by fuzzy approach. The simulation results show that the hybrid swarm optimization provides better results and faster convergence compared to the ant colony optimization and particle swarm optimization. The proposed technique gives better results with less convergence time and it will help to choose the sensible solution to the multiobjective optimization problem in IEEE 30 & IEEE 118 test bus system.
References
[1] Burchet, R.C., Happ, H.H. and Vierath, D.R. (1984) Quadratically Convergent Optimal Power Flow. IEEE Transactions on Power Apparatus and Systems, 103, 3267-3276.
http://dx.doi.org/10.1109/TPAS.1984.318568
[2] Capitanescu, F., Glavic, M., Ernst, D. and Wehenkel, L. (2007) Interior-Point Based Algo-rithms for the Solution of Optimal Power Flow Problems. Electric Power Systems Research, 77, 508-517. http://dx.doi.org/10.1016/j.epsr.2006.05.003
[3] Olofsson, M., Anderson, G. and Soder, L. (1995) Linear Programming Based Optimal Pow-er Flow Using Second OrdPow-er Sensitivities. IEEE Transactions on Power Systems, 10, 1691- 1697. http://dx.doi.org/10.1109/59.466472
[4] Salgado, R., Brameller, A. and Aitchison, P. (1990) Optimal Power Flow Solutions Using the Gradient Projection Method Part 2: Modelling of the Power System Equations, Genera-tion, Transmission and Distribution. IEE Proceedings, 137, 429-435.
2880. http://dx.doi.org/10.1109/TPAS.1984.318284
[6] Abido, M.A. (2002) Optimal Power Flow Using Particle Swarm Optimization. Electrical Power & Energy System, 24, 563-571. http://dx.doi.org/10.1016/S0142-0615(01)00067-9
[7] Todorovski, M. and Rajicic, D. (2006) An Initialization Procedure in Solving Optimal Pow-er Flow by Genetic Algorithm. IEEE Transactions on Power Systems, 21, 480-487.
http://dx.doi.org/10.1109/TPWRS.2006.873120
[8] Bakirtzis, A.G., Biskas, P.N., Zoumas, C.E. and Petridis, V. (2002) Optimal Power Flow by Enhanced Genetic Algorithm. IEEE Transactions on Power Systems, 17, 229-236.
http://dx.doi.org/10.1109/TPWRS.2002.1007886
[9] Yuryevich, J. and Wong, K.P. (1999) Evolutionary Programming Based Optimal Power Flow Algorithm. IEEE Transactions on Power Systems, 14, 1245-1250.
http://dx.doi.org/10.1109/59.801880
[10] Abido, M.A. (2002) Optimal Power Flow Using Tabu Search Algorithm. Electric Power Components and Systems, 30, 469-483. http://dx.doi.org/10.1080/15325000252888425
[11] Varadarajan, M. and Swarup, K.S. (2008) Solving Multi-Objective Optimal Power Flow Using Differential Evolution. IET Generation, Transmission & Distribution, 2, 720-730.
http://dx.doi.org/10.1049/iet-gtd:20070457
[12] Abou El Elaa, A.A., Abidob, M.A. and Speaa, S.R. (2010) Optimal Power Flow Using Diffe-rential Evolution Algorithm. Electric Power Systems Research, 80, 878-885.
http://dx.doi.org/10.1016/j.epsr.2009.12.018
[13] Kumari, M.S. and Maheswarapu, S. (2010) Enhanced Genetic Algorithm Based Computa-tion Technique for Multi-Objective Optimal Power Flow SoluComputa-tion. Electrical Power and Energy Systems, 32, 736-742. http://dx.doi.org/10.1016/j.ijepes.2010.01.010
[14] Shi, L.B. and Xu, G.Y. (2001) Self-Adaptive Evolutionary Programming and Its Application to Multi-Objective Optimal Operation of Power Systems. Electric Power Systems Research, 57, 181-187. http://dx.doi.org/10.1016/S0378-7796(01)00086-4
[15] Niknam, T., Narimani, M.R., Aghaei, J. and Azizipanah-Abarghooee, R. (2012) Improved Particle Swarm Optimisation for Multi-Objective Optimal Power Flow Considering the Cost, Loss, Emission and Voltage Stability Index. IET Generation, Transmission & Distri-bution, 6, 515-527. http://dx.doi.org/10.1049/iet-gtd.2011.0851
[16] Sivasubramani, S. and Swarup, K.S. (2011) Multi-Objective Harmony Search Algorithm for Optimal Power Flow Problem. Electrical Power and Energy Systems, 33, 745-752.
http://dx.doi.org/10.1016/j.ijepes.2010.12.031
[17] Fonseca, C.M. and Fleming, P.J. (1995) An Overview of Evolutionary Algorithms in Mul-tiobjective Optimization. Evolutionary Computation, 3, 1-16.
http://dx.doi.org/10.1162/evco.1995.3.1.1
[18] Rosehart, W.D., Cañizares, C.A. and Quintana, V.H. (2003) Multiobjective Optimal Power Flows to Evaluate Voltage Security Costs in Power Networks. IEEE Transactions on Power Systems, 18, 578-587. http://dx.doi.org/10.1109/TPWRS.2003.810895
Submit or recommend next manuscript to SCIRP and we will provide best service for you:
Accepting pre-submission inquiries through Email, Facebook, LinkedIn, Twitter, etc. A wide selection of journals (inclusive of 9 subjects, more than 200 journals)
Providing 24-hour high-quality service User-friendly online submission system Fair and swift peer-review system
Efficient typesetting and proofreading procedure
Display of the result of downloads and visits, as well as the number of cited articles Maximum dissemination of your research work