a Smart-Grid Connected Photovoltaic System
Warsame H. Ali, Penrose Cofie, John H. Fuller, Savitha Lokesh, Emmanuel S. Kolawole
*Department of Electrical and Computer Engineering, Prairie View Texas A&M University, Prairie View, TX, USA
Abstract
The availability of non-renewable energy sources such as crude oil, natural gas, coal etc., is fast diminishing. So the renewable energy sources such as so-lar, hydropower, geothermal, wind, tidal energy, are gaining more and more importance. Many new developments to convert these renewable energy sources into usable forms are taking place. Most renewable energy sources are used to produce electricity. In this paper, a performance and efficiency simu-lation study of a smart-grid connected photovoltaic system using Chroma DC programmable power supply, AC programmable source and an Aurora In-verter is proposed. The simulation is performed in MATLAB environment where the Current-Voltage (I-V) and Power-Voltage (P-V) curves from the solar array simulator are generated and plotted. The proposed topology has been verified with satisfactory results. In addition, temperature and irradiance effects on I-V and P-V characteristic curves are verified. Also, the efficiency curves of the photovoltaic grid interface inverter are generated in the study. The MATLAB code developed in this paper is a valuable tool for design engi-neers comparing different inverters, calculating the optimum efficiency of a given inverter type.
Keywords
Smart-Grid, Photovoltaic System, Renewable and of Non-Renewable Energy, Current-Voltage (I-V) and Power-Voltage (P-V) Curves, Inverter, Electricity
1. Introduction
Nowadays, we are mainly dependent on nonrenewable energy sources which are one of the major contributors of environmental pollution and climate change. Due to all these problems and diminishing supply of nonrenewable energy sources, finding a quick, suitable and better alternative like renewable energies are necessary. Demand for green power or renewable energy sources like wind How to cite this paper: Ali, W.H., Cofie,
P., Fuller, J.H., Lokesh, S. and Kolawole, E.S. (2017) Performance and Efficiency Si- mulation Study of a Smart-Grid Connected Photovoltaic System. Energy and Power Engi- neering, 9, 71-85.
https://doi.org/10.4236/epe.2017.92006
Received: November 12, 2016 Accepted: February 7, 2017 Published: February 10, 2017
Copyright © 2017 by authors and Scientific Research Publishing Inc. This work is licensed under the Creative Commons Attribution International License (CC BY 4.0).
power, tidal power, solar power and fuel cells have increased over the years. Now one of the greatest challenges is to make use of these renewable energies more efficiently and cost effectively. Solar energy has been one of the attractive sus-tainable sources. Solar cells are simply p-n junction device which are mostly built from semiconductor material, such as silicon. Solar or photovoltaic (PV), cells are used to convert the solar energy of sunlight into electric energy or elec-tricity [1]. As long as there is sunlight, solar cells convert energy and this con-version process diminishes in the evening and during cloudy conditions, and stops completely at dusk and resumes at dawn. It is very fascinating to note that the solar cells convert the most abundant and free form of energy into electricity without using any moving parts and without polluting the environment as com-pared with the non-renewable energy production methods, such as fossil fuel, hydroelectric, or nuclear energy plants.
The inverter connected to the grid helps in converting the DC electricity pro-duced by the solar panels into the required AC electricity. Grid connected inver-ters mainly produce AC voltages which have the same frequency and amplitude as the main power grid. Also, if there is more production of power than being consumed the excess power is fed into the main power grid. This helps in saving cost, as many electric companies will meter the electricity fed into the grid and will provide a bill of credit. At night time when there is no sunlight, the required power is supplied by the main power grid as normal. These systems are helping us in reducing the consumption of electricity produced by non-renewable ener-gy sources. Selecting an inverter depends on many factors like output power rating, maximum power point tracking (MPPT) rating, weather, and shade con-ditions [2]. Inverters are designed to work in a wide range of power conditions from the PV panel that affects the characteristics of the power system. The in-verters are selected mainly based on their efficiency and specific application.
The proposed system set up consists of a Chroma programmable Direct Cur-rent (DC) power supply, an Aurora inverter, a load, a Chroma digital power meter, and a Chroma programmable Alternate Current (AC) source. The equip- ment set is connected together in a performance and efficiency simulation study of a smart grid connected photovoltaic system.
2.
Circuit
Modelling of
Solar
Cell
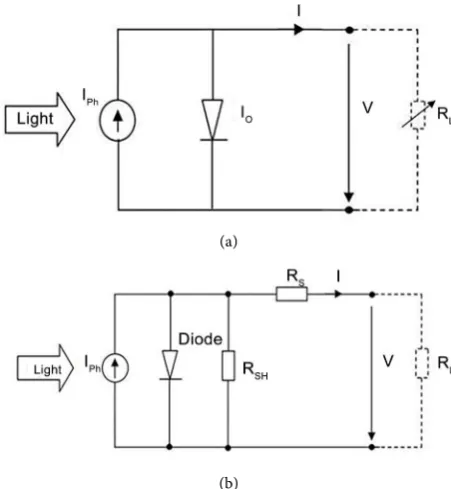
The ideal solar cell is modeled by a current source connected in parallel with a rectifying diode, as shown in Figure 1(a).
The corresponding current-voltage (I-V) characteristic is described by the Shockley solar cell Equation [3],
[ ]
1 B q V IRs
K T ph o
I I I e
+
= − −
(1)
(a)
[image:3.595.258.484.71.316.2](b)
Figure 1. (a) Equivalent circuit of an ideal solar cell; (b) Pra- ctical solar cell equivalent circuit.
Figure 1(b) shows the model of a practical solar cell. It consists of a current source, rectifying diode, and two resistors one in series (Rs) and the other in pa-rallel (Rsh) [4]. The series resistance is mainly formed by the bulk resistance of the semiconductor material, the metallic contacts and interconnections, carrier transport through the top diffused layer, and contact resistance between the me-tallic contacts and the semiconductor. The shunt resistance (Rsh) is formed due to p-n junction non-idealities and impurities near the junction, which cause par-tial shorting of the junction, mainly near the cell edges [5].
The current Equation for the practical solar cell includes the effect of Rs and
Rsh and is given by [4]
[ ]
1 B q V IRs
K T ph o
SH
V IRs
I I I e
R + + = − − −
(2)
where,
Rs is the series resistance Rsh is the shunt resistance.
3. Performance Characteristics of Solar Cell
(a) (b)
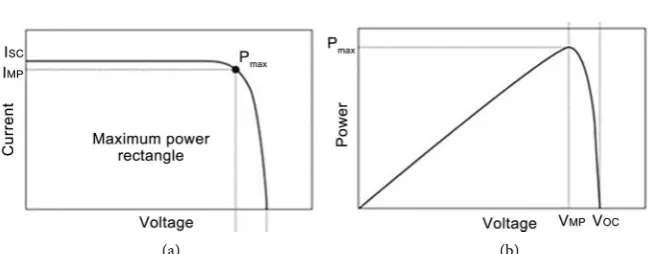
Figure 2. (a) I-V Characteristics of an ideal solar cell; (b) P-V Characteristics of an ideal solar cell.
Solar cell parameters are found from static characteristics. The solar cell cha-racteristics comprise of open circuit voltage (VOC), short circuit current (ISC), maximum point voltage, maximum point current and maximum point power (VMP, IMP and PMP), and the fill factor (FF). Measurements can be done either under illuminated or under dark conditions.
4. Irradiance Effects on Characteristic Curves of Solar
Module
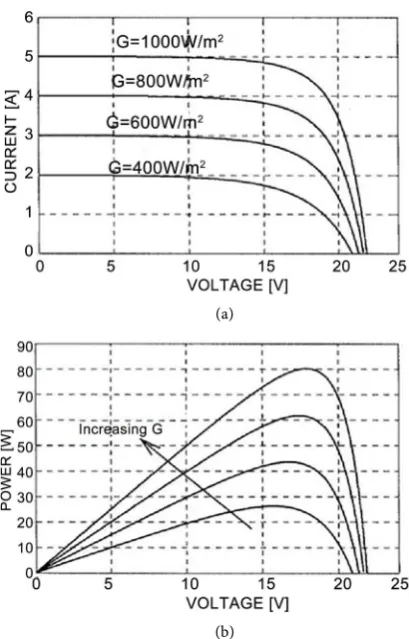
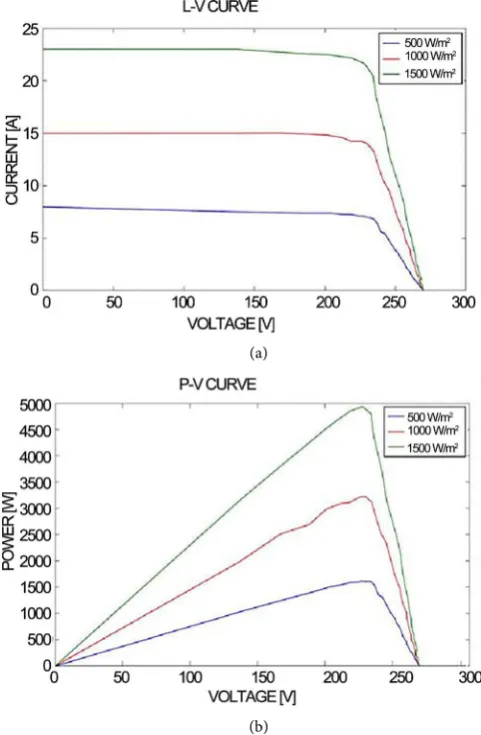
Solar irradiance is defined as the rate of energy (power) per unit area and it is usually measured in watt per meter square (W/m2) [6]. Irradiance varies with the movement of the sun and cloud, throughout the day. A higher irradiance means the energy is coming at a faster rate from the sun [7]. The irradiance is directly proportional to the short circuit current and the effect of irradiance on voltage is negligible. Figure 3 shows the I-V and P-V curves of a module being exposed to different amounts of irradiance [8]. There is no change in the shape of the I-V and P-V curves but as the irradiance decreases the curve shifts towards lower currents.
The output power of solar cells increases with increase in irradiance. This means that solar cells work best at high level of irradiance. As the amount of sunlight drops, the current and power output of the module drops. However, the voltage is unaffected with lower solar radiation. When looking at the diode equivalent model, as more light strikes the solar cell a larger current is output-ted by the current source which represents the photo generaoutput-ted current as seen in Figure 1(a). As the amount of sunlight drops, the current and power output of the module drops. However, the voltage is unaffected with lower solar radi-ation.
5. Temperature Effects on Characteristics Curve of Solar
Module
(a)
[image:5.595.269.474.66.386.2](b)
Figure 3. Irradiance effects on the (a) I-V curve; (b) P-V curve of a Solar cell.
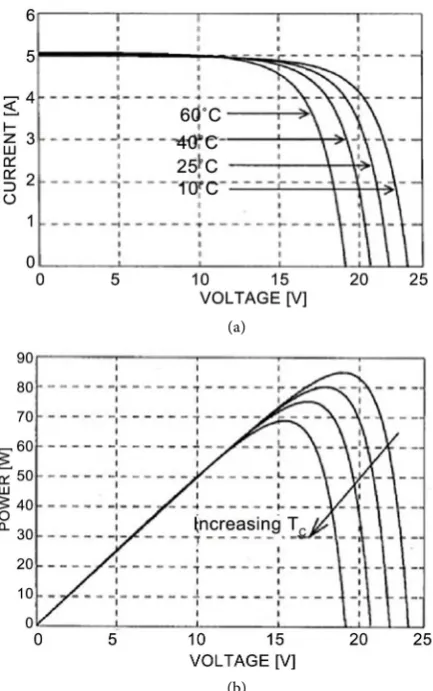
constant irradiance has a strong effect on the open circuit voltage and output power of the cell, but negligible effect on the short circuit current. The change in voltage with temperature is due to change in the diode conduction characteris-tics [9].
During solar cell design, it is important to consider cold and hot temperature conditions. The amount of change experienced by the solar module, due to temperature change is indicated by the solar module manufacturers in the form of temperature coefficients, which is normally expressed in percentage degree Celsius. Fill factor of the solar cell also decreases with increase in temperature
[9]. At higher operating temperature the efficiency of the solar cell decreases be-cause of significant decrease in voltage and reduction in fill factor. Also the maximum power of solar cell reduces due to decrease in voltage, even though there is a slight increase in current density.
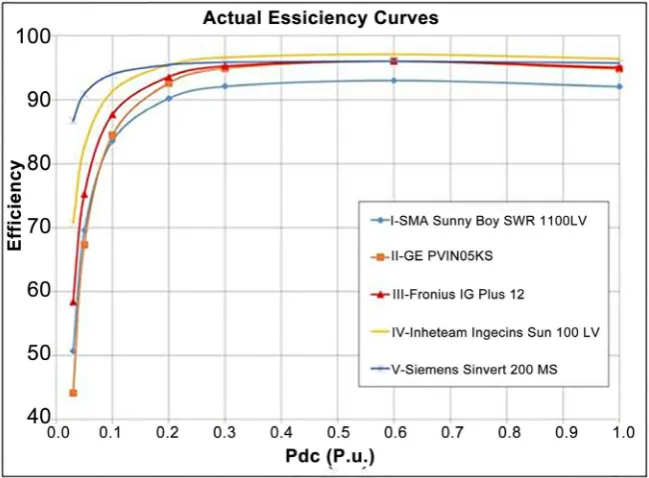
6. Inverter Efficiency Curve
gets hot. Hence the inverter has to be installed in a well ventilated location.
Figure 5 shows solar inverter efficiency curve which is a plot of different solar inverter efficiencies at different input power or output power [11]. Different power produced by the inverter at all possible currents that the inverter works at, have different efficiency associated with each current. The peak efficiency represents the highest efficiency that the solar inverter works at [12]. As the cur-rent increases the efficiency will also increase sharply until it reaches a peak effi-ciency point. It will remain close to the peak effieffi-ciency point or decreases slightly with increase in current.
7. Experimental Setup
The experimental setup of the smart grid photovoltaic system consists of two (2) Chroma DC programmable power supplies in lieu of solar array, an Aurora in-verter, a Chroma power meter, a Chroma AC programmable source, safety switch and resistive loads as shown in Figure 6. The Chroma programmable DC power supply with solar array simulation, which is a high power density DC power supply that can provide stable DC output and accurate measurement for voltage and current [13].
(a)
[image:6.595.263.480.355.701.2](b)
Figure 5. Inverter efficiency curve.
Figure 6. Proposed experimental setup.
The Aurora Inverter is capable of feeding a power grid using the power gener-ated by photovoltaic panels. An Aurora solar inverter converts DC power pro-duced by the solar panels into the required AC power, without using rotating parts but just static power electronic devices.
The Chroma programmable AC source, which provides a low distortion sine wave output for power accuracy [14].
8. Flowchart
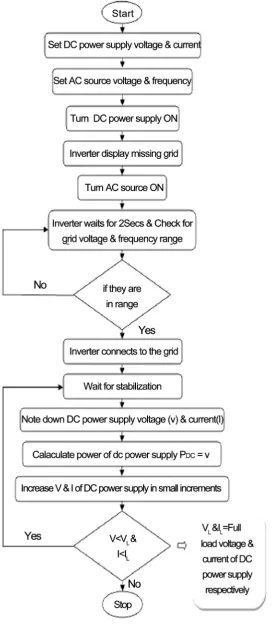
8.1. I-V and P-V Curve Flowchart
the AC grid turns “On”. After 1 or 2 seconds the inverter checks again for grid connection, if the grid voltage and frequency are in the range, the inverter con-nects to the grid. Once the DC power supply and power meter values are stabi-lized, the voltage and current of the DC power supply are noted. The output power of the DC power supply from the recorded value of voltage and current is calculated, which is the inverter input power. This process is repeated for various values of voltage and current (in small increments), which is less than full load voltage and current of the DC power supply respectively. The DC power supply output voltage, current and power for various values of input voltage and cur-rent are noted down. The curcur-rent-voltage (I-V) and power-voltage (P-V) curves are plotted.
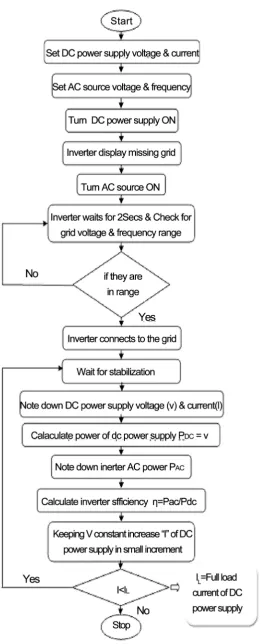
8.2. Inverter Efficiency Curve Flowchart
Figure 8 shows the flowchart for the inverter efficiency curve. All the equipment is arranged as shown in Figure 6. The two DC power supplies, safety switch and AC grid are turned on. The MATLAB efficiency curve program is uploaded in the computer. In this program the DC power supply unit voltage is kept constant and the current is varied in small increments. When the MATLAB program runs, one of the DC power supplies acts as “Master” and other acts as “Slave”. The program output shows missing grid on the computer and also on the inver-ter display. At that moment the AC grid is still “Off”, and afinver-ter a delay the AC grid turns “On”. After 1 or 2 seconds the inverter checks again for grid connec-tion, if the grid voltage and frequency are in the range, the inverter connects to the grid. Once the DC power supply and power meter values are stabilized, the voltage and current of DC power supply is noted. The output power of DC pow-er supply from the recorded value of voltage and current is calculated, which is inverter input power. The inverter output power from the power meter is noted. The efficiency of the inverter is calculated, which is the ratio of inverter output power by inverter input power. This process is repeated for various values of current (in small increments), which is less than full load current of the DC power supply. The inverter input power and inverter output power are noted, and efficiency of the inverter is calculated for various values of current. The effi-ciency curve is plotted; this is inverter effieffi-ciency v/s inverter output power.
9. Simulation Results
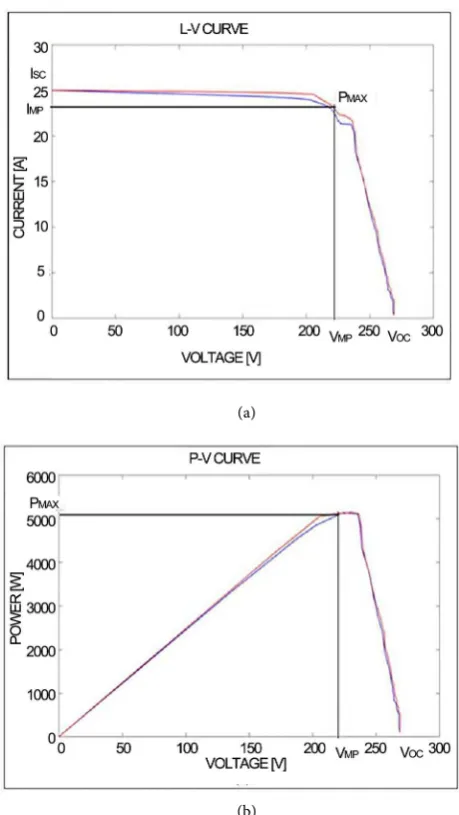
9.1. I-V and P-V Characteristics Curve of Solar Array Simulator
(a)
[image:11.595.258.488.67.475.2](b)
Figure 9. (a) I-V curve; (b) P-V curve of solar array simulator.
lator; the extent of the I-V curve ranges from the short circuit current (Isc) at zero volts, to zero current at the open circuit voltage (Voc). In the P-V curve, power is calculated as the product of measured current and voltage at each I-V point. At the “knee” of a normal I-V curve, is the maximum power point (Imp, Vmp), the point at which the array generates maximum electrical power. At vol-tages below Vmp, the external load is relatively independent of output voltage. Near the knee of the curve, this behavior starts to change. The maximum power point, located at the knee of the curve, is the (I, V) point at which the product of current and voltage reaches its maximum value.
9.2. Irradiance Effects on Characteristics Curves of Solar Array
Simulator
(a)
[image:12.595.252.493.72.440.2](b)
Figure 10. Irradiance effects on (a) I-V curve; (b) P-V curve.
the short circuit current and the output power of the cell, but negligible effect on the open circuit voltage. There is no change in the shape of the I-V and P-V curve but as the irradiance decreases the curve shifts towards lower currents.
9.3. Temperature Effects on Characteristics Curves of Solar Array
Simulator
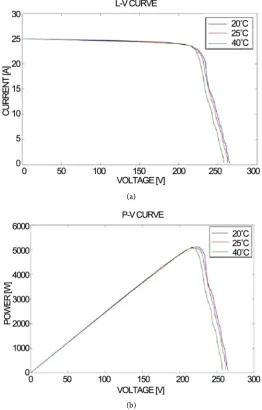
Figure 11 shows the temperature effects on the I-V and P-V curve of solar array simulator. With increase in temperature the I-V and P-V curve shifts towards lower voltages which means that the change in temperature has a strong effect on the open circuit voltage and the output power of the cell, but negligible effect on the short circuit current. The maximum power of solar cell reduces due to decrease in voltage, even though there is a slight increase in current density.
9.4. Inverter Efficiency Curves
(a)
[image:13.595.241.504.75.486.2](b)
Figure 11. Temperature effects on (a) I-V curve; (b) P-V curve.
[image:13.595.243.506.519.714.2]highest efficiency for the solar inverter. As the current increases the efficiency also increases sharply until it reaches a peak efficiency point. From Figure 10, it can be seen that as current increases the efficiency remains close to peak effi-ciency point or decreases slightly from 99% to 97%.
10. Conclusions
In this paper, the study of the smart grid connected photovoltaic system is pre-sented. This smart grid connected solar system setup is modeled using DC pro-grammable power supply, an inverter and AC propro-grammable source. The system has been simulated using MATLAB. The results of the solar array simulator show that the characteristics of the I-V and P-V curves generated from the MATLAB are similar to the characteristic curves of an ideal solar cell. In addi-tion, when the irradiance increases, the solar array simulator short circuit cur-rent is greatly affected whereas the open circuit voltage remains fairly constant. When the temperature increases, the solar array simulator output voltage drops but there is a negligible effect on the short circuit current. As the current in-creases the efficiency also inin-creases sharply until it reaches a peak efficiency point and it remains close to peak efficiency point, decreasing slightly with in-crease in current. The inverter efficiency curves generated from the MATLAB are similar to the actual efficiency curves of different solar inverters [10].
The main contribution of this paper is the development of MATLAB code for smart grid connected photovoltaic system. The MATLAB code developed in this paper is a valuable tool for design engineers comparing different inverters, cal-culating the optimum efficiency of a given inverter type. The validity of this me-thod has been tested with the results obtained by simulations and measured da-ta. This experiment can be further performed using an actual solar array to veri-fy the simulation results.
References
[1] Gevorkian, P. (2007) Sustainable Energy System Engineering, the Complete Green Building Design Resource. McGraw-Hill Companies, USA.
[2] Boxwell, M. (2012) Solar Electricity Handbook—A Simple Practical Guide to Solar Energy—Designing and Installing Photovoltaic Solar Electric Systems. Greenstream Publishing, UK.
[3] McEvoy, A.J., Markvart, T. and Castaner, L. (2012) Practical Handbook of Photo-voltaics: Fundamentals and Applications. 2nd Edition, Academic Press, Waltham. [4] Shongwe, S. and Hanif, M. (2012) Comparative Analysis of Different Single-Diode
PV Modeling Methods. IEEE Systems Journal, 6.
[5] Rashid, M. (2011) Power Electronics Handbook. 3rd Edition, Butterworth-Hei- nemann of Elsevier, Burlington.
[6] Arjyadhara, P., Ali, S.M. and Chitralekha, J. (2013) Analysis of Solar PV Cell Per-formance with Changing Irradiance and Temperature. International Journal of En-gineering and Computer Science, 2, 214-220.
mum PV Plant for a Given Solar DC/AC Converter. Energies, 4853-4870.
[11] Faranada, R.S., Hafezi, H., Leva, S., Mussetta, M. and Ogliari, E. (2015) The Opti-mum PV Plant for a Given Solar DC/AC Converter. Energies, 4853-4870.
[12] Salam, Z. and Rahman, A.Ab. (2014) Efficiency for Photovoltaic Department Head of Electrical Engineering and Interim Dean of the College Inverter: A Technological Review. IEEE Conference on Energy Conversion (CENCON), 175-180.
[13] Chroma Programmable DC Power Supply (with Solar Array Simulation) Manual. [14] Chroma Programmable AC Source Manual.
Submit or recommend next manuscript to SCIRP and we will provide best service for you:
Accepting pre-submission inquiries through Email, Facebook, LinkedIn, Twitter, etc. A wide selection of journals (inclusive of 9 subjects, more than 200 journals)
Providing 24-hour high-quality service User-friendly online submission system Fair and swift peer-review system
Efficient typesetting and proofreading procedure
Display of the result of downloads and visits, as well as the number of cited articles Maximum dissemination of your research work