RESEARCH ARTICLE TECHNIQUES AND RESOURCES
Investigating CNS synaptogenesis at single-synapse resolution by
combining reverse genetics with correlative light and electron
microscopy
Olivier Urwyler1,2,*, Azadeh Izadifar1,2, Dan Dascenco1,2, Milan Petrovic1,2, Haihuai He1,2, Derya Ayaz1,2, Anna Kremer3,4, Saskia Lippens3,4, Pieter Baatsen5, Christopher J. Guérin3,4,6and Dietmar Schmucker1,2,*
ABSTRACT
Determining direct synaptic connections of specific neurons in the central nervous system (CNS) is a major technical challenge in neuroscience. As a corollary, molecular pathways controlling developmental synaptogenesis in vivo remain difficult to address. Here, we present genetic tools for efficient and versatile labeling of organelles, cytoskeletal components and proteins at single-neuron and single-synapse resolution inDrosophilamechanosensory (ms) neurons. We extended the imaging analysis to the ultrastructural level by developing a protocol for correlative light and 3D electron microscopy (3D CLEM). We show that in ms neurons, synaptic puncta revealed by genetically encoded markers serve as a reliable indicator of individual active zones. Block-face scanning electron microscopy analysis of ms axons revealed T-bar-shaped dense bodies and other characteristic ultrastructural features of CNS synapses. For a mechanistic analysis, we directly combined the single-neuron labeling approach with cell-specific gene disruption techniques. In proof-of-principle experiments we found evidence for a highly similar requirement for the scaffolding molecule Liprin-αand its interactors Lar and DSyd-1 (RhoGAP100F) in synaptic vesicle recruitment. This suggests that these important synapse regulators might serve a shared role at presynaptic sites within the CNS. In principle, our CLEM approach is broadly applicable to the developmental and ultrastructural analysis of any cell type that can be targeted with genetically encoded markers.
KEY WORDS:Drosophila, Synapse formation, Sensory neuron, CNS, 3D CLEM
INTRODUCTION
Developmental synaptogenesis is a complex multifactorial process (Chia et al., 2013; Jin and Garner, 2008; Sheng and Kim, 2011; Yamagata et al., 2003), and many of the molecular mechanisms controlling synapse specification, formation, maintenance/elimination and plasticityin vivoare yet to be elucidated. This is especially true in the central nervous system (CNS), where synaptic partner selection
within a highly complex local environment containing hundreds to thousands of cellular processes remains a key question in both normal development and under pathological conditions.
Invertebrate genetic model systems provide a good starting point for deciphering factors involved in synapse formation and specificity. Several genetic screens at synapses of hermaphrodite-specific motoneurons and AIY interneurons in C. elegans, at
Drosophilaneuromuscular junctions (NMJs) and in theDrosophila visual and olfactory systems have shed light on basic principles and molecules regulating these processes (Collins and DiAntonio, 2007; Goda and Davis, 2003; Owald and Sigrist, 2009; Sanes and Yamagata, 2009; Shen and Scheiffele, 2010). However, it is clear that these findings cannot easily be generalized, and some principles might be used differently, for example at peripheral and at central synapses.
Technical limitations in imaging small structures in the CNS make the experimental dissection of central synaptogenesis particularly complicated. While super-resolution light microscopy is difficult to apply to the three dimensions of a tissue (Huang et al., 2010), serial reconstruction 3D electron microscopy (EM) is immensely time- and labor-intensive. Even with the automation of tissue sectioning in block-face scanning EM (BF-SEM), the workload remains high in the post-imaging analysis phase, particularly for the identification of the structures of interest in the neuropil (Helmstaedter, 2013).
Here, we describe genetic tools for efficient labeling and manipulation of single sensory neuron projections in theDrosophila CNS. We present correlative light and 3D EM in theDrosophilaCNS, and apply this approach to determine the ultrastructure of central projections and synapses of mechanosensory (ms) neurons. To demonstrate the power and practicality of the genetic labeling approach, we combine it with the analysis of gene function by single-cell techniques, and show its applicability for performing genetic screens by RNAi or with loss-of-function mutants. This provides a means to address the molecular and cellular mechanisms of synaptic connectivity and development in the CNS using a powerful combination of specificity, resolution and large sample numbers.
RESULTS
Efficient and reproducible genetic labeling of single mechanosensory neurons
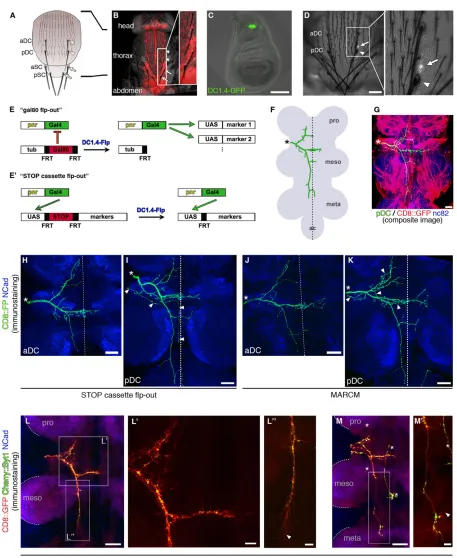
Adult ms neurons that innervate large bristles (macrochaetae) on the
Drosophilathorax are part of the somatosensory system and sense airflow and touch. Four macrochaetae, named anterior/posterior dorsocentral (aDC and pDC, respectively) and anterior/posterior scutellar (aSC and pSC, respectively), are located on each side of the central dorsal thorax (Fig. 1A,B) and are innervated by single ms neurons. Axonal projections of ms neurons in the CNS are large,
Received 5 July 2014; Accepted 17 November 2014
1
Neuronal Wiring Laboratory, Vesalius Research Center, VIB, Herestraat 49 box 912, Leuven 3000, Belgium.2Neuronal Wiring Laboratory, Vesalius Research Center, Department of Oncology, KU Leuven, Herestraat 49 box 912, Leuven 3000, Belgium.3VIB, Bio Imaging Core Gent, Technologiepark 927, Zwijnaarde 9052, Belgium.4Department of Biomedical Molecular Biology, University of Gent, Technologiepark 927, Zwijnaarde 9052, Belgium.5VIB, Center for the Biology of Disease, Herestraat 49 box 602, Leuven 3000, Belgium.6VIB, Inflammation Research Center Microscopy and Cytometry Core, Technologiepark 927, Zwijnaarde 9052, Belgium.
*Authors for correspondence ([email protected]; [email protected])
DEVEL
O
with a total branch length up to 500-600 µm and individual branches up to 100-200 µm (supplementary material Fig. S1A). During pupal stages of development, the axons of ms neurons navigate from the periphery to the CNS, where they elaborate a stereotypic arborization pattern within a highly complex target area, the ventral nerve cord (VNC) (Fig. 1F,G).
In adult flies, lipophilic dye labeling provides a simple method for visualizing axonal projection patterns in the CNS (Chen et al., 2006;
Grillenzoni et al., 1998). However, it has previously not been possible to selectively and efficiently label single ms neuron projections genetically. We utilized two genomic enhancer fragments – the
pannier(pnr)-gal4transcriptional transactivator (Heitzler et al., 1996) (Fig. 1B; supplementary material Fig. S1B) and an enhancer of the
[image:2.612.78.535.50.608.2]achaete-scutelocus, DC1.4 (García-García et al., 1999) (Fig. 1C)–in combination with removal of transcriptional repressors (Gordon and Scott, 2009; Stockinger et al., 2005) to label any of the neurons
Fig. 1.See next page for legend.
DEVEL
O
innervating dorsocentral micro- and macrochaetae with high specificity (Fig. 1E,E′; see Materials and Methods). Fortuitously, the labeling occurs stochastically and only in subsets of cells in each animal. Small clones of few or single labeled neurons (Fig. 1H,I) can be obtained efficiently (up to 50%), and clone size can be modulated (see Materials and Methods).
The DC1.4 tool can also be used for generating MARCM (mosaic analysis with a repressible cell marker) clones (Lee and Luo, 1999). Single clones were recovered with a very high efficiency of∼40% of animals of the right genotype (Fig. 1J,K; supplementary material Table S1); most of the remaining 60% had no clone or clones encompassing only microchaetae. In order to test DC1.4 specificity, we introduced either a ubiquitous or a pan-neuronal transcriptional transactivator (tub-gal4 or nSyb-gal4). Despite the broad driver expression, the labeled clones in the VNC were still restricted to dorsocentral ms neurons (supplementary material Fig. S1C,D). Importantly, this exquisite specificity provides an easy means for the analysis of cell-intrinsic requirements of specific genes of interest selectively in ms neurons. Furthermore, these genetic recombination tools render
the synaptic connectivity of ms neurons amenable to a comprehensive developmental analysis, with the option of subcellular, protein-specific or activity markers (Fig. 1L,M).
Taken together, we generated genetic tools that allow for efficient labeling of single, identified ms neurons targeting in the CNS. The high frequency of recovering small clones offers the opportunity for high-throughput/genome-wide screening approaches.
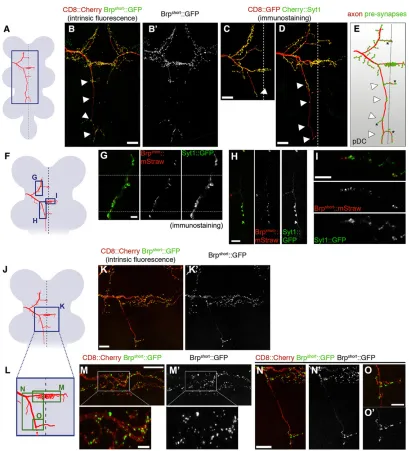
Presynaptic markers accumulate at stereotypic locations along ms neuron axon branches and sparse labeling suggests single active zone resolution
We assessed the localization of putative central presynapses using presynaptic markers. To facilitate the genetic labeling, we created a bi-cistronic 20xUAS-based transgenic marker, which contains an FRT-flanked transcriptional STOP cassette, the axonal marker mCD8::GFP (Lee and Luo, 1999) and synaptic vesicle-associated mCherry-tagged Synaptotagmin 1 (Syt1) (Fernández-Chacón and Südhof, 1999) (supplementary material Fig. S2 and supplementary materials and methods). This allows for labeling of membranes and synaptic vesicles of any neurons of interest in theDrosophilanervous system. We first compared localizations in ms neurons of the mCherry::Syt1 fusion protein, of Brpshort::GFP (5xUAS based) (Fouquet et al., 2009),
a marker that closely colocalizes with the endogenous active zone protein Bruchpilot (Brp) (Schmid et al., 2008; Wagh et al., 2006), and of Cacophony::GFP (5xUAS based) (Kawasaki et al., 2004), a subunit of presynaptic calcium channels.
The location of the markers suggests that ms axons form mostly terminal but alsoen passantsynapses along their central projections (Fig. 2A-E; supplementary material Figs S2 and S3).Unexpectedly, all analyzed presynaptic markers were strongly enriched in the midline region on the main anterior commissure, with dozens of puncta located on many small terminal branches emanating from the main axon shaft. Furthermore, puncta were distributed along the whole length of the anterior projecting branch and on contralateral branches. Finally, along the posterior projecting branch of pDCs, synaptic markers were prominent only in four stereotypic locations separated by long axonal segments devoid of signal. The posterior branch of aDCs has marker accumulation only at its distal tip (Fig. 2C). Importantly, all tested presynaptic markers showed a highly similar localization pattern, supporting the notion that these sites coincide with bona fide synapses and are not sites of marker accumulation that ectopically form due to potential overexpression. To further corroborate this, we co-expressed Brpshort::mStraw (Fouquet et al.,
2009) together with Syt1::GFP (Zhang et al., 2002) in single ms neurons. Syt1 signal was always found in close proximity to Brpshort
puncta (Fig. 2F-I; note that not all Brpshortpuncta are visible, see figure
legend), consistent with synaptic vesicles being clustered around, or in the vicinity of, but not always directly at the active zone. Furthermore, high-magnification imaging of Brpshort::GFP allowed visualization of
discrete puncta in the same size range as single active zones at NMJs (Kittel et al., 2006) (Fig. 2J-O). Our results suggest that single active zones or clusters of a few active zones can be identified in ms neurons. Collectively, the distribution of markers reveals high spatial specificity of different synaptic contact sites in distinct target regions of the VNC. Highly synaptogenic compartments are concentrated at the midline region, whereas regions along the posterior ipsilateral axon segment appear to be poorly synaptogenic.
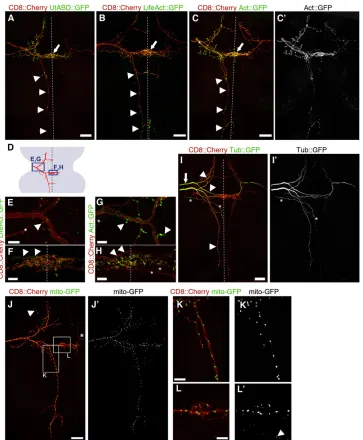
Restricted pattern of F-actin marker accumulation in ms axons
It has been shown that filamentous actin (F-actin) accumulates at presynaptic sites of the HSN motoneurons inC. elegans, and F-actin
Fig. 1. Genetic labeling of single ms neurons in theDrosophilaadult CNS. (A) Schematic of a fly dorsal thorax. Central macrochaetae are depicted: anterior/posterior dorsocentral (aDC/pDC) and anterior/posterior scutellar (aSC/pSC). (B) Dorsal view of a fly expressing mCD8::mCherry driven by pnr-gal4, which is active only in the central domain, encompassing the two DC bristles and the two SC bristles on each side of the thorax (arrowheads and arrows, respectively, in A and B; one side is magnified in the inset in B). Thepnr domain also contains dozens of microchaetae. (C) Third instar larval wing disc containing sensory organ precursors of thoracic bristles (Hartenstein and Posakony, 1989). DC1.4 enhancer activity (visualized by a direct fusion to GFP) is restricted to precursor cells of the dorsocentral domain. (D) Flp-out clone selection on the thorax. Labeling of the right pDC ms neuron is revealed by mCD8::GFP fluorescence in the neuronal cell body (arrow) underneath and slightly anterior to the bristle socket (arrowhead). (E,E′) Schematics of the two different flp-out variants used for ms neuron labeling (see main text, Materials and Methods and supplementary material Table S1 for details). (F) Schematic of a pDC neuron (green) targeting in the VNC (gray). The different thoracic neuromeres ( pro, meso, meta) and the abdominal center (ac) are labeled. Asterisk indicates site of entry of the ms axon in the CNS (as in G-K). (G) pDC neuron visualized by dye filling (green), artificially overlaid onto an image showing a random subset of VNC neurons (red, visualized by driving UAS-mCD8::GFP with an enhancer trap inserted in theCG6678gene). This illustrates the complexity of the ms neuron target area. Blue, neuropil counterstaining (nc82 antibody detecting Brp). (H,I) A single aDC (H) and pDC (I) neuron labeled using Flp to remove the STOP cassette in the reporter construct (genotype given in E′and supplementary material Table S1). Dotted line indicates CNS midline (as in J,K). Arrowheads (I) indicate an unrelated neuron that is often also labeled in conjunction with pDCs, but does not interfere with the analysis of the pDC neuron projection, especially not in the 3D confocal image stack. (J,K) MARCM clones generated with DC1.4-Flp (genotype given in supplementary material Table S1). In addition to the pDC, the aDC neuron on the same side of the animal is also labeled in K ( projections overlap closely, except where indicated by arrowheads). (L-M′) Labeling of single DC axons targeting in the VNC during pupal development, using the STOP cassette flp-out setup (see E′and supplementary material Table S1 and also Fig. 2 and main text for mCherry::Syt1 expression) at∼31-35 h after puparium formation (apf ). Thoracic neuromeres are delineated by dashed lines and labeled as in F. Boxes indicate regions magnified in L′,L″,M′. (L) The growth cone of the posterior branch grows past the posterior border of the mesothoracic neuromere with filopodia aligned in a posterior direction (arrowhead in L″). (M) Sample in which the growth cone has reached the anterior border of the metathoracic neuromere, has finished posterior growth, and extends a filopodium towards the midline (arrowhead in M′) to form the posterior commissure. Asterisks, unrelated neuron. Anterior is top and posterior bottom in all panels except C, where anterior is to the left. Scale bars: 100 µm in C,D; 20 µm in G-L,M; 5 µm in L′,L″,M′.
DEVEL
O
assembly downstream of a cell-adhesion receptor is an early step in presynapse formation in these neurons (Chia et al., 2014, 2012). In order to address links between the cytoskeleton and CNS synapse development in flies, we expressed the F-actin markers LifeAct (Hatan et al., 2011) and Utrophin actin-binding domain::GFP (Rauzi et al., 2010), respectively, as well as a more general Actin
marker (Verkhusha et al., 1999). All three markers showed a discrete punctate distribution pattern that correlates closely with the location of presynaptic markers in ms neurons (Fig. 3A-H, compare with Fig. 2B-D). Furthermore, colabeling of Brpshortand LifeAct
[image:4.612.102.511.54.505.2]revealed a high degree of colocalization (supplementary material Fig. S4). By contrast, GFP-taggedα-Tubulin (Grieder et al., 2000)
Fig. 2. Visualization of individual presynapses in single ms neurons.(A,F,J) Schematics of the VNC (gray) depicting a DC neuron (red) and the regions shown in the indicated panels (blue boxes). (B,B′) Localization of Brpshort::GFP expressed using thegal80flp-out setup (Fig. 1E) in pDC (left) and aDC (right) neurons. Arrowheads indicate four stereotypic locations of marker accumulation in the posterior branch of pDCs. (C) Localization of mCherry::Syt1 expressed in an aDC neuron using the STOP cassette flp-out setup (Fig. 1E′). Arrowhead points to the only site of marker accumulation at the tip of the posterior branch. (D) Localization of mCherry::Syt1 in a pDC, expressed as in C. Arrowheads indicate the same four locations as in B; mCherry::Syt1 also accumulates specifically in these. (E) Schematic summarizing the location of presynaptic markers in pDC neurons. Arrowheads as in B and D. Asterisks, variable branches. (G-I) Brpshort::mStraw and Syt1::GFP, co-expressed in a DC neuron, are closely associated in the anterior projecting branch (G), the posterior projecting branch (H) and in the midline region of the main commissure (I). (G) Mosaic of three single optical sections (separated by dotted lines) in different focal planes. (H) Maximum intensity projection of different optical sections. (I) Single optical section. Close Brpshort::mStraw puncta may not be visible in G and I because they are in a different confocal imaging plane. (K,K′) Overview image of part of a DC neuron labeled with Brpshort::GFP. (L) The region within the blue box in J, with green boxes indicating the regions shown in M-O. (M,M′) High-magnification imaging of Brpshort::GFP in the midline region of the main commissure. Both discrete small puncta in the size range of single active zones of NMJs (Kittel et al., 2006) and larger puncta that are likely to comprise clusters of two to three active zones are observed. (N,N′) Localization of Brpshort::GFP puncta in the first stretch of the posterior projecting branch. (O,O′) High-magnification image of Brpshort::GFP localization in the posterior branch. Anterior is top and posterior bottom in all panels. Scale bars: 20 µm in B-D; 10 µm in K,N and in M main panel; 5 µm in H,I,O; 2.5 µm in M inset; 2 µm in G.
DEVEL
O
accumulates uniformly in the main shaft of the axons, with very little signal in higher order branches (Fig. 3I).
Moreover, expression of a mito-GFP marker (Rizzuto et al., 1995) in ms axons revealed a distribution of mitochondria that is strikingly different to that of the presynaptic and F-actin markers. Mito-GFP was distributed along the entire central projections, with
[image:5.612.128.491.55.495.2]remarkably even spacing between individual loci with mito-GFP signal (Fig. 3J-L). This is in good agreement with the requirement for mitochondria to provide energy throughout the large volume of the axon and to presynaptic active zones (Vos et al., 2010), and is also consistent with proposed roles for mitochondria in axon branch formation (Courchet et al., 2013).
Fig. 3. Localization of cytoskeletal and mitochondrial markers in ms neurons.All markers were expressed from UAS constructs, using thegal80flp-out setup (Fig. 1E), and intrinsic fluorescence was imaged in all panels. Dotted lines represent the midline. (A,B) In pDCs, markers for stable F-actin accumulate along the anterior projecting branch, in the midline region of the anterior commissure (arrow) and at four locations that correspond to the stereotypic regions of synaptic marker accumulation in the posterior projection (arrowheads, compare with Fig. 2B,D,E). The additional three midline-crossing branches also show marker accumulation. (C,C′) Actin::GFP accumulates similarly to the stable F-actin markers. Labels as in A and B. Prominent but weaker Actin::GFP signal is also observed in the shaft of the main axon entering the VNC (asterisk). Both on the left and right side of the VNC the aDC is also labeled. (D) Schematic of the anterior part of a DC neuron (red) and the regions shown in E-H (blue boxes). (E-H) High-magnification images of LifeAct::GFP and Actin::GFP at the first branch point (E,G) and in the midline region of the anterior commissure (F,H). Both markers are enriched on small side branches emerging from the main axon shaft and their varicosities (E,G, arrowheads). On the midline (F,H), they accumulate in puncta on small terminal branches (arrowheads, main axon shaft). Asterisks indicate projections from microchaetae neurons. (I,I′) Tubulin::GFP is uniformly distributed in the shafts of the main axon (arrow) and primary branches (arrowheads), but shows very little signal in higher order terminal branches. Both aDC and pDC are labeled on the left, whereas only the pDC is labeled on the right. For unknown reasons ( possibly perdurance of Gal80), the latter shows weaker signal. Asterisks, unrelated neuron projecting to the midline. (J,J′) The mitochondrial marker mito-GFP localizes to discrete puncta distributed evenly along all axon branches. Arrowhead, mitochondria in other neurons, labeled through leakiness of the UAS-mito-GFP construct in those neurons (note the absence of mCD8::mCherry co-expression). Asterisk, microchaeta neuron. (K-L′) High-magnification images of the boxed regions in J. In L, arrowhead points to nonspecific signal as in J. Anterior is to the top and posterior to the bottom in all panels. Scale bars: 20 µm in A-C,I,J; 5 µm in E-H,K,L.
DEVEL
O
Overall, we show that our genetic labeling of ms neurons allows visualization of various subcellular components at single axon branch resolution in the CNS.
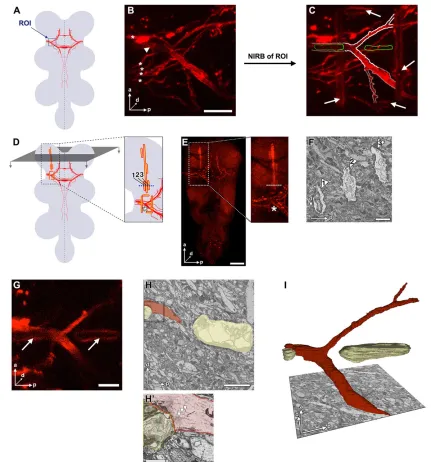
3D ultrastructural analysis of ms axon branches and synapses
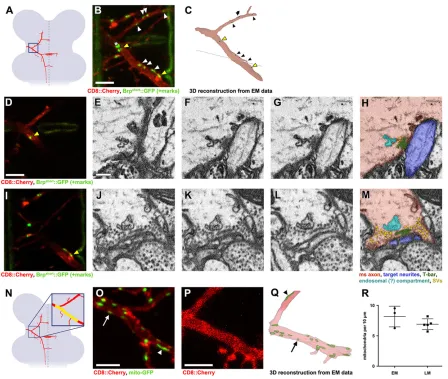
EM remains a gold standard for identifying and characterizing synaptic structures. In order to use EM for the characterization of defined ms neuron axons and synapses, we sought a strategy to correlate genetically encoded marker-based labeling and 3D EM datasets (Fig. 4). We relied on the near-infrared laser branding (NIRB) technique recently developed in mice (Bishop et al., 2011), which consists of generating fiducial branding marks with a near-infrared laser around a structure of interest while imaging the tissue in a confocal light microscope. These laser-induced tissue marks are readily visible in EM and of considerable help in identifying the region of interest (ROI) in the ultrastructural dataset. We expressed the mCD8::mCherry and Brpshort::GFP markers in individual DC neurons
(see Fig. 1E) and, after tissue fixation, the precise spatial location of branch points and putative presynaptic active zones was marked by NIRB (in three dimensions). Simultaneously, completez-stacks of confocal light microscopy scans were recorded (Fig. 4A-C). Additional laser marks were branded from the anterior end of the VNC to the ROI (Fig. 4D-F). Subsequently, these marks functioned as a reliable guide in approaching the ROI by sequentially slicing the resin-embedded tissue. Using the scanning electron microscope (SEM)-integrated robotic ultramicrotome for slicing obviated time-consuming manual steps. A 3D stack of EM images was then recorded in the ROI, and the axon of interest was identified based on its location relative to the branding marks (Fig. 4G-H′).
Once an axon segment of the ms neuron projection was identified, its processes were segmented within each section, either manually or semi-automatically (Cardona et al., 2012; Sommer et al., 2011). 3D reconstruction of the segmented processes allowed precise correlation of the ultrastructure dataset at nanometer resolution with the 3D light microscopy dataset (Fig. 4E,I), and the precise localization of subcellular structures of interest (e.g. presynapses) (Fig. 5B,C). Our 3D correlative light and electron microscopy (3D CLEM) approach thus provided information about ms axon wiring at the level of branch formation and branch targeting, as well as at the ultrastructural level of individual synapses.
3D CLEM revealed the presence of both monadic and polyadic synapses in ms neurons (Fig. 5B-M). Monadic synapses are juxtaposed to a large post-synaptic process (Fig. 5D-H). Small, likely dendritic post-synaptic processes are found contacting polyadic synapses (Fig. 5I-M). In both cases, prominent T-bar-shaped electron-dense bodies and adjacent synaptic vesicles were found at the ms neuron presynapse (Fig. 5E-H,J-M). Many more synaptic vesicles seemed to be present at polyadic presynapses, suggesting a higher physiological activity (Fig. 5E-H,J-M). We often observed an unidentified organelle at ms neuron presynapses, possibly an endosomal compartment. Similar to Drosophila motoneuron synapses (NMJ) and photoreceptor synapses (Prokop and Meinertzhagen, 2006), post-synaptic densities (PSDs) were difficult to discern. A 250-300 nm wide, weakly stained PSD could however be observed at monadic ms neuron synapses, with a few thin filament-like dense projections extending into the cytoplasm (Fig. 5F).
Particularly for the small dimensions of the Drosophila CNS tissue and central neurites, transmission electron microscopy (TEM) provides images with less noise and higher resolution of subcellular structures than BF-SEM. In our approach, however, selective sections in the ROI can be subjected to TEM, should additional
ultrastructural information be required beyond that provided by BF-SEM (supplementary material Fig. S5).
Using 3D CLEM, we were able to verify that Brpshort::GFP
expression is a good indicator for presynaptic active zones in ms neurons. In the EM dataset of the axon segments around its first branch point, we could observe presynaptic densities (T-bars) and/ or synaptic vesicles at all sites where we had observed a punctum of Brpshort::GFP fluorescence (Fig. 5B,C, compare arrowheads).
Conversely, neither T-bars nor an accumulation of synaptic vesicles was observed in any other location in these ms neuron axon segments. These results support the notion that, in ms neurons, Brpshort::GFP labels most if not all chemical presynapses, that it
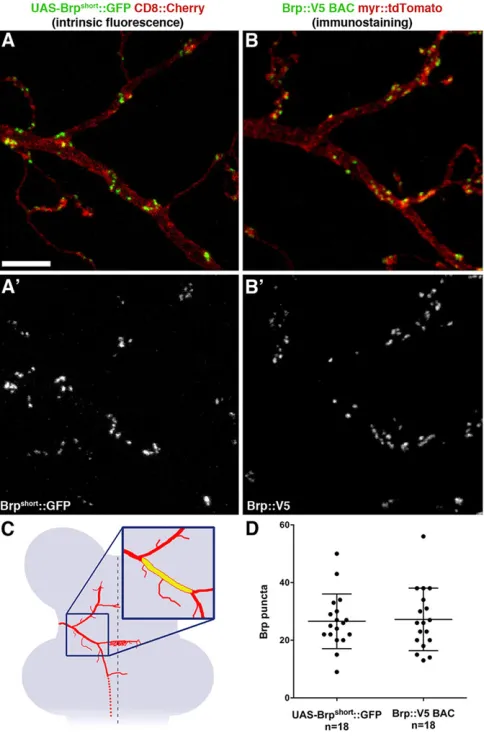
does not accumulate ectopically outside presynapses, and that it thus can be used as a bona fide active zone marker. To further corroborate this, we sought to compare UAS-based Brpshort::GFP expression
with endogenous Brp expression. We used the bacterial artificial chromosome (BAC)-based expression of epitope-tagged Brp (Chen et al., 2014), which has recently been shown to reveal the quantitative as well as temporal profile of endogenous Brp expression. We found that both markers were qualitatively and quantitatively indistinguishable (supplementary material Fig. S6; Fig. 6), indicating that UAS-based Brpshort::GFP expression does
not affect synapse number and location in ms neurons, and indeed reflects the normal distribution of active zones.
We also compared marker-based light microscopy and EM data for the analysis of mitochondria localization in ms axons. This analysis revealed highly similar morphologies and densities of mitochondria at the first axon branch point in the light microscopy and EM datasets (Fig. 5N-R). We found no evidence that overexpression of the mito-GFP marker would significantly alter the shape, number or distribution of mitochondria in ms neurons.
Altogether, we have developed a protocol for rapidly (<3 weeks) obtaining CLEM data of defined neurons in the CNS. We show that ms neurons have presynaptic active zones containing T-bar-shaped dense projections with adjacent presynaptic vesicles, and have an evenly spaced distribution of axonal mitochondria.
Ms neuron-specific genetic manipulation to dissect cell-intrinsic mechanisms of central targeting and synapse formation
Loss-of-function (LOF) analysis in invertebrate model organisms provides an ideal means for dissecting molecular mechanisms of neuronal wiring. We tested the effectiveness of RNAi in ms neurons by targeting genes expected to play roles in axon branching or synaptogenesis. First, we expressed a hairpin construct targeting the
Dscam (Dscam1) gene (Schmucker et al., 2000), which has essential functions in ms neuron axon branch separation and targeting in the CNS (Chen et al., 2006). Dscam knockdown caused severe axon branch targeting phenotypes similar or identical to those reported forDscamnull mutations (supplementary material Fig. S7, Fig. S8A,B, Table S2).
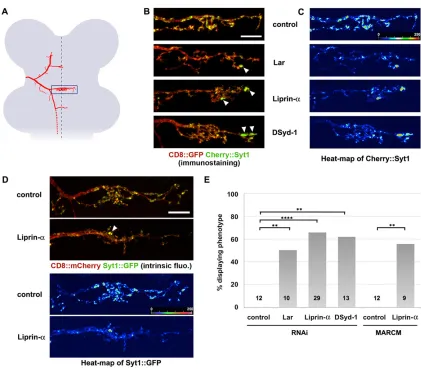
Next, we knocked down Liprin-αin ms neurons by RNAi and examined central branch targeting and synaptogenesis. Liprin-α acts as an important synapse organizer in both vertebrates and invertebrates (Spangler and Hoogenraad, 2007). In Drosophila, Liprin-α is also required for post-synaptic target selection in photoreceptors, but not at the NMJ (Choe et al., 2006; Hofmeyer et al., 2006; Kaufmann et al., 2002). Loss of Liprin-αdid not alter ms axon branching or branch targeting, but led to a pronounced decrease of Syt1 marker along axon branches and an aberrant accumulation of signal at distal tips of axon branches. These defects were especially prominent on the main anterior commissure
DEVEL
O
Fig. 4. A highly efficient 3D CLEM approach for theDrosophilaCNS.(A) Schematic illustrating the location of the first main branch point of ms neurons. ROI, region of interest. (B) Maximum intensity projection of a confocal image stack in the ROI. mCD8::mCherry was expressed with thegal80flp-out setup (see Fig. 1E) and its intrinsic fluorescence imaged. A DC macrochaeta axon (arrowhead) and a few microchaetae axons (asterisks) are labeled. This tissue was fixed strongly with both formaldehyde and glutaraldehyde for subsequent EM, which reduces specific fluorescence and leads to more artifacts (e.g. large blobs of nonspecific signal). (C) Fiducial branding marks applied to the ROI by NIRB and visualized by their autofluorescence. Arrows indicate horizontal and vertical marks delimiting the ROI, as burned into the tissue a few micrometers more ventral than the position of the ms neuron branch point (displacement in the ventral-dorsal direction is not visible in maximum projection). Two additional horizontal marks were applied adjacent to the DC ms axon branch point,‘clasping’it at the same ventral-dorsal depth (outlined in green). DC ms axon branches are outlined in white; strong outlines correspond to the parts of the neuron and marks reconstructed in I, fainter outlines are the continuation of these structures. (D) The strategy for approaching and quickly finding the ROI in the resin-embedded VNC mounted for BF-SEM. A guiding line is branded from the anterior end of the tissue to close to the ROI (long yellow line in magnified inset). This mark can be followed when cutting and imaging the neuropil from anterior to posterior in transverse direction (illustrated by gray plane and arrows). Additional smaller marks are placed to provide information about progress in the anterior-posterior direction (smaller vertical lines). In total, three lines (1-3) are present close to the ROI (asterisk). (E) Branding marks visualized by autofluorescence in the red part of the spectrum, where mCherry fluorescence in the axons is also detected. Branding marks delimiting the ROI show weak fluorescence, whereas guiding lines in the anterior part of the VNC are prominent. Regions shown and labeling correspond to D. Shadows seen in the magnified image come from trachea at the surface of the tissue. (F) EM image of a transverse section during approach of the ROI, at the position corresponding to dotted lines in magnified D and E. Branding marks are promptly identified in the tissue (arrowheads, numbers as in D). (G) Single confocal section in the plane of the ms axon branch point, clasped by two horizontal branding marks (arrows). (H) EM image of a transverse section in which the ms axon ( pseudocolored red) is clasped by the two horizontal branding marks (yellow). (H′) A magnification of the boxed area in H, showing that the ultrastructure of cellular components, such as axonal microtubules (arrowheads) and synaptic vesicles (asterisk), is well preserved even in close proximity to the branding mark. (I) 3D reconstruction of the ms axon (red) and the branding marks (yellow) segmented from the stack of EM images in the ROI. Identity of the neuron is confirmed by correlating its morphology and relative position to the marks with the light microscopy data (C). Body axes are indicated in B,E-I; a, anterior; d, dorsal; p, proximal. Scale bars: 10 µm in B; 50 µm in E; 2 µm in F; 5 µm in G,H; 1 µm in H′.
DEVEL
O
(Fig. 7A-C), where the otherwise strong Syt1 marker signal was lost from most of the numerous terminal branches (Fig. 7B,C; supplementary material Fig. S9). To assess potential off-target effects, we determined the LOF phenotypes of Liprin-α in ms neurons using MARCM analysis (supplementary materials and methods). In Liprin-αLOF, the Syt1 marker also revealed strong defects in synaptogenesis, particularly in the main commissure (Fig. 7D; supplementary material Fig. S9), at a similar penetrance as when Liprin-αwas knocked down by RNAi (Fig. 7E). These results
demonstrate that Liprin-α is required cell-autonomously in ms neurons and that most of the Syt1 marker is lost from presynapses when Liprin-αlevels are reduced.
Liprin-αinteracts with Leukocyte-antigen-related-like (Lar) and DSyd-1 (RhoGAP100F), and overlapping but non-identical phenotypes have been described upon disruption of these genes in
[image:8.612.83.531.55.434.2]Drosophila (Choe et al., 2006; Hofmeyer et al., 2006; Holbrook et al., 2012; Kaufmann et al., 2002). Consistent with a potential shared role of these three factors in synapse assembly, we found
Fig. 5. CLEM at the level of single active zones of a defined neuron in the CNS.(A) Schematic depicting a DC neuron (red) and the ROI shown in B,C (blue box). (B) Maximum intensity projection of a confocal image stack in the ROI. Arrowheads indicate Brpshort::GFP puncta, with the yellow ones corresponding to the active zones shown in D-M. The asterisk indicates a strong nonspecific blob of fluorescence in a different plane. NIRB marks can also be seen. (C) 3D reconstruction of the DC axon segments (red) and presynaptic sites (green puncta) from the EM image stack in the ROI. The dotted line indicates the border between two imaging runs (the reconstructions were stitched together in Adobe Photoshop). Presynapses were identified in single planes of the EM stack (see below). Most of them, including all those on the lower branch, showed a clearly recognizable T-bar-shaped dense projection. For some synapses on the thinner, anterior-projecting branch, a T-bar was hardly discernible, but prominent accumulation of synaptic vesicles was observed. Arrowheads correspond to those in B. Presynapses identified by Brpshort::GFP (B) and by ultrastructural features in the EM stack (C) correlate perfectly in these axon segments. (D) Single confocal section in the plane of a Brpshort::GFP punctum (same arrowhead as in B,C). Two horizontal NIRB marks are also visible. (E-G) Three consecutive BF-SEM images at the position of the Brpshort::GFP punctum shown in D. (H) Same section as in G, pseudocolored according to the legend beneath M. Only a few synaptic vesicles are associated with this T-bar. (I) Single confocal section in the plane of another Brpshort::GFP punctum (arrowhead). (J-L) Three consecutive BF-SEM sections at the position of the Brpshort::GFP punctum shown in I. (M) Same section as in K, with pseudocoloring. Note the high number of vesicles associated with this active zone. (N) Schematic depicting a DC neuron (red) and the region shown in O-Q (blue box). In the magnification, the approximate region in which mitochondria were scored in O-R is indicated in yellow. (O) Mitochondria labeled with mito-GFP, using thegal80flp-out system, in the region shown in N. Arrow and arrowhead point to a round and an elongated mitochondrion, respectively. (P) Light microscopy image of the corresponding region of a DC neuron, in an animal in which the DC neuron is labeled with an axonal marker, but without any mitochondrial marker, and which was subjected to CLEM. (Q) 3D EM reconstruction of axon and mitochondria of the neuron shown in P. Arrow and arrowhead, round and elongated mitochondria. (R) Quantification of mitochondrial density in samples subjected to CLEM (n=3) versus samples expressing mito-GFP and analyzed by light microscopy (LM;n=5) only. Values for all individual samples (with mean±s.d.) are shown. There is no significant difference between the means (P=0.25, unpairedt-test). The slightly higher density measured in the EM samples might be due to tissue shrinkage during EM preparation of the sample. Intrinsic fluorescence was imaged for Brpshort::GFP, mito-GFP and mCD8::mCherry in all panels. BF-SEM images (E-G,J-L) are spaced 40 nm from each other. Scale bars: 5 µm in B,D,O,P; 250 nm in E.
DEVEL
O
aberrant accumulation of the Syt1 marker when either Lar or DSyd-1 was knocked down (Fig. 7B,C; supplementary material Fig. S9). Penetrance and expressivity of the phenotype were very similar for Lar, DSyd-1 and Liprin-αLOF (Fig. 7E). By contrast, Brpshort::GFP
accumulated normally upon LOF of any of the three genes (supplementary material Fig. S10), suggesting that they are not essential for the formation of active zones, but might have a more specific role in synaptic vesicle recruitment and/or tethering. Notably, no defects in axon guidance, branching or targeting in the CNS were observed upon LOF of any of the three genes (supplementary material Figs S8 and S10). Taken together, our results indicate that the primary function of Liprin-α, Lar and DSyd-1 at central synapses of ms neurons is to control a specific aspect of synapse formation (i.e. proper synaptic vesicle recruitment), and that all three are involved in the same process.
DISCUSSION
A new experimental system for studying synapse formation of identified neuronsin vivo
We present efficient genetic labeling of single, identified sensory neurons with a complex and stereotypic targeting pattern in the
DrosophilaCNS. The ability to genetically label and analyze the very same neuron among different animals presents a unique advantage for addressing spatial specificity of synapse formation, stereotypy versus variability/plasticity of the process, and to compare synaptogenesis in wild-type and mutant animals. The light microscopy analysis of Brpshort::GFP localization at central ms
neuron synapses reveals distinct labeling of individual puncta in the size range of single active zones. Comparison with Brp::V5 expressed from a BAC and with ultrastructural data indicates that heterologous expression of the Brpshort::GFP UAS construct does
not lead to ectopic accumulation of the marker along the axon. Simple transactivating tools in ms neurons furthermore result in moderate and reliable expression levels of other synaptic, cytoskeletal and mitochondrial components, suggesting that many markers can be expressed from the large collection of available UAS constructs.
Our genetic labeling approach can be directly combined with knockdown and LOF experiments. It is important to note that our tools allow recovery of small or single-cell clones with an efficiency that is an order of magnitude higher than in current labeling techniques such as MARCM with random and broad Flp expression. The genetic tool-kit that we describe is suited for high-resolution developmental analysis of ms neuron synaptogenesis within the CNS (Fig. 1L,M). This might provide important insights into the sequence of events during central synapse assembly in wild type and mutants.
Our analysis of Lar, Liprin-αand DSyd-1 functions exemplifies that synaptogenesis and primary branch formation can be investigated independently in ms neurons. Upon LOF of either gene, we observed no disruption in the central branch pattern of ms axons, but found a striking disruption of tagged Syt1 localization. High amounts of Syt1 marker accumulating at branch tips suggest that its loss from
en passant synapses is due neither to reduced expression nor defective transport of the marker in mutants. Interestingly, we did not observe abnormal Brpshort::GFP localization in ms neurons upon
LOF of either Lar, Liprin-α or DSyd-1. Although additional experiments will be necessary to support this finding, these results raise the possibility that Lar, Liprin-αand DSyd-1 are required for synaptic vesicle recruitment/tethering but not for active zone formation. This would suggest a remarkable analogy to the situation in the mammalian CNS, where loss of mammalian SYD1A (SYDE1) reduces synaptic vesicle docking at the active zone but not general synapse assembly (Wentzel et al., 2013).
CLEM at the level of single active zones in the CNS
We describe an approach in which a light microscopy image stack and a correlated 3D EM dataset with a segmented neuron of interest and its 3D reconstruction can be obtained within less than 3 weeks. As such, sample preparation and data analysis time are reduced sufficiently to make it feasible to apply 3D CLEM analysis to different developmental stages or multiple mutant strains, and to correlate different subcellular markers with ultrastructural morphologies. It is important to note that, in principle, our protocol can be applied to any region of the CNS and any type of neuron of interest.
Using CLEM, we first find that ms neurons, like many
[image:9.612.53.295.59.427.2]Drosophilaneurons, form a classical T-bar-shaped structure at the presynaptic active zone. Second, in the region analyzed, i.e. around
Fig. 6. UAS-based Brpshort::GFP and BAC-based Brp::V5 are indistinguishable in DC neurons.(A,A′) Localization of Brpshort::GFP, expressed from a UAS construct using thegal80flp-out setup (Fig. 1E), around the first branch point of a DC neuron (same region as in Fig. 5). (B,B′) Localization of Brp::V5, expressed specifically in a single DC neuron from a BAC construct (Chen et al., 2014), around the first branch point of the neuron. (C) Schematic illustrating the region between the first and the second branch points of DC neurons (yellow in magnified inset) used for the quantification shown in D. This region is ideal for quantifications as the branch points provide stereotypic landmarks for defining its borders. (D) The mean number of Brp puncta in the region shown in C is the same for Brpshort::GFP and Brp::V5 expressed from UAS and BAC constructs, respectively (P=0.85, unpairedt-test). Values for all individual samples (with mean±s.d.) are shown. Scale bar: 5 µm.
DEVEL
O
the first branch point of the ms neuron axon, the majority of synapses are polyadic, with one presynapse apposed to several post-synaptic elements. Third, using conventional staining methods the PSDs at ms neuron synapses are not prominent, but rather subtle. These three characteristics also apply to photoreceptor terminals in the fly visual system, and it is worth noting that inDrosophilaboth ms neurons and photoreceptors are histaminergic (Buchner et al., 1993; Pollack and Hofbauer, 1991). Invaginations of glial processes called capitate projections, which are a hallmark of Drosophila photoreceptor presynapses, are not however visible in the ms neuron synapses analyzed, suggesting that they are not a general feature of
Drosophilahistaminergic synapses.
Overall, our genetic tools and CLEM protocol will allow the investigation of mechanisms of ms neuron synapse formation, tackling a wide range of biological questions pertaining to the development and plasticity of central synapses.
MATERIALS AND METHODS Drosophilastrains
Genotypes of flies used in this study are listed in supplementary material Table S1 and fly stocks are further described in the supplementary materials and methods.
Genetic labeling and MARCM of DC ms neurons
Details of constructs are provided in the supplementary materials and methods. The DC1.4 enhancer is active in precursors of DC neurons only (Fig. 1C) (García-García et al., 1999). Functional DC1.4-Flp insertions were
recovered on the second and third chromosomes. In flp-out setups,pnr-gal4
activity was restricted by using DC1.4-Flp to excise either an FRT-flanked
gal80cassette (Gordon and Scott, 2009) or an FRT-flanked transcriptional
[image:10.612.94.515.52.421.2]STOP cassette from a direct reporter construct (supplementary material Fig. S2). Clone size depends on the cassette to be excised and on the temperature at which the flies are raised; smaller clones are obtained at 29°C than at 25°C, probably reflecting the shorter time for the Flp-mediated Fig. 7. Liprin-α, Lar and DSyd-1 are required for presynaptic vesicle marker localization at central ms neuron synapses.(A-C) Knockdown of Lar, Liprin-α and DSyd-1 in DC neurons and concurrent genetic labeling using the STOP cassette flp-out setup (Fig. 1E′). (A) Schematic depicting the localization of the DC neuron midline region, as shown in B-D (blue box). (B) In controls (top panel), fluorescence of the Syt1 marker accumulates in many puncta distributed evenly along the main midline-crossing axon branch and all terminal side branches. By contrast, upon knockdown of Lar, Liprin-αor DSyd-1, the Syt1 marker is strongly reduced along most of these sites and accumulates heavily at the tip of one or two branches, usually in the most distal part of the axon (arrowheads). (C) Heat-map of Syt1 marker fluorescence. Note the strong accumulation (red) of Syt1 marker in distal branch tips upon RNAi. (D) MARCM using either a control chromosome or a chromosome containing ahobotransposable element inserted at the 5′splice site of the firstLiprin-αintron (see supplementary materials and methods). In theLiprin-αmutant clone, consistent with the RNAi phenotype, the vast majority of the Syt1 marker accumulates at two loci in the midline commissure (arrowhead, see also heat-map beneath). These loci are at the tip of terminal branches (not visible in the maximum intensity projection of the confocal stack). (E) Quantification of the penetrance of the phenotype shown in B-D. Shown is the percentage of animals with a clear phenotype that could also be recognized when blinded to the genotype. The number of animals analyzed is indicated within each bar. **P<0.01; ****P<0.0001 (Fisher’s exact test). Scale bars: 10 µm.
DEVEL
O
cassette excision to occur when the animal develops faster. Use of the
FRT-flankedgal80repressor (Gordon and Scott, 2009) results in almost
all animals having at least one neuron innervating a macrochaeta labeled at 25°C, with most animals having two to three macrochaetae neurons and several microchaetae neurons labeled (see Figs 2 and 3). At 29°C, the same repressor cassette allows recovery of single macrochaetae clones in
∼10-20% of the animals, while most of the remainder have only a
microchaeta neuron labeled or no neuron at all. With the transcriptional
STOP cassette in the UAS construct (Fig. 1E′; supplementary material
Fig. S2), 10-20% of animals raised at 25°C have a clone, which usually consists of a single macrochaeta (see Fig. 1H,I). FRTG13 (Fig. 1J,K) or FRT40A (Fig. 7D; supplementary material Fig. S8G,H) was used to
generate MARCM clones with DC1.4-Flp. In either case,∼40% of animals
with small clones were recovered at 25°C.
In vivoRNAi
RNAi-induced knockdown of gene expression in ms neurons was assessed using two different flp-out variants, as illustrated in Fig. 1E,E′. For details, see the supplementary materials and methods.
Immunohistochemistry and imaging
Immunostaining of VNCs, carbocyanine dye labeling, imaging of native GFP and mCherry fluorescence and processing of fluorescence microscopy images, including segmentation and 3D reconstruction, are described in the supplementary materials and methods.
Correlative light and electron microscopy
VNCs of flies of genotypew tub>gal80>; UAS-Brpshort::GFP DC1.4-Flp/
+; pnr-gal4 UAS-mCD8::mCherry/TM6were dissected in cold cacodylate
buffer (0.15 M Na cacodylate buffer, pH 7.2), immediately transferred to freshly prepared fixative comprising 2% paraformaldehyde and 0.5% glutaraldehyde [both EM grade from Electron Microscopy Sciences (EMS)] in cacodylate buffer, and fixed overnight at 4°C (although weaker than with milder fixation protocols, the intrinsic fluorescence of fluorescent proteins could still be imaged under these conditions, but was almost non-existent at
glutaraldehyde concentrations≥1%). Samples were washed three times for
5 min each in cacodylate buffer and then mounted ventral side up on a slide just before the branding procedure, in the same buffer. NIRB was performed according to Bishop et al. (2011) on a Zeiss LSM710 upright confocal microscope, using the bleaching function of the ZEN 2010 software (Zeiss). A Mai Tai DeepSee two-photon laser (Spectra-Physics) was tuned to 910 nm and used at 90-95% maximal output power to scan lines defined for branding, with a pixel dwell time of a few microseconds. After branding and imaging, the VNC was unmounted and post-fixed in 2% glutaraldehyde in cacodylate buffer for 2 h at room temperature, then washed three times for at least 5 min each in cacodylate buffer. Samples were osmicated in 2%
osmium (EMS), 1.5% ferrocyanide and 2 mM CaCl2in cacodylate buffer
for 1 h on ice, and washed extensively in ultrapure water (UPW), followed by incubation in 1% thiocarbohydrazide (20 min at room temperature), with subsequent washes in UPW and a second osmication in 2% osmium in UPW (30 min at room temperature). Samples were washed five times for 3 min each in UPW, then incubated in 2% uranyl acetate at 4°C overnight.
Walton’s lead aspartate (20 mM, pH 5.5, in 30 mM L-aspartic acid solution)
staining was performed for 30 min at 60°C. After final washing steps, samples were dehydrated using ice-cold solutions of increasing ethanol concentration (30%, 50%, 70%, 90%, twice with 100%), followed by twice with 100% acetone for 30 min each. Finally, VNCs were infiltrated and embedded in Durcupan resin (EMS).
For BF-SEM, resin-embedded VNCs were mounted on an aluminum specimen pin (Gatan) using conductive epoxy (Circuit Works). Trimmed and smoothed samples were coated with 5 nm of platinum in a Quorum sputter coater. Aluminium pins were placed in the Gatan 3View2 in a Zeiss Merlin SEM for imaging at 1.9 kV EHT and probe current of 77 pA (resulting in a spot size <2 nm) and at 2 nm image pixels with a Gatan Digiscan II ESB detector. Slicing was performed at 100 nm for approach, and at 40 nm within the ROI.
TEM is described in the supplementary materials and methods.
Acknowledgements
We thank Dierk Reiff, Matthew Holt and Joris de Wit for critical reading of the manuscript; Sonia Bartunkova for EM sample preparation; Sebastien Phan and Thomas Deerinck for input and help with CLEM and with image processing; the Bloomington Drosophila Stock Center, Thomas Lecuit, Richard Ordway and Stephan Sigrist for fly stocks; and Norbert Perrimon, Sylvain Marcellini and Pat Simpson for plasmids. The nc82 and DN-Ex #8 monoclonal antibodies, developed by Erich Buchner and Tadashi Uemura, respectively, were obtained from the Developmental Studies Hybridoma Bank, created by the NICHD of the NIH and maintained at The University of Iowa, Department of Biology, Iowa City, IA 52242, USA. The SEM with integrated robotic ultramicrotome was acquired through a CLEM grant from Minister Lieten and the Flemish government to the VIB BioImaging Core.
Competing interests
The authors declare no competing financial interests.
Author contributions
Design and interpretation of experiments: O.U., D.D., M.P., H.H., D.A., A.K., C.J.G. and D.S. Acquisition of data: O.U., A.I., D.D., M.P., H.H., D.A., A.K., S.L. and P.B. Analysis of data: O.U., A.I., D.D., M.P., H.H., D.A. and D.S. Provision of administrative and technical support: C.J.G. and D.S. Writing the manuscript: O.U. and D.S. Reading and editing the manuscript: all authors.
Funding
This work was supported by: Vlaams Instituut voor Biotechnologie (VIB) funding; Fonds Wetenschappelijk Onderzoek - Vlaanderen (FWO) [G059611N, G078913N and G077013N to D.S.]; Belgian Science Policy Office (BELSPO) IUAP VII-20 ‘WIBRAIN Project’(D.S.); Swiss National Science Foundation Fellowship for Prospective Researchers to O.U. [PBBEP3_130209]; an FWO Fellowship to D.D.; and an EMBO Fellowship to M.P.
Supplementary material
Supplementary material available online at
http://dev.biologists.org/lookup/suppl/doi:10.1242/dev.115071/-/DC1
References
Bishop, D., Nikić, I., Brinkoetter, M., Knecht, S., Potz, S., Kerschensteiner, M. and Misgeld, T.(2011). Near-infrared branding efficiently correlates light and electron microscopy.Nat. Methods8, 568-570.
Buchner, E., Buchner, S., Burg, M. G., Hofbauer, A., Pak, W. L. and Pollack, I.
(1993). Histamine is a major mechanosensory neurotransmitter candidate in Drosophila melanogaster.Cell Tissue Res.273, 119-125.
Cardona, A., Saalfeld, S., Schindelin, J., Arganda-Carreras, I., Preibisch, S., Longair, M., Tomancak, P., Hartenstein, V. and Douglas, R. J. (2012). TrakEM2 software for neural circuit reconstruction.PLoS ONE7, e38011.
Chen, B. E., Kondo, M., Garnier, A., Watson, F. L., Püettmann-Holgado, R., Lamar, D. R. and Schmucker, D.(2006). The molecular diversity of Dscam is functionally required for neuronal wiring specificity in Drosophila. Cell 125, 607-620.
Chen, Y., Akin, O., Nern, A., Tsui, C. Y. K., Pecot, M. Y. and Zipursky, S. L.(2014). Cell-type-specific labeling of synapses in vivo through synaptic tagging with recombination.Neuron81, 280-293.
Chia, P. H., Patel, M. R. and Shen, K.(2012). NAB-1 instructs synapse assembly by linking adhesion molecules and F-actin to active zone proteins.Nat. Neurosci.15, 234-242.
Chia, P. H., Li, P. and Shen, K.(2013). Cell biology in neuroscience: cellular and molecular mechanisms underlying presynapse formation.J. Cell Biol.203, 11-22.
Chia, P. H., Chen, B., Li, P., Rosen, M. K. and Shen, K.(2014). Local F-actin network links synapse formation and axon branching.Cell156, 208-220.
Choe, K.-M., Prakash, S., Bright, A. and Clandinin, T. R.(2006). Liprin-alpha is required for photoreceptor target selection in Drosophila.Proc. Natl. Acad. Sci. USA103, 11601-11606.
Collins, C. A. and DiAntonio, A.(2007). Synaptic development: insights from Drosophila.Curr. Opin. Neurobiol.17, 35-42.
Courchet, J., Lewis, T. L., Lee, S., Courchet, V., Liou, D.-Y., Aizawa, S. and Polleux, F.(2013). Terminal axon branching is regulated by the LKB1-NUAK1 kinase pathway via presynaptic mitochondrial capture.Cell153, 1510-1525.
Fernández-Chacón, R. and Südhof, T. C.(1999). Genetics of synaptic vesicle function: toward the complete functional anatomy of an organelle.Annu. Rev.
Physiol.61, 753-776.
Fouquet, W., Owald, D., Wichmann, C., Mertel, S., Depner, H., Dyba, M., Hallermann, S., Kittel, R. J., Eimer, S. and Sigrist, S. J.(2009). Maturation of active zone assembly by Drosophila Bruchpilot.J. Cell Biol.186, 129-145.
Garcıa-Garć ıa, M. J., Ramain, P., Simpson, P. and Modolell, J.́ (1999). Different contributions of pannier and wingless to the patterning of the dorsal mesothorax of
Drosophila.Development126, 3523-3532.
DEVEL
O
Goda, Y. and Davis, G. W. (2003). Mechanisms of synapse assembly and disassembly.Neuron40, 243-264.
Gordon, M. D. and Scott, K.(2009). Motor control in a Drosophila taste circuit.
Neuron61, 373-384.
Grieder, N. C., de Cuevas, M. and Spradling, A. C.(2000). The fusome organizes the microtubule network during oocyte differentiation in Drosophila.Development
127, 4253-4264.
Grillenzoni, N., van Helden, J., Dambly-Chaudière, C. and Ghysen, A.(1998).
The iroquois complex controls the somatotopy of Drosophila notum
mechanosensory projections.Development125, 3563-3569.
Hartenstein, V. and Posakony, J. W.(1989). Development of adult sensilla on the wing and notum of Drosophila melanogaster.Development107, 389-405.
Hatan, M., Shinder, V., Israeli, D., Schnorrer, F. and Volk, T.(2011). The Drosophila blood brain barrier is maintained by GPCR-dependent dynamic actin structures.J. Cell Biol.192, 307-319.
Heitzler, P., Haenlin, M., Ramain, P., Calleja, M. and Simpson, P. (1996). A genetic analysis of pannier, a gene necessary for viability of dorsal tissues and bristle positioning in Drosophila.Genetics143, 1271-1286.
Helmstaedter, M.(2013). Cellular-resolution connectomics: challenges of dense neural circuit reconstruction.Nat. Methods10, 501-507.
Hofmeyer, K., Maurel-Zaffran, C., Sink, H. and Treisman, J. E.(2006). Liprin-alpha has LAR-independent functions in R7 photoreceptor axon targeting.Proc.
Natl. Acad. Sci. USA103, 11595-11600.
Holbrook, S., Finley, J. K., Lyons, E. L. and Herman, T. G.(2012). Loss of syd-1 from R7 neurons disrupts two distinct phases of presynaptic development.
J. Neurosci.32, 18101-18111.
Huang, B., Babcock, H. and Zhuang, X.(2010). Breaking the diffraction barrier: super-resolution imaging of cells.Cell143, 1047-1058.
Jin, Y. and Garner, C. C. (2008). Molecular mechanisms of presynaptic differentiation.Annu. Rev. Cell Dev. Biol.24, 237-262.
Kaufmann, N., DeProto, J., Ranjan, R., Wan, H. and Van Vactor, D.(2002). Drosophila liprin-alpha and the receptor phosphatase Dlar control synapse morphogenesis.Neuron34, 27-38.
Kawasaki, F., Zou, B., Xu, X. and Ordway, R. W.(2004). Active zone localization of presynaptic calcium channels encoded by the cacophony locus of Drosophila.
J. Neurosci.24, 282-285.
Kittel, R. J., Wichmann, C., Rasse, T. M., Fouquet, W., Schmidt, M., Schmid, A., Wagh, D. A., Pawlu, C., Kellner, R. R., Willig, K. I. et al.(2006). Bruchpilot promotes active zone assembly, Ca2+ channel clustering, and vesicle release.
Science312, 1051-1054.
Lee, T. and Luo, L.(1999). Mosaic analysis with a repressible cell marker for studies of gene function in neuronal morphogenesis.Neuron22, 451-461.
Owald, D. and Sigrist, S. J.(2009). Assembling the presynaptic active zone.Curr.
Opin. Neurobiol.19, 311-318.
Pollack, I. and Hofbauer, A.(1991). Histamine-like immunoreactivity in the visual system and brain of Drosophila melanogaster.Cell Tissue Res.266, 391-398.
Prokop, A. and Meinertzhagen, I. A. (2006). Development and structure of synaptic contacts in Drosophila.Semin. Cell Dev. Biol.17, 20-30.
Rauzi, M., Lenne, P.-F. and Lecuit, T. (2010). Planar polarized actomyosin contractile flows control epithelial junction remodelling.Nature468, 1110-1114.
Rizzuto, R., Brini, M., Pizzo, P., Murgia, M. and Pozzan, T.(1995). Chimeric green fluorescent protein as a tool for visualizing subcellular organelles in living cells.
Curr. Biol.5, 635-642.
Sanes, J. R. and Yamagata, M.(2009). Many paths to synaptic specificity.Annu.
Rev. Cell Dev. Biol.25, 161-195.
Schmid, A., Hallermann, S., Kittel, R. J., Khorramshahi, O., Frölich, A. M. J., Quentin, C., Rasse, T. M., Mertel, S., Heckmann, M. and Sigrist, S. J.(2008). Activity-dependent site-specific changes of glutamate receptor composition in vivo.Nat. Neurosci.11, 659-666.
Schmucker, D., Clemens, J. C., Shu, H., Worby, C. A., Xiao, J., Muda, M., Dixon, J. E. and Zipursky, S. L.(2000). Drosophila Dscam is an axon guidance receptor exhibiting extraordinary molecular diversity.Cell101, 671-684.
Shen, K. and Scheiffele, P.(2010). Genetics and cell biology of building specific synaptic connectivity.Annu. Rev. Neurosci.33, 473-507.
Sheng, M. and Kim, E.(2011). The postsynaptic organization of synapses.Cold
Spring Harb. Perspect. Biol.3, a005678.
Sommer, C., Straehle, C., Kothe, U. and Hamprecht, F. A. (2011). Ilastik:
Interactive Learning and Segmentation Toolkit, pp. 230-233. IEEE.
Spangler, S. A. and Hoogenraad, C. C.(2007). Liprin-alpha proteins: scaffold molecules for synapse maturation.Biochem. Soc. Trans.35, 1278-1282.
Stockinger, P., Kvitsiani, D., Rotkopf, S., Tirián, L. and Dickson, B. J.(2005). Neural circuitry that governs Drosophila male courtship behavior.Cell 121, 795-807.
Verkhusha, V. V., Tsukita, S. and Oda, H.(1999). Actin dynamics in lamellipodia of migrating border cells in the Drosophila ovary revealed by a GFP-actin fusion protein.FEBS Lett.445, 395-401.
Vos, M., Lauwers, E. and Verstreken, P.(2010). Synaptic mitochondria in synaptic transmission and organization of vesicle pools in health and disease.Front.
Synaptic Neurosci.2, 139.
Wagh, D. A., Rasse, T. M., Asan, E., Hofbauer, A., Schwenkert, I., Dürrbeck, H., Buchner, S., Dabauvalle, M.-C., Schmidt, M., Qin, G. et al.(2006). Bruchpilot, a protein with homology to ELKS/CAST, is required for structural integrity and function of synaptic active zones in Drosophila.Neuron49, 833-844.
Wentzel, C., Sommer, J. E., Nair, R., Stiefvater, A., Sibarita, J.-B. and Scheiffele, P. (2013). mSYD1A, a mammalian synapse-defective-1 protein, regulates synaptogenic signaling and vesicle docking.Neuron78, 1012-1023.
Yamagata, M., Sanes, J. R. and Weiner, J. A. (2003). Synaptic adhesion molecules.Curr. Opin. Cell Biol.15, 621-632.
Zhang, Y. Q., Rodesch, C. K. and Broadie, K.(2002). Living synaptic vesicle marker: synaptotagmin-GFP.Genesis34, 142-145.