IJPSR (2019), Volume 10, Issue 8 (Research Article)
Received on 27 November 2018; received in revised form, 27 March 2019; accepted, 29 March 2019; published 01 August 2019
A NOVEL RP- HPLC METHOD FOR THE QUANTIFICATION OF CABOZANTINIB IN ACTIVE PHARMACEUTICAL INGREDIENTS AND PHARMACEUTICAL DOSAGE FORMS
Arun Kumar Kuna *, Ganapathi Seru and G. V. Radha
Department of Pharmaceutical Analysis, Gitam Institute of Pharmacy, Gitam University (Deemed to be University), Rushikonda, Visakhapatnam - 530045, Andhra Pradesh, India.
ABSTRACT: A simple, specific, accurate reversed-phase high performance
liquid chromatographic method was developed for the quantification of Cabozantinib. Although extensive studies on Cabozantinib have been developed for determining Cabozantinib in human place and urine by LC-MS, studies on the pharmaceutically active ingredient and formulation are scarce. The effective separation was achieved through BDS C18 150 × 4.6 mm, 5 using a mobile phase KH2PO4 Buffer and ACN (55:45% v/v). The flow rate of the mobile phase was 1.0 mL/min, and the detection was carried at a wavelength of 210 nm. The retention time of Cabozantinib was 2.932 nm. The correlation coefficient is 0.9998. The developed method was validated in terms of system suitability, specificity, linearity range, precision, accuracy, limits of detection and quantification. Degradation studies were performed on Cabozantinib to indicate the stability property and specificity of the proposed method. The information presented in this study will be useful for industrial application for determining Cabozantinib in active pharmaceutical ingredient and pharmaceutical dosage form.
INTRODUCTION: Cabozantinib is a medication used to treat medullary thyroid cancer and a second line treatment for renal cell carcinoma among others. It is a small molecule inhibitor of the tyrosine kinases c-Met and VEGFR2 and also inhibits AXL and RET. Cabozantinib is used in two forms. A capsule form is used since 2012 to treat medullary thyroid cancer 1, 2 and a tablet form is used since 2016 as a second line treatment for renal cell carcinoma 3, 4. Pharmacologically it inhibits the following receptor tyrosine kinases: MET (hepatocyte growth factor receptor protein) and VEGFR, RET, GAS6 receptor (AXL), KIT), and Fms-likely tyrosine kinase-3 (FLT3).
QUICK RESPONSE CODE
DOI:
10.13040/IJPSR.0975-8232.10(8).3963-69
The article can be accessed online on
www.ijpsr.com
DOI link: http://dx.doi.org/10.13040/IJPSR.0975-8232.10(8).3963-69
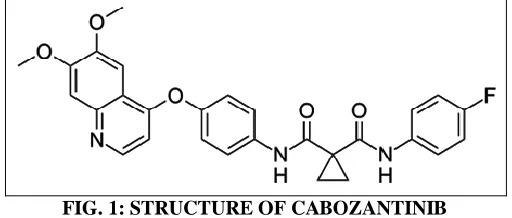
[image:1.612.312.568.557.666.2]As analytical methods must be validated before use in the pharmaceutical process, the proposed method was validated by ICH (International Conference on Harmonization) guidelines 5, 6, 7. Cabozantinib Fig. 1 is chemically 1- N- [4- (6, 7-dimethoxyquinolin-4-yl)oxyphenyl]-1- N'- (4- fluorophenyl) cyclopropane- 1, 1-dicarboxamide
FIG. 1: STRUCTURE OF CABOZANTINIB
From the literature survey, it was known that there were no methods developed and validated for the determination of Cabozantinib with RP-HPLC. So this study on RP-HPLC was developed to keep this research method simple, sensitive and accurate.
Keywords:
Cabozantinib, RP-HPLC, Validation, Method Development
Correspondence to Author: Arun Kumar Kuna
Research Scholar,
Department of Pharmaceutical Analysis,
Gitam Institute of Pharmacy, Gitam University (Deemed to be University),
Rushikonda, Visakhapatnam - 530045,
Andhra Pradesh, India.
This method was developed and validated with parameters like accuracy, linearity, LOD, LOQ, precision, specificity, system suitability and forced degradation studies 8.
MATERIAL AND METHODS:
Materials: The active pharmaceutical ingredient and pharmaceutical dosage form were kindly gifted by Spectrum Laboratories, Hyderabad. HPLC grade water, acetonitrile is of Merck, Mumbai, and potassium dihydrogen othro phosphate used was of SD fine chem limited, Mumbai. Instruments like Waters HPLC (Empower software), ultrasonicator (Make: Labman) and pH meter (Make: Adwa) are used for developing this method.
Instrumentation and Chromatographic
Conditions: All separations were carried out on HPLC waters with a PDA detector. The data was analyzed by using Empower software. Chromatographic separation was performed on column BDS C18 150 × 4.6 mm, 5 µ. Gradient binary pump was used with ambient column temperature. The components of the mobile phase used for this gradient elution are KH2PO4 Buffer and ACN (55:45) with flow rate as 1.0ml/min. The injection volume was 20 µl. Detection was performed at 210 nm with a PDA detector.
Selection and Preparation of Mobile Phase:
Buffer and ACN: taken in the ratio 55:45. 0.01N KH2PO4 Buffer: Accurately weighed 1.36 gm of Potassium dihydrogen Orthophosphate in a 1000 ml of Volumetric flask add about 900 ml of milli-Q water added and degas to sonicate and finally made up the volume with water then pH adjusted to 3.32 with dil. Orthophosphoric acid solution.
Preparation of Standard Solution: Accurately Weighed and transferred 5.0 mg of Cabozantinib, working Standards into a 25 ml clean dry volumetric flasks, added 10 ml of diluents, sonicated for 10 minutes and made up to the final volume with diluents (200 µg/ml Cabozantinib).
Preparation of Sample Solution: Accurately weighed equivalent weight of the powder sample transfer into a 50 ml volumetric flask, 25ml of diluents was added and sonicated for 25 min, further the volume was made up with diluent and filtered by HPLC filters (400 µg/ml Cabozantinib) 0.5ml of filtered sample stock solution was
transferred to 10 ml volumetric flask and made up with diluent (20 µg/ml Cabozantinib).
Method validation:
Specificity: Commonly used excipients were spiked into a pre-weighed quantity of drugs. The chromatogram was taken by appropriate dilutions, and the quantities of drugs were determined.
System Suitability: System suitability test was an integral part of method development and is used to ensure adequate performance of the chromatographic system.
Linearity and Range: In the chromatographic method, linearity generates test effects which are directly proportionate to the concentration of an analyte within the given range. The range is defined as an interval between the upper and lower extent of analytes in the sample. Cabozantinib had linearity in the range of 5 - 30 μg/ml. The correlation coefficient was found to be 0.9998.
Precision: The intraday and interday precision study of Cabozantinib was carried out by estimating the corresponding responses five times on the same day and different days. The results were reported in terms of relative standard deviation.
The Repeatability studies were carried out by estimating the response of five different concentrations of Cabozantinib and results are reported in terms of relative standard deviation (% RSD).
Accuracy: The accuracy of the developed method was determined by calculating recovery of Cabozantinib by spike method, a known amount of Cabozantinib was added to a pre quantified sample solution, and the amount of Cabozantinib was estimated by measuring the peak areas and by fitting these values to the straight-line equation of calibration curve.
Detection and Quantification Limits: The level of quantification (LOQ) and detection (LOD) were conducted by a signal to noise ratio method.
Degradation Studies:
(H2O2) was added separately. The solutions were kept for 30 min at 60 ºC. For HPLC study, the resultant solution was diluted to obtain (20ppm) solution and 10 µl were injected into the system, and the chromatograms were recorded to assess the stability of the sample.
Acid Degradation Studies: To 1 ml of stock solution Cabozantinib 1 ml of 2N Hydrochloric acid was added and refluxed for 30 min at 60 ºC. The resultant solution was diluted to obtain (20ppm) solution, and 10 µl solutions were injected into the system, and the chromatograms were recorded to assess the stability of the sample.
Alkali Degradation Studies: To 1 ml of stock solution Cabozantinib 1 ml of 2 N sodium hydroxide was added and refluxed for 30 min at 60 ºC. The resultant solution was diluted to obtain (20ppm) solution and 10 µl were injected into the system, and the chromatograms were recorded to assess the stability of the sample.
Dry Heat Degradation Studies: The standard drug solution was placed in an oven at 105 ºC for 6 h to study dry heat degradation. For HPLC study, the resultant solution was diluted to (20 ppm) solution and 10 µl were injected into the system and the chromatograms were recorded to assess the stability of the sample.
Photo Stability Studies: The photochemical stability of the drug was also studied by exposing the (400 ppm) solution to UV Light by keeping the beaker in UV Chamber for 7 days or 200 Watt-hours/min photostability chamber.
For HPLC study, the resultant solution was diluted to obtain (20 ppm) solutions and 10 µl were injected into the system, and the chromatograms were recorded to assess the stability of the sample.
Neutral Degradation Studies: Stress testing under neutral conditions was studied by refluxing the drug in water for 6 h at a temperature of 60 ºC. For HPLC study, the resultant solution was diluted to (20ppm) solution and 10 µl were injected into the system and the chromatograms were recorded to assess the stability of the sample.
RESULTS AND DISCUSSION:
Specificity: This RP-HPLC method was specific. The retention time for Cabozantinib was 2.932 min. Specificity results were represented in Table 1,
[image:3.612.55.566.375.718.2]Fig. 2a for blank and Fig. 2b for the drug.
TABLE 1: SPECIFICITY DATA FOR RP-HPLC
S. no. Peak Name Observation
1 Blank Nil
2 Placebo Nil
3 Standard Rt = 2.932 min λ max = 210 nm
FIG. 2A: SPECIFICITY CHROMATOGRAM FOR BLANK FIG. 2B: SPECIFICITY CHROMATOGRAM FOR DRUG
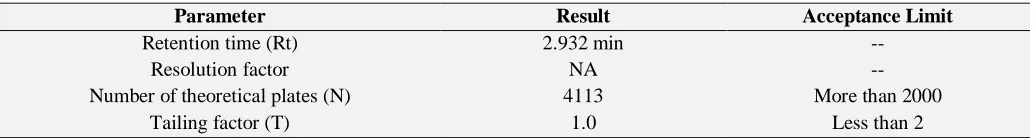
System Suitability: Tailing factor was 1.0 (T), and some theoretical plates were found to be 4113 (N).
System Suitability results were represented in
Table 2.
TABLE 2: RESULTS OF SYSTEM SUITABILITY
Parameter Result Acceptance Limit
Retention time (Rt) 2.932 min --
Resolution factor NA --
Number of theoretical plates (N) 4113 More than 2000
[image:3.612.49.566.685.754.2]Linearity and Range: Linearity was determined for concentration 5 to 30 µg/ml. The correlation coefficient was 0.9998. Linearity results were represented in Table 3 and co-relation graph in
Fig. 3.
Precision: In method validation, intraday and interday precision determined. The % RSD for interday precision is 0.2 and intraday is 0.2. Precision results were represented in Table 4.
FIG. 3: CORRELATION GRAPH
TABLE 3: LINEARITY AND RANGE
S. no. Concentration (µg/ml) Peak Area
1 5 410289
2 10 815536
3 15 1226729
4 20 1618912
5 25 2039133
6 30 2409400
TABLE 4: RESULTS FOR INTRADAY AND
INTERDAY PRECISION
S. no. Intraday precision
Area
Interday precision Area
1 1618816 1605676
2 1612553 1608530
3 1617141 1603472
4 1614090 1604331
5 1612355 1605164
6 1610192 1612555
Mean 1614191 1606621
Std Dev 3229.5 3377.4
% RSD 0.2 0.2
Accuracy: The % Mean recovery for accuracy was in the range of 98.98 to 100.49. Accuracy results were represented in Table 5.
TABLE 5: RESULTS FOR ACCURACY
Spiked Concentration
(μg/ml) Peak area (n=3)
Amount added
(μg/ml) Amount Found (μg/ml) Recovery Recovery % Mean
50 2418734 10 9.85 98.51 98.98
2423571 9.91 99.11
2425220 9.93 99.32
100 3256107 20 20.21 101.07 100.56
3246153 20.09 100.46
3241004 20.03 100.14
150 4062142 30 30.19 100.63 100.49
4058979 30.15 100.50
4055178 30.10 100.34
Detection and Quantification Limits: The sensitivity for detection was demonstrated by determining the LOD. The LOD was found to be 0.03 µg/ml, and the quantification limit was the lowest concentration of a substance that can be
quantified with precision and accuracy. The LOQ was determined to be 0.10 µg/ml for Cabozantinib. The level of quantification (LOQ) and detection (LOD) were represented in Table 6 and Fig. 4, Fig. 5.
TABLE 6: LOD & LOQ
Parameter Results
LOD LOQ
RT 3.056 3.061
Area 51837 86208
s/n value 18.8 73.0
Plate count 3717.9 3856.0 Degradation Studies: Degradation studies related to acid, base, peroxide, thermal, UV and water were represented in Table 7. Fig. 6 represents acid degradation chromatograph and Fig. 7 represents acid degradation purity plot. Fig. 8 represents base degradation chromatograph and Fig. 9 represents the base degradation purity plot. Fig. 10 represents peroxide degradation chromatograph and Fig. 11
represents the peroxide degradation purity plot.
Fig. 12 represents thermal degradation
chromato-graph and Fig. 13 represents the thermal degradation purity plot. Fig. 13 represents UV degradation chromatograph and Fig. 14 represents the UV degradation purity plot. Fig. 15 represents water degradation chromatograph and Fig. 16
represents water degradation purity plot.
Degradation studies were performed on Cabozantinib to indicate the stability property and specificity of the proposed method. Degradation study included light, heat, acid hydrolysis (2N HCl), base hydrolysis (2N NaOH) and oxidation (20% H2O2). The samples were exposed to 105 ºC for 6 h for dry heat degradation, the refluxed drug in water for 6 h at a temperature of 60 ºC for neutral degradation studies.
TABLE 7: FORCED DEGRADATION STUDY
S. no. Study RT Area USP Plate count USP Tailing
1 Acid degradation 2.935 1510221 4312 1.0
2 Base degradation 2.986 1534158 4099 1.0
3 Peroxide degradation 2.984 1566756 3926 1.0
4 Thermal degradation 2.991 1572366 3928 1.0
5 UV degradation 3.020 1594712 4198 1.0
6 Water degradation 3.029 1608728 4343 1.0
FIG. 6: ACID DEGRADATION CHROMATOGRAPH FIG. 7: ACID DEGRADATION PURITY PLOT
FIG. 10: PEROXIDE DEGRADATION CHROMATOGRAPH FIG. 11: PEROXIDE DEGRADATION PURITY PLOT
FIG. 12: THERMAL DEGRADATION CHROMATOGRAPH FIG. 13: THERMAL DEGRADATION PURITY PLOT
FIG. 14: UV DEGRADATION CHROMATOGRAPH FIG. 15: UV DEGRADATION PURITY PLOT
CONCLUSION: A simple, linear, accurate and precise HPLC method was developed and validated for the analysis of Cabozantinib in active pharmaceutical ingredient and pharmaceutical dosage form. The developed method and its validation results indicate that the method is precise and accurate. The developed method could be successfully applied for routine analysis and quality control of pharmaceutical dosage forms.
ACKNOWLEDGEMENT: The authors thank Dr.
Jagadeesh Kumar Kuna, RMC Kakinada for his encouragement and support in providing necessary support for the work. We greatly acknowledge the receipt of material and research support from Spectrum Labs, Hyderabad.
CONFLICT OF INTEREST: The authors declare
no conflicts of interest.
REFERENCES:
1. https://www.accessdata.fda.gov/drugsatfda_docs/label/201 6/203756s002lbl.pdf
2. https://www.medicines.org.uk/emc/medicine/32559 3. https://www.accessdata.fda.gov/drugsatfda_docs/label/201
6/208692s000lbl.pdf
4. https://www.medicines.org.uk/emc/medicine/32431 5. International Conference on Harmonization (ICH) of
technical requirements in the registration of pharmaceuticals for human use. Validation of Analytical procedures: definitions and terminology. ICH - Q2A,
(CPMP/ICH/381/95). Geneva: 1995. Internet:
http://www.fda.gov/cder/guidance/ichq2a.pdf.
6. International Conference on Harmonization (ICH) of technical requirements in the registration of pharmaceuticals for human use. ICH Q2B Validation of Analytical Procedures: Methodology, Geneva 1996; 1-8. 7. ICH Harmonised Tripartite Guideline: Validation of
Analytical Procedures: Text and Methodology Q2 (R1). International Conference on Harmonisation of Technical Requirements for Registration of Pharmaceuticals for Human Use, Geneva, 2005; 1-13.
8. http://www.ich.org/products/guidelines.html.
All © 2013 are reserved by International Journal of Pharmaceutical Sciences and Research. This Journal licensed under a Creative Commons Attribution-NonCommercial-ShareAlike 3.0 Unported License.
This article can be downloaded to Android OS based mobile. Scan QR Code using Code/Bar Scanner from your mobile. (Scanners are available on Google Play store)
How to cite this article: