Improved Identification of Protein Coding Region using
Wavelet Transform
Guriqbal Singh
Student of M.Tech Department of CSELLRIET, Moga
Rajbir Singh
Associate Prof. & HeadDepartment of IT LLRIET, Moga
Dheeraj Pal Kaur
Assistant Prof. (ECE)Department of ECE LLRIET, Moga
ABSTRACT
Identification of protein coding regions is an important topic in genomic examination. The various coding DNA model-independent methods are used where there is an existence of specific pattern of nucleotides. These methods presume the window length required for an examination of a DNA region. The DNA model depending coding methods catches more specific features of coding DNA. The model independent methods capture universal features of coding region. We introduce a method which is independent from the window length. Therefore objective of this paper is to improve the reorganization of protein coding region using wavelet transform with improved thresholding algorithms. This novel transform is adapt to examine periodic signal components and presents the advantage of being independent of the window length. Wavelet transform has a noisy signal, for this an improved wavelet transform threshold method has been used to improve the effects of denoising. The eukaryote data sets are used to analogize the results of proposed method with other previous methods. Finally the output obtained illustrates that the proposed method gives the better results with respect to identification accuracy. This method avoids sources of errors and makes a tool for detailed probe of the nucleotide occurrence.
General Terms
Numerical mapping, Thresholding, spectra of coding region, pattern recognition
Keywords
Protein coding regions, Digital signal processing, Wavelet transforms, Sequence analysis, Wavelet thresholding.
1.
INTRODUCTION
Deoxyribonucleic acid or DNA encodes the Genetic information of living organisms. DNA keeps information in the form of the base nucleotide sequence, which is a string of four letters namely adenine (A), thymine (T), guanine (G), and cytosine(C). Introns and exons are parts of genes. The exons, which are the protein coding regions in the genes and introns, are the protein non coding regions in the genes. The identification of protein coding regions from the DNA sequences of eukaryotic organism is one of the most important problems. In the past, numbers of new methods are discovered for finding protein coding regions. DNA Model dependent methods are requires some prior information usually available from database of previously known organism‟s genetic information. Hence the model dependent methods are more accurate. DNA Model independent methods do not presume such prior information. But some times there is a coding region that is not represented on the available databases. To identify this region the model independent
methods are adept to find the coding regions. Coding part and non coding part of protein are distinguished on the based on the feature of the codon distribution measures (McLachlan and Staden, 1982), discodon measure (Faber, 1992), period-three spectral characteristics (Anastassiou, 2001). The Exon part of DNA sequences which shows a periodic coordination of three bases but Introns part do not shows the periodic coordination of three bases. The origin and explanation of three-base periodicity is described in [1], [2]. The reasons of existence of period-3 property in DNA described in [3], [4]. The Discrete Fourier transform method was used to find the location of protein coding regions is the conventional method [5]. An improved method for prediction of coding region was submitted by the Anastassiou (2000). Vaidyanathan explains the role of signal processing for coding region identification [6]. Some new DNA sequence analysis methods have been developed which is based on the digital signal processing technique [7], [8]. Datta and Asif announce a new algorithm apply digital Fourier transform theory with a Bartlett window [9]. Accuracy of these methods is finite due prior window length is required. The window length in analysis of DNA sequences directly changes the results [10]. Thus the objective of this paper is to reduce this dependency by using the wavelet transform [11], [12]. In the past, time scale transform like wavelet transform is used, small scale is used to examine the small coding region and large scale is used to find the large coding region. Thresholding is the method which is used to detect the borderline of coding regions. In literature threshold method use the basically two methods hard threshold and soft threshold method. While these methods are used in application but they have some limitations. Hard threshold method gives the non continuous threshold points which may cause the oscillation of the rebuild signal. In soft threshold method in some case it may produce a deviation so it directly influences the accuracy of the reconstructed signal [13]. To avoid these disadvantages we present improved threshold algorithm.
2.
METHODOLOGY
text-based and easy to understand. Then next step is load the FASTA format file into the program (which is implemented in MATLAB) and build the DNA Strand. DNA consists of double helix structure. DNA is good for storage of biological information. A single strand of DNA contains sequences of nucleotide bind together in such a way that they will bind as a result of base pairing throughout their full length.
2.1
DNA Sequences to Digital Signal
A DNA sequence is build from basic four nucleotides are Adenine (A), Thymine (T), Guanine (G), and cytosine (C). Digital signal processing techniques can not be applied to symbolic signal (alphabets like A, G, T and C).so it is necessary to map the DNA into Numerical mapping or in the form of 0 and 1 before applying wavelet transform techniques. There are many methods for numerical mapping of DNA sequences. Like Fixed mapping method, Physico Chemical Property based Mapping, Statistical Property based Mapping etc. but we use the Voss representation [14]. Let a DNA sequence N, can be mapped into Digital Signal by converting the each nucleotides into binary indicator form NA, NT, NC
and NG. In each of these binary indicator sequences, 1
indicates the existence of corresponding bases and 0 represented the non-appearance of the corresponding bases A, T, G and C in N. For example, let a DNA sequence N = {…ACTGCGAGTCAT…}, the binary sequence with respect to nucleotide A is {…100000100010…}, C is {…010010000100…}, T is {…001000001001…} and for G is {…000101010000…} are shown in the fig. 1 where „n‟ is the length of the DNA sequence. Sum of all the NG, NA, NT
and NC is equal to one.
NT + NA + NC + NG = N {…111111111111…}
Fig 1: Digital form of DNA sequence.
2.2
Apply Wavelet Transform to Digital
Signal
In past, the time scale transform is used like a wavelet transform. Time scale transform is used where the multi-scale where the multi-scale approaches is required. Narrow scale is used for to calculate the thin protein coding region and wide scale is used to find the large protein coding region. The multi-scales transforms of a signal q(x) may be defined as:
( , ) ( ) ( , , )
Q r s
q x x r s dxWhere,
r is the time variable. s is the scale variable (s > 0). ψ is the analyzing function.
The analysing function for short-time Fourier transform using a Gaussian window, which is also known as Gabor transform, is defined as [15].
2
( )
( )
2
( , , )
x
r
S FT T sx
r
x r s
e
e
Where ι = √-1.
The analyzing function in wavelet transform using Morlet wavelet transform defines as [16].
2
2
( , , )
x rx r s
s
MWT
x r s
e
e
Morlet wavelet Transform also called the Gabor wavelet Transform Where,
ω0 is the frequency of ψMWT.
In this transform the complex exponential function is changes for analysing functions. Wavelet analysis is not properly compatible in this situation because it gives different frequency of the analyzing function when three base priority of coding region gives same frequency. Therefore we use the Modified Gabor transform function [17]. It is used for a particular frequency and with multiple scales defines as.
2 2
2
( , , )
x rx r s
MGWT
x r s
e
e
Therefore, MGWT of a signal q(x) will be
( , )
( )
MGWT( , , )
Q r s
q x
x r s dx
Which is a function of r and s.
Calculate the result by using this transform function to every binary sequence.
2.3
Draw the Spectrum of Binary
sequences
Next step in calculate the spectrum of each binary sequences.
Spectrum is a the band of colors, as seen in a rainbow, produced by square complex modulus of their Modified Gabor Wavelet Transform coefficients according to the TBP of the coding sequences. Combine the four binary sequences spectrum and it produces the total spectrum. Where the small TBP is present shows small spectra of light and where high
TBP is present shows more spectra of light. The representation of spectra onto the position axis helps us to find the exon position.
2.4
Thresholding of Wavelet Transform
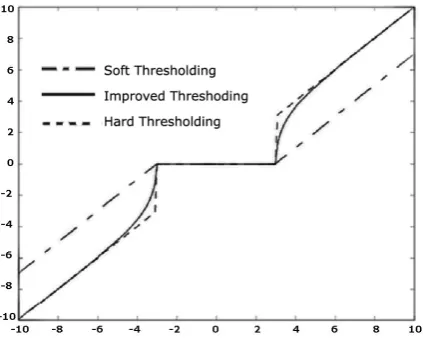
In previous literature soft thresholding and hard thresholding is used. Hard threshold function is not continuous on hard threshold point; there exist more variance in hard wavelet threshold, so it is observe that the denoised signal has noise. But the other method Soft thresholding is continuous on threshold points, but there is constant wavelet coefficient offset in soft threshold. In soft thresholding we input an irregular noisy signal then resulting signal is very smooth [13]. To overcome these limitations we introduce a new improved Threshold algorithm which is the combination of the both soft and hard threshold functions.
Hard threshold:
, ,
,
,
|
|
j k j k
j k
j k
X
X
X
X
Soft threshold:
, , ,
,
,
sgn(
)(
|
)
|
|
j k j k j k
j k
j k
X
X
X
X
X
In new method the constant wavelet coefficient offset shows the curve between soft and hard thershoding is more smooth and regular shown in the fig.2. The threshold function is expressed as follow:
, ,
2 2
, ,
,
2
2 ,| |
1 exp
|
j k j k
j k j k
j k
X X
X X
X
If
|
X
j k,|
thenX
j k,
0
If
|
X
j k,|
thenX
j k,
0
, and if,
|
X
j k|
then
X
j k, X
j k,Where
X
j k,
is the noisy signal and,
j k
X
is the denoised signal
is the threshold values. [image:3.595.64.276.405.580.2]Result of this shows that new threshold method is continuous on
points. Comparison of these functions is following.Fig 2: Comparison of Thresholding function.
2.5
Flow Chart of present work
3.
DATA SETS AND EVALUATION
MEASURES
3.1
The form of data sets
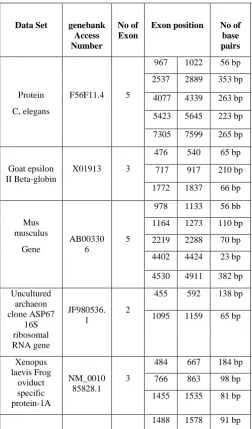
The various formats are available which provides the DNA sequences example: Plain text format, FASTA format, Genetic Computer Group Format (GCG), PHYLIP, NEXUS, NBRF and PIR. After studying the different Nucleotide & Amino Acid formats, FASTA format was selected for the present problem. The FASTA format is a simple file system than the other formats. The file format is text-based and easy to understand. For deeply understanding, a gene F56F11.4 of C, elegans of 8000 bp is used, which contains five coding region in corresponding position 967-1022, 2537-2889, 4077-4339, 5423-5645 and 7305-7599, respectively (Gene Bank access number AF099922). National Center for Biotechnology provides the Gene Bank for choose a data sets for experiment. First data set is Xenopus laevis Frog oviduct specific protein-1A of 2485 bp, which contains coding exons in position 484-667, 766-863, and 14455-1535 (Genebank access number NM_001085828.1). Second is Uncultured
Start
Collect the data from GENBANK and Retrieve the DNA sequences
Are the Sequences in
the form of Fasta Format?
Build the DNA Strands
DNA Sequence to Digital signal (Binary sequences)
Application of wavelet transformation to each Binary Sequence
Draw the spectrum of each Binary sequence
Improved Wavelet Threshold denoising
Protein coding region
archaeon clone ASP67 16S ribosomal RNA gene, partial sequence which contains coding exon position 455-592, and 1095-1159 (Genebank JF980536.1). Third is the Mus Musculus gene for PSPMB5 of 5006 bp, which contains five coding exons in positions 978-1133, 1164-1273, 2219-2288, 44002-4424 and 4530-4911. Other is Goat epsilon II Beta-globin of 2275 bp, which contains three coding exons in position 476-540, 717-917, and 1772-1837 (Gene Bank access number X01913). Other results are also shown in Table 2.
3.2
Evaluation Measures
Sensitivity (Sn) and Specificity (Sp) are the basic metrics which are commonly used to determine the accuracy of any prediction algorithms. Sensitivity is defined as the proportion of motifs that have been predicted correctly, and is given where TP (true positive) is the no. of nucleotide correctly predicted as exons. And FN (false negative) is the no of exon nucleotide predicted as introns nucleotide.
TP Sn = _______
TP+FN
Similarly specificity is defined as the proportion of the predicted motifs that are true, and FP (false positive) is the no of introns nucleotide predicted as exons nucleotide is given by
TP Sp = _______
TP+FP
Some times these parameters are not suitable for the evaluation because at high sensitivity, the specificity is low and vice versa therefore another measure known as Approximate Correlation (AC) has been defined these parameter combine sensitivity and specificity is
ACP = ¼ * (TP/ (TP+FN) + TP/ (TP+FP) + TN/ (TN+FN) + TN/ (TN+FP))
AC= (ACP-0.5) * 2
Where TN (true negative) is the no of nucleotide correctly predicted as introns.
4.
RESULTS AND DICUSSIONS
[image:4.595.318.542.83.139.2]The proposed method was compared experimentally to previously published approaches [18]: the Discrete Fourier Transform, Anti-notch filter, Asif, AMDF, average mutual information, Fourier spectrum and the Cross-correlation methods using the sequences F56F11.4. Mostly for the experiment the sequence F56F11.4 is used because it contains almost all the information of the exon and intron regions. These three methods used for comparison since they are model independent and are representative of sliding window approaches. In this work we use the first scale values is 0.2 and last scale value is 0.7. Thus, the Sn, Sp, and AC calculations were obtained under the same conditions. The present method analyzed on the F56F11.4 sequence of C. elegans and the spectrum drawn by this is shown in Fig. 3. This figure shows the total spectrum that is the sum of all spectrum values of the binary sequences. The peak of the plot where is the dark color are shown according to the TBP present in the sequence. In Table 2 it is clear that the first coding region is at the location 967-1022 has very low TBP. Any other method do not gives the best results at same scale parameter.
Fig 3: Spectrum of the Sum of all Binary Sequences.
[image:4.595.321.538.285.343.2]When we comparison Cross correlation and Wavelet Transform method then it can be observed that the Wavelet Transform method has the highest peak values. The area which shows the peaks of graph (local maxima region) are the exon part and remaining part is the introns part. Improved thresholding function gives the continuous curves and True protein coding region is drawn by solid binary curves. The first exon that was not strongly clears in case of cross correlation method but in case of wavelet transform it is clearly visible.
Fig 4: Comparison of Cross correlation and Wavelet transform using gene F56F11.4
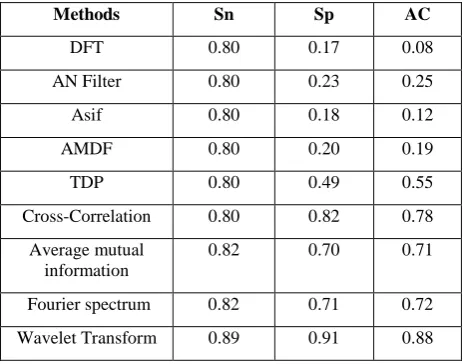
The basic metrics are used to determine the accuracy of any prediction algorithms is sensitivity (Sn), specificity (Sp), and Approximate correlation (AC). Table 1 show the comparison of previously methods with present method with threshold values of 85 percent.
Table 1.Compare Sn and Sp and AC of different methods for accuracy.
Methods Sn Sp AC
DFT 0.80 0.17 0.08
AN Filter 0.80 0.23 0.25
Asif 0.80 0.18 0.12
AMDF 0.80 0.20 0.19
TDP 0.80 0.49 0.55
Cross-Correlation 0.80 0.82 0.78 Average mutual
information
0.82 0.70 0.71
Fourier spectrum 0.82 0.71 0.72 Wavelet Transform 0.89 0.91 0.88
[image:4.595.310.542.464.646.2]Fig 5: Graph between specificity and sensitivity.
Table 2. Represents the position of the exon that is the coding region using different data sets (Randomly selected from Gene Bank) and also gives the no of base pairs calculated
Table 2. Analysis of proposed work on different data sets.
Data Set genebank Access Number
No of Exon
Exon position No of base pairs
Protein C, elegans
F56F11.4 5
967 1022 56 bp 2537 2889 353 bp
4077 4339 263 bp
5423 5645 223 bp
7305 7599 265 bp
Goat epsilon II Beta-globin
X01913 3
476 540 65 bp
717 917 210 bp
1772 1837 66 bp
Mus musculus
Gene
AB00330 6
5
978 1133 56 bb
1164 1273 110 bp 2219 2288 70 bp 4402 4424 23 bp
4530 4911 382 bp
Uncultured archaeon clone ASP67
16S ribosomal RNA gene
JF980536. 1
2
455 592 138 bp
1095 1159 65 bp
Xenopus laevis Frog
oviduct specific protein-1A
NM_0010 85828.1
3
484 667 184 bp
766 863 98 bp 1455 1535 81 bp
1488 1578 91 bp
Drosophila melanogaster
dichaete
NM_0793 42.3
4
1646 1851 206 bp 2008 2094 87 bp 2205 2251 47 bp
5.
CONCLUSIONS
The main aim of this paper is to increases the accuracy of exon region identification. The main benefit of Wavelet Transform method is to reduce the dependency of window length and produce a continuous signal at the time of thresholding of wavelet transform. The presented result shows that our method has ability to detect the short coding region. Improved thresholding method helps us to produce a continuous signal. There is a graphical representation of three base periodicity found in coding region which help us to find the boundary region. We compare performance of Wavelet Transform method with previous results, shows that the Wavelet Transform method has high Sensitivity, Specificity and Approximate correlation values.
6.
ACKNOWLEDGMENTS
I wish to express his sincere gratitude and indebtedness to his Supervisor, Prof. Rajbir Singh (Assoc. Prof. & Head, Department of Information Technology) for his valuable guidance, attention-grabbing views and obliging nature which led to the successful completion of this study. I lack words to express my cordial thanks to the members of Departmental Research Committee (DRC) for their useful comments and constructive suggestions during all the phases of the present study as well as critically going through the manuscript. Words fail the author to express his deep sense of gratitude towards his family members for their moral and financial support and encouragement without which the author would not have been able to bring out this thesis.
7.
REFERENCES
[1] A. Marin, oliver et al. “On the Origin of the Periodicity of Three in Protein Coding DNA Sequences,” J. Theoretical, vol. 167, no. 4 pp. 413-414, 1994.
[2] Lopez-Villasenor et al. “A Simple Model to Explain Three-Base Periodicity in Coding DNA,” vol. 580, no. 27, pp. 6413-6422, 2006.
[3] Trifonov E. Elucidating sequences codes: three codes for evaluation, Ann NY Acad sci. 1999, 870: 330-338. [4] Kinghom B et al. “A. periodicity of DNA in exons”. BMC
Molecular Biology 2004.
[5] S. Ramachandran et al. “Prediction of probable genes by Fourier analysis of genomic sequences,” CABIOS, vol. 13, no. 3, pp. 263-270, 1997.
[6] B. Yoon, et al. “The Role of Signal-Processing Concepts in Genomics and Proteomics,” J. Franklin Inst., vol. 341, no. 1-2, pp. 111-135, 2004.
[7] T. W. Fox and A. Carreira, “A digital signal processing method for gene prediction with improved noise suppression,” EURASIP Journal on Applied Signal Processing, vol. 2004, no. 1, pp. 108-114, 2004. [8] Y. Zhang, S.C. Agner, et al. “Signal Processing
[image:5.595.41.294.334.764.2][9] Datta S., Asif A., "A Fast DFT-Based Gene Prediction Algorithm for Identification of Protein Coding Regions," Proceedings of the 30th International Conference on Acoustics, Speech, and Signal Processing, 2005. [10]H. Yan, and M. Yang, “Pattern Recognition Techniques
for the Emerging Field of Bioinformatics: A Review,” Pattern Recognition, vol. 38, no. 11, pp. 2055-2073, 2005.
[11]C.N. Moore, and J.C. Nelson, “Preliminary Wavelet Analysis of Genomic Sequences,” Proc. IEEE Bioinformatics Conf., pp. 509-510, 2003.
[12]F. Chen and Y.-T. Zhang, “A DNA Structure-Based Bionic Wavelet Transform and Its Applications to DNA Sequence Analysis,” Applied Bionics and Biomechanics, vol. 1, no. 1, pp. 3-9, 2003.
[13]Zhao Ruizhen et al. “Three Novel Models of Threshold Estimator for Wavelet Coefficients”. 01/2001; DOI:10.1007/3-540-45333-4_19 In proceeding of: Wavelet Analysis and Its Applications, Second International Conference, WAA 2001, Hong Kong, China, December 18-20, 2001.
[14]R. F. Voss. Evolution of Long-range Fractal Correlations and 1/f noise in DNA base sequences. Physical Review Letters, 1992, 68(25):3805-3808.
[15]L.F. Costa and R.M. Cesar Jr., Shape Analysis and Classification: Theory and Practice. CRC Press, 2001. [16]Y.T. Chan, Wavelet Basics. Kluwer Academic, 1995.
[17]J.P. Carrer, H, Zana, Y, et al. “Identification of protein coding region using the modified gabor wavelet transform” IEEE/ACM transactions on commercial biology and bioinformatics 2008 vol.5 pp.198-207. [18]Omid Abbasi, et al. “identification of exonic region in
DNA sequences using cross-correlation and noise suppression by discrete wavelet transform,” BMC Bioinformatics 2011; 12:430
Singh R is an Associate Professor & Head, Department of Information Technology of Lala Lajpat Rai Institute of Engineering & Technology Moga ([email protected]), India. He received his B.E (Honor) degree in Computer Science and Engineering from MD University, Rothak, Haryana and M-Tech degree in Computer Science and Engineering from Punjab Technical University, Jalandhar Pb. (INDIA). He has authored 03 books on Computer Science. His main field of research interest is Bio-Informatics and Data mining. He works on the Gene Expression, Phylogenetic Trees and Prediction of Protein Sequence & Structure.