BOMA BESt
ENERGY AND
ENviRONMENt
REPORt
BOMA Canada is the voice of the Canadian
commercial real estate industry. A national
not-for-profit association, with strong
regional association in each major region
in Canada, BOMA Canada is comprised
of over 3,200 members, representing close
to 2.1 billion square feet of commercial
space in the country.
over
3,200
members
BOMA BESt www.bomabest.com twitter: @BOMA_BESt COntACt US BOMA Canada www.bomacanada.com
John Smiciklas, director of Energy and Environment: [email protected] Hazel Sutton, Manager of Environmental Standards: [email protected]
BOMA nEtwOrk in CAnAdA
BOMA BC (includes the yukon territory):
www.boma.bc.ca
BOMA Calgary (includes Southern Alberta from red deer to the Montana Border):
www.boma.ca
BOMA Edmonton (includes Edmonton, the area to its north, and the northwest territories):
www.bomaedmonton.org
BOMA regina (includes all of Saskatchewan):
www.bomaregina.ca
BOMA Manitoba (includes nunavut):
www.bomamanitoba.ca
BOMA toronto (includes all of Ontario except for the Kingston, Ottawa, and gatineau areas):
www.bomatoronto.org
BOMA Ottawa (includes Ottawa, gatineau, and Kingston): www.bomaottawa.org
BOMA Quebec: www.boma-quebec.org
BOMA new Brunswick and prince Edward island:
www.bomanewbrunswick.com
BOMA nova Scotia:
www.bomanovascotia.com
BOMA newfoundland and Labrador:
www.bomanl.com
Members include building owners,
managers, developers, facilities
managers, asset managers, leasing
agents and brokers, investors,
and service providers.
BOMA British Columbia BOMA Calgary BOMA Edmonton BOMA Regina BOMA Manitoba BOMA Ottawa BOMA Quebec
BOMA New Brunswick and Prince Edward Island
BOMA Nova Scotia BOMA Newfoundland and Labrador BOMA Toronto
3 intrOdUCtiOn 3 About the BBEEr 4 About BOMA BESt 5 Five Pillars of BOMA BESt 6 Continuous improvement in BOMA BESt buildings 7 MEtHOdOLOGY
8 kEY FindinGS
9 kEY rECOMMEndAtiOnS 10 SPECiAL FEAtUrE:
JOUrnEY tHrOUGH BOMA BESt – A CASE StUdY PErFOrMAnCE rEPOrt: BOMA BESt BUiLdinGS 14 data Sets
18 Office
18 Overall BOMA BESt Scores and ratings 20 Energy
30 LEAdEr in new Energy technology: royal Bank Building 33 SpECiAL FEAtUrE: Existing
Building Commissioning at Commerce Court 35 LEAdEr in Ongoing Commissioning: Le Windsor 38 water 41 LEAdEr in Water Conservation: 25 york Street 42 waste reduction
and Site Enhancement 43 LEAdEr in Waste reduction: Scotia plaza 44 LEAdEr in reducing Site
impact: Head-Smashed-in Buffalo Jump
interpretive Centre 44 Emissions and Effluents 47 SpECiAL FEAtUrE:
the importance of Occupational Health and Safety in Buildings 48 indoor Environment 49 Environmental
Management System 50 LEAdEr in tenant
Engagement: Collaboration for Energy Conservation at Bell trinity Square 52 Multi-Unit residential Building
52 Overall BOMA BESt Scores and ratings
54 Energy 57 water
58 Emissions and Effluents 58 LEAdEr in reducing
Emissions and Effluents: yaletown 939
59 indoor Environment 59 LEAdEr in indoor
Environment: Bayview @ Coal Harbour
60 Enclosed Shopping Centre 60 Overall BOMA BESt Scores
and ratings 62 Energy 63 water
64 Light industrial
64 Overall BOMA BESt Scores and ratings
66 Open Air retail
66 Overall BOMA BESt Scores and ratings
68 COnCLUSiOn
69 FiGUrES And tABLES 70 LiSt OF ACrOnYMS 71 BiBLiOGrAPHY
tABLE OF CONtENtS
iNtRODUCtiON
this report will showcase the performance of buildings in the commercial real estate industry that have achieved BOMA BESt certification in the 2012 calendar year. BOMA Canada has created this report as part of our ongoing commitment to encourage discussion surrounding improving existing building performance and reducing environmental impacts through BOMA BESt, Canada’s leading assessment and certification program. the BOMA BESt Energy and Environment report will present a detailed analysis of the state of the commercial real estate industry in terms of energy and water efficiency, waste reduction and site enhancement,
the management of emissions and effluents, indoor environment, and environmental management systems (the six key areas of environmental performance and management critically evaluated by the BOMA BESt program). in addition to this benchmarking data, the 2013 BOMA BESt Energy and Environment report will present real performance and management success stories from buildings across the country. We have also included case studies on key issues for building managers to illustrate the benefits of continuously assessing one’s performance and management practices within the context of BOMA BESt.
1 in previous years, the BOMA BESt Energy and Environment report (BBEEr) title was based on the year from which the certified building data was obtained. this year (and
going forward) the BOMA BESt Energy and Environment report will be titled according to the year of publication. the 2013 BOMA BESt Energy and Environment report will feature information on buildings certified in 2012. 2011 building data is available in the 2011 report.
Over 3,800
buildings, representing hundreds of millions of square feet of Canadian commercial real estate, have applied for certification and/or recertification to date.3,049 buildings
have achieved BOMA BESt certification and/orrecertification across Canada. ABOUt tHE BBEEr
Welcome to the fourth annual BOMA BESt
Energy and Environment Report.
1ABOUt BOMA BESt
BOMA BESt (Building Environmental Standards) is Canada’s largest environmental assessment and certification program for existing buildings. it is a unique, voluntary program designed by building owners, managers and operators in conjunction with a wide range of independent external experts to provide the commercial real estate industry with a consistent framework for assessing and improving the environmental performance and management of existing buildings of all sizes. BOMA BESt is an effective tool for monitoring and addressing building impacts on existing environmental challenges in Canada, as well as those expected from global climate change. the BOMA BESt mission is to create a sustainable environment, one building at a time. the program supports this aim by facilitating the continuous improvement of building operation and maintenance through the use of a questionnaire, or survey-based, assessment.
BOMA BESt certification recognizes excellence in energy and environmental management and performance in commercial real estate. the program is managed by the Building Owners and Managers Association of Canada (BOMA Canada) and delivered by the eleven local BOMA Associations throughout Canada. Since the program’s inception, BOMA BESt has seen tremendous uptake by the Canadian real estate industry. As at december 31, 2012: • Over 3,800 buildings, representing hundreds
of millions of square feet of Canadian commercial real estate, have applied for certification and/or recertification to date; • 3,049 buildings have achieved
BOMA BESt certification and/or recertification across Canada. in January 2012, BOMA BESt launched version 2 of the program. this new version contains new questions as well as revised standards which reflect ever-improving industry best practices and expectations.
iNtRODUCtiON
FIGURE 1: BOMA BESt CERTIFIED BUILDINGS (cumulative)
Year
Running T
otal Number of
BOMA BESt Certified Buildings
2012 2011 2010 2009 2008 2007 2006 2005 0 500 1,000 1,500 2,000 2,500 3,000 2012 2011 2010 2009 2008 2007 2006 2005
FivE PiLLARS
OF BOMA BESt
ASSESSMEnt
EdUCAtiOn
VEriFiCAtiOn
CErtiFiCAtiOn
iMPrOVEMEnt
1. ASSESSMEntthe online BOMA BESt assessment consists of 175 detailed questions. A summary performance report is generated, providing users with score distribution for each sub-section. Users are provided with energy performance data in a universally accepted metric (Energy Use intensity), allowing building owners, managers and facility operators to more effectively benchmark performance. Finally, the summary performance report will highlight achievements as well as a range of recommendations for improvement. 2. EdUCAtiOn
BOMA BESt guides managers through a building review process, providing them with a holistic approach to understanding building operations and its associated environmental impacts, as well as how these can be improved. in doing so, BOMA BESt fosters a culture of improvement within the organization.
3. VEriFiCAtiOn
information submitted by BOMA BESt applicants is verified through a third-party audit of energy and water utility data, a review of documented policies and procedures and operations manuals, as well as a walk-through of the building, including the plant room and a typical occupant space.
4. CErtiFiCAtiOn
Four levels of certification distinguish higher performing buildings based on their energy and environmental performance.
BOMA BESt Level 1: the building has met all BOMA BESt practices (includes performing an energy audit and a water audit, continually monitoring resource consumption and having a preventative maintenance program).
BOMA BESt Level 2: the building has met all BOMA BESt practices And has achieved a score of 70 – 79% on the BOMA BESt assessment. the building is moving towards better energy and environmental performance through improved management practices.
BOMA BESt Level 3: the building has met all BOMA BESt practices And has achieved a score of 80 – 89% on the BOMA BESt assessment. the building is moving towards excellence in energy and environmental performance through excellent management practices.
BOMA BESt Level 4: the highest level of certification. the building has met all BOMA BESt practices And has achieved a score of over 90% on the BOMA BESt assessment. these buildings are high performers with low energy consumption, excellent management, and often combine new technologies and industry leadership. 5. iMPrOVEMEnt
BOMA BESt certified buildings achieve better energy and water use intensities than the national average. the program helps building owners, managers and facility operators establish a building baseline performance, implement initiatives over time, and achieve an improved score upon recertification.
BOMA BESt has helped thousands of
building owners and managers realize
greater energy and water efficiencies
in their buildings, thereby improving
the sustainability of Canada’s built
environment, and the quality of life
for building occupants.
Moreover, BOMA BESt contributes to energy and environmental improvement thanks to its emphasis on continuous improvement. As the buildings certified in the early years of the program are now being recertified – many for the second time – there is a marked improvement in the overall scores,
particularly in buildings that had low initial scores (Figure 2). in 2012, 115 buildings achieved recertification. From this sample, scores decreased for 25 buildings, 21 buildings experienced no score change at all, and 69 buildings scored better upon recertification than at original certification. this improvement is particularly significant since many buildings were recertified to the new and more stringent requirements of version 2.
Approximately 30% of buildings (67 buildings) have successfully reduced their energy consumption upon recertification in 2012. For these buildings, energy use intensity was
reduced on average from 34.92 ekWh/ft2/yr
at initial certification to 31.68 ekWh/ft2/yr
after recertification – a 9% reduction in energy consumption. this indicates a clear improvement in the management and implementation of initiatives surrounding energy conservation and demand reduction. One hundred and seven buildings (50%) maintained similar consumption levels to original certifications while 20% of buildings experienced higher levels of consumption.
CONtiNUOUS iMPROvEMENt
iN BOMA BESt BUiLDiNGS
FIGURE 2: BOMA BESt SCORES – CERTIFICATION VS. RECERTIFICATION
40 50 60 70 80 90 100 Recertification Initial Certification Score (%) Number of Buildings 1 6 11 16 21 26 31 36 41 46 51 56 61 66 71 76 81 86 91 96 101 106 111
FIGURE 3: BOMA BESt EUI – CERTIFICATION VS. RECERTIFICATION
1 6 11 16 21 26 31 36 41 46 51 56 61 66 71 76 81 86 91 96 101 106 Recertifications Initial Certification ekWh/ft²/yr Number of Buildings 0 10 20 30 40 50 60 70 80 90
BBEEr 2013 dAtA SEt
MEtHODOLOGY
the 2013 BOMA BESt Energy and Environment report (BBEEr) analysis is based on a sample which includes aggregated data from 455 buildings certified to BOMA BESt Levels 2, 3, and 4. All buildings achieved certification between January 1 and december 31, 2012. Buildings certified to Level 1 are not included in this analysis since this certification level does not assess performance.
the following asset classes have been analyzed for this report:
• Office;
• Multi-Unit residential Building (MUrB); • Enclosed Shopping Centre;
• Light industrial; • Open Air retail.
this sample represents approximately 98.1 million square feet of Canadian commercial real estate.
24 45 18 31 123 97 54 5 BOMA British Columbia BOMA Regina BOMA Manitoba BOMA Ottawa
BOMA New Brunswick and Prince Edward Island
BOMA Nova Scotia BOMA Newfoundland and Labrador BOMA Toronto BOMA Quebec BOMA Edmonton 1 9 48 BOMA Calgary
• Buildings achieved an overall score in the mid- to high seventies range (Level 2), demonstrating that there is still room for performance improvement amongst Canadian existing buildings.
• Average energy use intensity for BOMA BESt certified office buildings is 30.76 ekWh/ft2/yr (or 1.19 f gJ/m2/yr)
with a median of 27.84 ekWh/ft2/yr –
a 16% improvement on the nrCan national average.
• Buildings that achieved energy reductions at recertification saw their energy use intensity drop from 34.92 ekWh/ft2/yr at
initial certification to 31.68 ekWh/ft2/yr
after recertification – a 9% reduction in energy consumption.
• Seventy-five percent (75%) of BOMA BESt certified office buildings have a better score than the BOMA BESt average of 30.76 ekWh/ft2/yr.
• Forty-six percent (46%) of BOMA BESt certified office buildings in the sample have energy use intensities between 23 and 33 ekWh/ft2/yr (or 0.89 – 1.27 gJ/m2/yr).
• Energy efficiency features are not the only indicators of good energy performance; effective management practices must also be present.
• Older, lower performing buildings are being brought up to similar performance levels than their more modern counterparts thanks to building operator and manager emphasis on building re-commissioning and major retrofits.
• BOMA BESt buildings have avoided emitting 160,240 Mt of CO2. this represents the equivalent of removing 33,383 cars from the road for one year, or the capacity of 82,090 square city blocks of pine forest to store CO2 for one year.
• Average water consumption intensity for BOMA BESt certified office buildings is 0.6 m3/m2 – a 70% improvement on the
national average of 2.03 m3/m2.
• Forty five percent (45%) of buildings divert between 30 – 59% of their waste from landfill while a smaller percentage diverts between 60 – 90%.
• Emissions and effluent scores remain high across the country which suggests that managers of BOMA BESt certified buildings have a strong commitment to implementing effective management practices for hazardous materials and products. • BOMA BESt certified buildings achieved
consistently high scores (high 90s) on the Environmental Management System section: most buildings have documented environmental policies and tenant communications strategies.
• BOMA BESt certified buildings across the country achieve consistently high scores (mid 80s) for indoor environment management and practices.
• Buildings achieved an overall score in the mid- to high seventies range (Level 2), demonstrating that there is still room for performance improvement amongst Canadian existing buildings.
KEY FiNDiNGS
Good
management
practices and energy efficient technologies are necessary for achieving high performance in buildings.BOMA BESt
buildings have avoidedemitting 160,240 Mt of CO2 –
the equivalent of removing 33,383 cars from the road for one year.
Buildings achieved a 9%
reduction
of energy
consumption
at recertification.
Metropolitan towers, vancouver, BOMA BESt Level 3 (Certified 2011)
the 2013 BOMA BESt Energy and Environment report (BBEEr) has also identified the following areas of improvement for Canada’s existing building stock:
• Energy: despite growing evidence that sub-metering is extremely helpful for identifying energy saving opportunities as well as facilitating ongoing commissioning practices, this technology is still not commonly found in buildings. Sub-meters are especially critical for building managers seeking to understand the energy performance of individual buildings within an office complex or to investigate the differences in individual tenant consumption patterns.
• Transportation: Building owners and managers still have many opportunities available to them for reducing dependency on single-occupant vehicles and their associated carbon emissions. practices that make alternative forms of transportation attractive and accessible to building occupants include installing shelter over bicycle racks, providing changing facilities for cyclists, and creating a communication strategy and plan for car-pooling. • Water: Since large buildings typically
play host to a wide range of high-impact water features such as cooling towers and more extensive food services, there are great opportunities for water savings through targeted demand reduction management practices.
• Waste: Average diversion rates have dropped compared to the 2011 certified building sample despite high scores in waste management practices. Since waste management strategies are already in place, building managers have an opportunity to increase tenant engagement in waste diversion objectives by setting high targets and increasing the availability of composting. • Site: there is an opportunity for more
buildings to engage in improving the ecological health of the building’ site, such as through site remediation with native species and removal of water-intensive landscape features.
• Emissions and Effluents: Many buildings still have equipment that contains ozone-depleting substances and global warming refrigerants although these are being phased out.
• Indoor Environment: Buildings within the sample did not have many of the following features, all linked with improved indoor environment for building occupants: personal controls over ventilation and lighting; implementing a schedule for cleaning lamps and group re-lamping. • Environmental Management System:
More buildings would benefit from undertaking tenant satisfaction surveys and developing site maps that identify the location of environmentally significant features (such as hazardous waste), enabling more effective response in the event of an emergency.
KEY RECOMMENDAtiONS
Blue Cross Centre, Moncton, BOMA BESt Level 3 (Certified 2012)
Laurier House, vancouver, BOMA BESt Level 3 (Certified 2012)
Scotia Centre, St. John’s, BOMA BESt Level 3 (Certified 2012)
the Scotia Centre (East port properties) in St. John’s, newfoundland – a frequent winner of the BOMA Earth Award and Certificate of recognition – has been committed to environmental performance since the inception of the BOMA BESt program in 2005.the building, the first non-government building in newfoundland and Labrador to achieve BOMA BESt certification, has now achieved certification three times: go green plus (2007), BOMA BESt Level 2 (2008), and BOMA BESt Level 3 (2012). Over the years, operational costs have decreased and tenant and staff engagement has increased.
Using the Scotia Centre as a case study, this feature will detail how the BOMA BESt program can help building owners and managers reach their energy and environmental objectives.
JOURNEY tHROUGH
BOMA BESt – A CASE StUDY
the Scotia Centre performance and management awards
i. tHE BOMA BESt CErtiFiCAtiOn PrOCESS CAn inFOrM YOUr EnVirOnMEntAL StrAtEGY:
When it was determined that BOMA BESt could provide the context for measuring environmental performance, the Scotia Centre management team addressed the following five questions before moving forward:
1. Scoping:
What is required by the BOMA BESt Program?
2. Benchmarking:
What is the building already doing well?
3. Low hanging fruit – management:
What programs and
policies can be immediately put into place to achieve the
best performance possible (for example, improving recycling
beyond municipal regulations)?
4. Low hanging fruit – performance:
What initiatives will have
an immediate impact on reducing operating costs? identifying
such initiatives provided the building management team with
a great place to start.
5. Capital investments:
What initiatives need to be included
in the five-year capital plan? Once the “easy wins” are
addressed, major renovations/replacements need to be
identified and included in the owner’s capital plan. these
investments, amortized over a period of time, will lead to
reduced operating costs in the long run.
“ thanks to this process we’ve identified that investing in
our equipment will not only help to increase our score
but at the end of the day will improve our operational
efficiencies and reduce our costs.”
Go Green (2007) BOMA BESt Level 2 (2008) (formerly Go Green Plus) BOMA BESt Level 3 (2012)
Energy Achieved BESt practices • First building audit;
• re-scheduled equipment start times; • reduced hot water boiler
temperature;
• installed t8s and electronic ballasts; • replaced exit lights with LEds; • installed lighting sensors in garage; • Upgraded lighting controller.
Score: 57%
• replaced chiller (30% more efficient); • implemented annual
re-lamping program.
Energy Use Intensity: 29.08 kWh/ft2/year
Score: 70%
• Energy audit update;
• installed lighting sensors in washrooms; • installed variable speed drives; • implemented daytime cleaning.
Energy Use Intensity: 27.86 kWh/ft2/year
Estimated 2012 Savings: $26,018 Water Achieved BESt practices
• installed hands free faucets; • installed low-flow toilets; • installed auto flush urinals.
Score: 47%
• detected faulty water city metre thanks to water audit;
• Continued investigation towards eliminating once-through water cooled units.
Score: 50%
• implemented use-billing for excessive water use.
• Budgeted for replacement of water meter (completed in early 2013)
Estimated water savings: 1,700,000 L Waste
Reduction & Site
Achieved BESt practices • Created tenant manual and
design criteria manual for tenants and contractors.
Score: 81%
• Management and tenant-led initiatives are featured in a new tenant informational tool kit.
Score: 76%
• Expanded recycling program to accept batteries, fluorescent lamps, and electronic waste.
Emissions and Effluents
Achieved BESt practices • installed MErv 8 HvAC filters.
Score: 89%
• Eliminated r11 in main tower by installing a new chiller; • Added spill kits and pallets
in chemically sensitive areas.
Score: 93%
• Eliminated r22 in tower two by installing new HvAC equipment.
Indoor Environ-ment
Achieved BESt practices
• required contractors and tenants to use low vOC emitting products; • implemented re-lamping and fixture
cleaning system plan.
Score: 96%
• implemented a re-lamping and fixture cleaning system plan.
Score: 97%
• reduced CO2 levels year over year by balancing HvAC requirements; • implemented a mould
management plan.
EMS Achieved BESt practices Score: 100% Score: 100%
ii. BOMA BESt rECErtiFiCAtiOn EnCOUrAGES COntinUOUS iMPrOVEMEnt
next Steps to achieve Level 4 in 2015: Sub-metering all tenants for energy consumption; replacing the pneumatic control system to ddC (digital) for more efficient control of floor temperatures; conducting a building envelope study leading to building envelope upgrades; removal of once-through water cooling units; and finally re-commissioning and optimization of all systems.
“ it is a core commitment of our organization
to constantly strive for the best possible
indoor environment within our buildings.
the achievements of Scotia Centre are great
example of these efforts.”
2. Increasing staff engagement and awareness of environmental impacts
• For a successful program, staff must also be on-board, understanding that their actions directly impact energy use and the environment. • Monthly staff meetings to review energy use allow the team to
understand the building’s energy consumption patterns, in turn providing them with the tools to manage consumption. • indoor air quality has been drastically improved thanks to the
methodology put in place for the BOMA BESt program. the team is now able to pinpoint problem areas and adjust the mechanical equipment accordingly.
3. Increasing familiarity and comfort with building operations
• Over time the Scotia Centre management team has become significantly more familiar with its own processes. this means it is easier to identify where opportunities for improvement may lie. • BOMA BESt serves as a benchmarking tool, providing the
Scotia Centre with a clear understanding of how the building is performing at a particular point in time. performance goals are now being regularly set.
• the helpful resources and recommendations provided in the BOMA BESt report assist in the decision making process for investment in improvements.
• Building managers can take ownership of the process; it has become a sustainability journey.
iii. tHE BOMA BESt PrOGrAM – A PLAtFOrM tHrOUGH wHiCH tO EnGAGE tEnAntS And StAFF
According to Kim Saunders, property Manager at the Scotia Centre, there are three key benefits to participating in the BOMA BESt program:
1. Increasing tenant engagement and awareness of environmental impacts
• the building’s success in the program is directly related to the increase in tenant awareness and participation in the program over the past 5 years. tenants now go beyond the building’s standard recycling plan and play a role in the greater community thanks to a successful re-use program for office equipment and materials. • Collecting tenant feedback is critical to keeping tenants engaged and
committed. “they are a wonderful resource and contribute many ideas to improving the building. they want to be part of the process too!”
* tenant shredding figures not available prior to May 2007
Tons
Waste Sent to Landfill Total Recycled Total Garbage Created Annually
42% 71% 73% 67% 69% 72% 0.00 50.00 100.00 200.00 250.00 *2007 2008 2009 2010 2011 2012 150.00
SCOTIA CENTRE WASTE REDUCTION
kWh’ s Annual Consumption 14,000 14,500 15,500 16,500 17,500 15,000 16,000 17,000
SCOTIA CENTRE ENERGY DEMAND REDUCTION
2007 2008 2009 2010 2011 2012 Baseline kWh
PERFORMANCE REPORt:
BOMA BESt Buildings
DAtA SEtS
Office buildings dominate this data set, comprising 80% (367) of the buildings benchmarked, the next being multi-unit residential buildings (37), enclosed shopping centres (22), light industrial (19) and finally open-air retail (10) (see Figure 4).
FIGURE 4: BOMA BESt CERTIFIED BUILDINGS, BY TYPE (2012)
Office MURB Enclosed Retail Light Industrial Open Air Retail 367, 81% 37, 8% 22, 5% 19, 4% 10, 2%
FIGURE 5: CERTIFIED BUILDINGS, BY REGION
British Columbia Alberta Saskatchewan Manitoba Ontario Quebec Atlantic Northwest Territories 24, 5% 92, 20% 19, 4% 9, 2% 151, 33% 97, 22% 60, 13% 3, 1%
this is the first year that data has been compared by Canadian climate zone2. All cities in Canada
are located in zones A, B, C, and d, and range from the warmer humid climate in southern British Columbia (zone A), to subarctic (zone d). Most major Canadian cities are located in zone B.
FiGUrE 6: CAnAdiAn CLiMAtE ZOnES
Climate Zone D Climate Zone C Climate Zone B Climate Zone A
FIGURE 7: CERTIFIED BUILDINGS, BY CLIMATE ZONE 270, 59% 24, 5% 158, 35% 3, 1% Climate Zone A Climate Zone B Climate Zone C Climate Zone D
2 nrCan. Climate Zones for ENERGY STAR qualified Windows, Doors and Skylights. 2011.
FIGURE 9: CERTIFIED OFFICE BUILDINGS, BY AGE Before 1960 1960 – 1989 1990 and Newer 224, 61% 85, 23% 58, 16% OFFiCE
three hundred and sixty seven (367) office buildings are included in the sample.
FIGURE 8: CERTIFIED OFFICE BUILDINGS, BY SIZE
Under 100,000 ft² 100,000 – 250,000 ft² 250,000 – 500,000 ft² Over 500,000 ft² 175, 48% 96, 26% 52, 14% 44, 12%
FIGURE 10: DISTRIBUTION OF CERTIFIED OFFICE BUILDINGS, BY AGE AND SIZE
Year Constructed Buidlgin Size (ft ²) 1750 1800 1850 1900 1950 2000 2050 0.00 500,000.00 1,000,000.00 1,500,000.00 2,000,000.00 2,500,000.00
FIGURE 13: CERTIFIED LIGHT INDUSTRIAL, BY SIZE Under 100,000 ft² Over 100,000 ft² 8, 42% 11, 58% FIGURE 11: CERTIFIED MURBS, BY SIZE
Under 50,000 ft² 51,000 – 100,000 ft² 100,000 – 250,000 ft² Over 250,000 ft² 6, 16% 25, 68% 3, 8% 3, 8%
FIGURE 12: CERTIFIED ENCLOSED SHOPPING CENTRES, BY SIZE
Under 250,000 ft² 250,000 – 750,000 ft² 750,000 – 1,000,000 ft² Over 1,000,000 ft² 9, 41% 3, 13% 7, 32% 3, 14%
FIGURE 14: CERTIFIED OPEN AIR RETAIL, BY SIZE
Under 250,000 ft² 250,000 – 750,000 ft² 8, 80% 2, 20%
MULti-Unit rESidEntiAL BUiLdinG thirty-seven (37) MUrBs are included in the sample.
LiGHt indUStriAL
nineteen (19) Light industrial buildings are included in the sample.
EnCLOSEd SHOPPinG CEntrE
twenty-two (22) Enclosed Shopping Centres are included in the sample.
OPEn Air rEtAiL (PLAZAS, POwEr CEntErS) ten (10) Open Air retail buildings are included in the sample.
OVErALL BOMA BESt SCOrES And rAtinGS
Offices represent the largest proportion of buildings in this sample (81%) and as such their performance will be more thoroughly reviewed then other asset types.
the average BOMA BESt score achieved by office buildings has increased slightly over the years:
• 77.8% in 2010; • 78.1% in 2011; • 78.2% in 2012.
PEFORMANCE REPORt
OFFiCE
FIGURE 15: OVERALL BOMA BESt SCORES FOR OFFICE BUILDINGS, BY REGION
Score (%) Northwest Territories Atlantic Quebec Ontario Manitoba Alberta British Columbia Saskatchewan 70.0 72.0 74.0 76.0 78.0 80.0 82.0 74.7 78.4 Average: 78.2 80.5 77.3 75.6 80.4 77.0 76.3
As one might expect, buildings in climate zone d face the greatest energy and environmental challenges with fairly extreme weather conditions. nevertheless, the score variation across regions remains small.
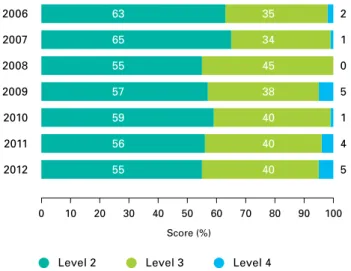
Since 2006, when performance scores were introduced, overall scores have been improving incrementally. However, Figure 17 shows that the percentage of buildings achieving BOMA BESt Level 4 certification is still relatively small. there is definitely room for improvement in energy and environmental performance and management across this asset type. Climate Zone D Climate Zone B Climate Zone A Climate Zone C 72.0 73.0 74.0 75.0 76.0 77.0 78.0 79.0 Score (%)
FIGURE 16: OVERALL BOMA BESt SCORES FOR OFFICE BUILDINGS, BY CANADIAN CLIMATE ZONE
74.7
77.9 78.5 78.3
Average: 78.2
Compared to the 2011 BBEEr, a larger proportion of public sector buildings are part of the data set this year, with participation numbers being almost equal. the public sector represents a larger number of buildings certified to Level 4 (Figure 18).
there are many factors that may help explain this difference between private and public sector performance. the primary driver may be regulation: increasingly, federal and provincial regulations have been put in place to achieve overarching environmental objectives, resulting in mandated green building certification for public buildings that fit a specific criterion3,4. Additionally, some provinces are emphasizing
the need for publically accessible energy conservation targets and plans in public sector buildings5. Altogether, these are leading to
an increase in BOMA BESt certified buildings amongst federal and provincially-owned buildings.
Although regulation mandating green building standards may be a big driver for pursuing BOMA BESt certification, departments within the government of Canada are recognizing the critical importance of developing an ongoing building management plan to ensure that targets are being met and new opportunities for cost-savings are identified. As stated in the Standing Committee on government Operations and Estimates of the 1st session of the 41st parliament on April 18, 2013,
BOMA BESt has been recognized by public Works and government Services of Canada as a reliable tool for benchmarking performance. it provides the department with a “yardstick to measure ongoing maintenance” and opportunities for retrofits and re-commissioning6.
Private Sector
Public Sector
FIGURE 18: NUMBER OF CERTIFIED OFFICE BUILDINGS, BY LEVEL AND SECTOR
0 20 40 60 80 100 120 Number of Buildings 8 79 102 10 56 86
Level 2 Level 3 Level 4
3 Environment Canada. Planning for a Sustainable Future: A Federal Sustainable Development Strategy for Canada. October 2010 (Section 8.2).
retrieved from http://www.ec.gc.ca/dd-sd/default.asp?lang=En&n=d39CB7AC-1#ftn4
4 Société immobilière du Québec. Certification BOMA BESt. retrieved from https://guideduclient.siq.gouv.qc.ca/rubrique.aspx?rubrique=72 5 Service Ontario. Ontario Regulation 397/11 (under the green Energy Act, 2009). August 2011.
retrieved from http://www.e-laws.gov.on.ca/html/source/regs/english/2011/elaws_src_regs_r11397_e.htm
6 parliament of Canada. 41st parliament, 1st Session: Standing Committee on Government Operations and Estimates. April, 2013.
retrieved from http://www.parl.gc.ca/Housepublications/publication.aspx?Language=E&Mode=1&parl=41&Ses=1&docid=6084985&File=0
2006 2007 2008 2009 2010 2011 2012 0 10 20 30 40 50 60 70 80 90 100
FIGURE 17: DISTRIBUTION OF CERTIFIED OFFICE BUILDINGS, BY LEVEL AND YEAR
63 65 55 57 59 56 55 35 34 45 38 40 40 40 2 1 0 5 1 4 5 Level 4 Level 3 Level 2 Score (%)
the energy component of the BOMA BESt assessment is a measure of a building’s energy consumption, its energy efficiency features, and the energy management practices that have been put in place. Equipment maintenance and commissioning programs are assessed to ensure there is an opportunity for building operators and managers to continuously improve the energy performance of the building. Building occupant transportation habits are also considered in the energy section. in doing so, BOMA BESt recognizes the role building management can have on encouraging travel habits that reduce environmental impacts – a daily journey totaling as little as 8 km by car can, over one year, emit as much CO2 as that emitted to provide heat, light and power for one person in an office. the transportation section addresses items such as proximity to public transport and availability of cycling facilities.
Energy is an important environmental parameter; energy use relates directly to climate change as well as to a variety of air emissions (hydrocarbons, CO2, airborne particles, as well as sulphur dioxide and nitrogen oxides which contribute to acid rain). By reducing energy consumption, managers and operators can reduce a building’s environmental impact while also reducing operating costs.
Building performance can be influenced by a number of factors:
1. Age of the building; 2. Size of the building;
3. Efficiency features of the buildings;
4. Management practices including operations, monitoring and on-going commissioning; and 5. Occupant engagement.
“ (…) we’ve looked at the two methods of certification and
it’s our view that BOMA BESt works best for our existing
inventory and LEED is best for new construction.”
– Mr. John McBain, Assistant Deputy Minister, Real Property Branch,Department of Public Works and Government Services6
By reducing
energy
consumption, managers and operators can reduce a building’s environmental impact while also reducing operating costs.Lethbridge Courthouse, Lethbridge, BOMA BESt Level 4 (Certified 2013)
6 parliament of Canada. 41st parliament, 1st Session: Standing Committee on Government Operations and Estimates. April, 2013.
a) Energy Consumption
Annual energy consumption is given for each building in equivalent kilowatt-hours per square foot per year (ekWh/ft2/yr) and is
calculated based on the utility bill information entered into the BOMA BESt assessment. Since some regions have more than one climate zone, it is not surprising that the regions show minimal variation – i.e. within a 10% range (Figure 19).
Figure 20 reveals very similar energy scores in the majority of climate zones. Only climate zone d (northwest territories) shows a notably lower score (60%). this is to be expected as climate zone d experiences the most heating degree days (Hdd) as well as extreme weather and limited daylight conditions for much of the year. rising energy costs will provide building owners and managers in all regions with a greater incentive for addressing energy conservation, especially in the northwest territories where energy costs are already elevated.
the average energy use intensity (EUi)7 of
certified office buildings in 2012 is only slightly lower than those certified between 2008 and 2011, highlighting a significant opportunity for improvement in energy conservation across Canada`s existing building stock.
7 Energy Use intensity (EUi) is a unit of measurement that describes a building’s energy use. EUi represents the energy consumed by a building relative to its size. FIGURE 19: AVERAGE ENERGY SCORE
FOR OFFICE BUILDINGS, BY REGION
Score (%) Northwest Territories Atlantic Quebec Ontario Manitoba Alberta British Columbia Saskatchewan 54.0 56.0 58.0 60.0 62.0 64.0 66.0 68.0 70.0 60.0 64.8 Average: 65.7 68.6 63.4 63.6 66.7 64.8 64.2 Climate Zone D Climate Zone B Climate Zone A Climate Zone C 56.0 58.0 60.0 62.0 64.0 66.0 68.0 Score (%)
FIGURE 20: AVERAGE ENERGY SCORE FOR OFFICE BUILDINGS, BY CLIMATE ZONE
60.0 65.5 65.3 66.4 Average: 65.7
Rising energy
costs
will provide building owners and managers in all regions with a greater incentive for addressing energy conservation 29.5 30.0 30.5 31.0 31.5 32.0 32.5 33.0 2012 2011 2010 2009 2008FIGURE 21: AVERAGE ENERGY CONSUMPTION FOR OFFICE BUILDINGS, BY YEAR
30.76 30.80 31.85 31.52 32.77 ekWh/ft²/yr
Although BOMA BESt version 2 has the ability to exclude the energy loads from data centres from the consumption total, many buildings in this sample entered the program prior to its release. the 2014 BBEEr will almost exclusively feature buildings from version 2 and should therefore yield more accurate results.
By ordering all the BOMA BESt certified offices according to their energy use intensity the following benchmarks are obtained: • 1st Quartile: 7.43 – 22.26 ekWh/ft2/yr
(0.29 – 0.86 gJ/m2/yr)
• 2nd Quartile: 22.48 – 28.05 ekWh/ft2/yr
(0.87 – 1.08 gJ/m2/yr)
• 3rd Quartile: 28.29 – 36.73 ekWh/ft2/yr
(1.09 – 1.41 gJ/m2/yr)
• 4th Quartile: 36.76 – 85.3 ekWh/ft2/yr
(1.42 – 3.3 gJ/m2/yr)
the majority of BOMA BESt buildings have a better EUi than the national average8 of 36.65 ekWh/ft2/yr (or 1.42 gJ/m2/yr), as shown in Figure 229.
8 nrCan.Commercial and Institutional Consumption of Energy Survey, Summary Report. 2005. retrieved from http://oee.nrcan.gc.ca/publications/statistics/cices06/chapter1.cfm?attr=0 9 BOMA BESt considers consistency to be critical for effective benchmarking. Since the first 2009 BBEEr, BOMA Canada has been using nrCan’s Commercial and institutional Consumption
of Energy Survey (CiCES, 2005) database for its national benchmark comparisons. Since that time, other comparative databases and benchmarks have emerged on the market with revised methodologies, including various aspects of data normalisation (e.g. rEALpac Energy Benchmarking Survey or nrCan’s Survey of Commercial and institutional Energy Use, 2009). in order to reduce confusion regarding the BOMA BESt benchmarking methodology, BOMA BESt will continue to benchmark its properties based on nrCan’s CiCES (2005). this methodology will be reconsidered once nrCan’s portfolio Manager has been released in Canada.
High performing
office buildings in the 2012 BOMA BESt sample consume between 7.43 and 22.26 ekWh/ft2/yr
Number of Buildings
FIGURE 22: EUI OF CERTIFIED OFFICE BUILDINGS VS. NATIONAL AVERAGE
0 20 40 60 80 100 120 140 160 180 200 220 240 260 280 300 320 340 ekWh/f t²/yr 0.0 10.0 20.0 30.0 40.0 50.0 60.0 70.0 80.0 90.0
Average EUI of office buildings in NRCan sample = 36.65 ekWh/ft²/yr Average EUI of BOMA BESt certified Office Buildings = 30.76 ekWh/ft²/yr
30.76 ekWh/ft²/yr
36.65 ekWh/ft²/yr
Average: 30.76
FIGURE 23: EUI DISTRIBUTION OF CERTIFIED OFFICE BUILDINGS
0 5 10 15 20 25 30 35 40 ekWh/ft²/yr Number of Buildings 1 3 5 7 9 11 13 15 17 19 21 23 25 27 29 31 33 35 37 39 41 43 45 47 49 51 53 55 57 59 61 63 65 67 69 71 73 75 Median: 27.84
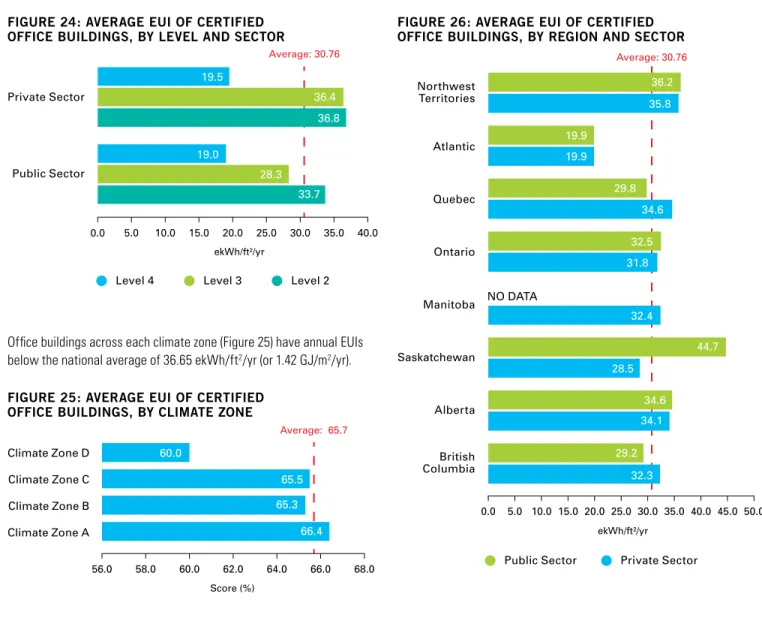
the BOMA BESt certification Levels provide a meaningful representation of annual energy use intensity.
there is a clear correlation between energy consumption and BOMA BESt Certification Level.
Private Sector
Public Sector
FIGURE 24: AVERAGE EUI OF CERTIFIED OFFICE BUILDINGS, BY LEVEL AND SECTOR
Level 4 Level 3 Level 2
ekWh/ft²/yr 0.0 5.0 10.0 15.0 20.0 25.0 30.0 35.0 40.0 Average: 30.76 19.5 36.4 36.8 19.0 28.3 33.7
Office buildings across each climate zone (Figure 25) have annual EUis below the national average of 36.65 ekWh/ft2/yr (or 1.42 gJ/m2/yr).
Climate Zone D Climate Zone B Climate Zone A Climate Zone C 56.0 58.0 60.0 62.0 64.0 66.0 68.0 Score (%)
FIGURE 25: AVERAGE EUI OF CERTIFIED OFFICE BUILDINGS, BY CLIMATE ZONE
60.0
65.5 65.3
66.4
Average: 65.7
When observed at a more granular level, however (Figure 26), it is possible to see that EUis vary significantly across each region. Fuel and electricity intensities show the expected regional variations.
0.0 5.0 10.0 15.0 20.0 25.0 30.0 35.0 40.0 45.0 50.0
FIGURE 26: AVERAGE EUI OF CERTIFIED OFFICE BUILDINGS, BY REGION AND SECTOR
ekWh/ft²/yr Northwest Territories Atlantic Quebec Ontario Manitoba Alberta British Columbia Saskatchewan NO DATA
Public Sector Private Sector
36.2 35.8 19.9 19.9 Average: 30.76 29.8 34.6 32.5 31.8 32.4 28.5 44.7 34.6 34.1 32.3 29.2
nAtUrAL GAS
As Figure 27 demonstrates, the highest level of fuel use is found in climate zone C, which is due to the number of heating degree days (Hdd). ranges for Hdd per zone are as follows:
• Zone A: ≤ 3500 Heating degree days (Hdds)
• Zone B: > 3500 to ≤ 5500 Heating degree days (Hdds) • Zone C: > 5500 to ≤ 8000 Heating degree days (Hdds) • Zone d: > 8000 Heating degree days (Hdds)
As expected, data from buildings in climate zones A, B and C
demonstrate that as climate zones increase so does fuel consumption10.
10 no data for fuel consumption was available for buildings in climate zone d or the northwest territories region. in the nWt, there are 3 main energy sources used to generate electricity:
natural gas, diesel fuel and hydro resources. Heating oil is the most common because of its reliability and, until recently, its price.
Climate Zone D Climate Zone B Climate Zone A Climate Zone C 0.0 500.0 1,000.0 1,500.0 2,000.0 2,500.0 3,000.0 m³/1,000 ft²/yr
FIGURE 27: AVERAGE NATURAL GAS USE OF CERTIFIED OFFICE BUILDINGS, BY CLIMATE ZONE
NO DATA 2,542.5 1,141.1 751.5 Average: 940.41 0.0 200.0 400.0 600.0 800.0 1,000.0 1,200.0 1,400.0 1,600.0 1,800.0
FIGURE 28: AVERAGE NATURAL GAS USE OF CERTIFIED OFFICE BUILDINGS, BY REGION AND SECTOR
m³/1000 ft²/yr Northwest Territories Atlantic Quebec Ontario Manitoba Alberta British Columbia Saskatchewan NO DATA NO DATA NO DATA 1,285.8 615.8 1,050.2 1,292.4 795.6 1,063.5 1,358.8 650.7 1,557.8 1,665.6 398.3 423.6 67.2 Public Sector Private Sector Average: 940.41
ELECtriCitY
Figures 29 and 30 show – to some extent – the expected regional variations. Buildings in climate zone A are expected to use the most electricity since they experience the highest amount of cooling degree days (Cdd) while buildings in climate zone d should consume the least since they have the lowest amount of Cdds.
However, electricity in British Columbia, Manitoba and Quebec is predominantly generated through hydroelectricity which is less expensive than other forms of electricity production. Many of the buildings in climate zone B are located in Quebec, a region with the second highest energy use intensity in the sample. Unfortunately, low energy prices do not encourage conservation. Many buildings in climate zone C are also found in Quebec, as well as across central Canada.
Climate Zone D Climate Zone B Climate Zone A Climate Zone C 0.0 5.0 10.0 15.0 20.0 25.0 kWh/ft²/yr
FIGURE 30: AVERAGE ELECTRICITY USE OF CERTIFIED OFFICE BUILDINGS, BY CLIMATE ZONE
18.3 14.9 22.7 19.4 Average: 18.44 0.0 5.0 10.0 15.0 20.0 25.0 30.0
FIGURE 29: AVERAGE ELECTRICITY USE OF CERTIFIED OFFICE BUILDINGS, BY REGION AND SECTOR
kWh/ft²/yr Northwest Territories Atlantic Quebec Ontario Manitoba Alberta British Columbia Saskatchewan NO DATA 14.97 10.0 16.89 11.03 26.72 21.0 22.98 18.4 18.38 27.1 13.25 17.86 16.7 21.6 19.68 Public Sector Private Sector Average: 18.44
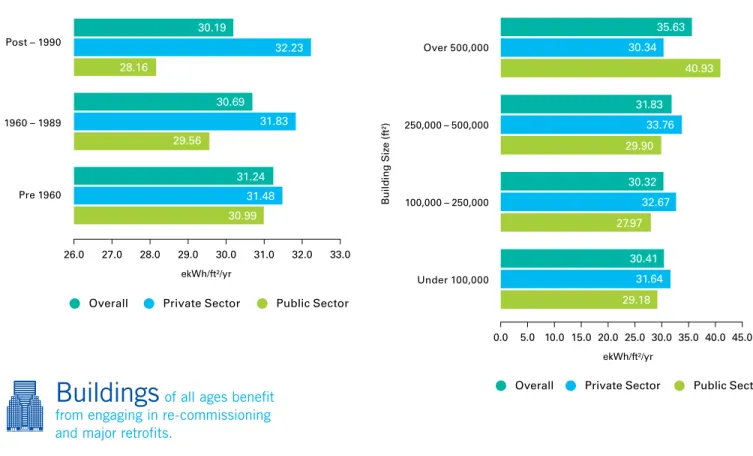
the following correlations are revealed between energy use intensity and building age in Figure 31:
• Overall, newer buildings have better energy performances than older buildings; improved design principles could be one potential explanation for this;
• the private sector, however, is showing slightly better energy performance in its older buildings;
• the opposite trend is true for buildings from the public sector where newer buildings show lower energy use intensity levels; • For buildings certified in 2011, both trends
were reversed – with private sector “new” buildings and public sector “old” buildings having the best performance11.
Buildings built prior to 1960 have the lowest levels of energy consumption; although their building envelopes and mechanical systems may be underperforming, their lower associated plug loads, as compared to new buildings, may contribute to this result. results may also be indicative of a widespread desire (public sector in 2011, private sector in 2012) to address the performance of older buildings by engaging in re-commissioning and major retrofits. this is a good trend for the Canadian building stock as older buildings are being brought up to the performance levels of their more modern counterparts.
A relationship between building size and energy use intensity is visible in Figure 32. Lower (better) energy intensities are consistently found in buildings under 100,000 ft2. Since
small and mid-sized buildings have less complex mechanical systems, they may benefit significantly from simple energy efficiency upgrades, such as a lighting retrofit.
On the other hand, medium-to-large buildings, with more complex systems, require a wider range of integrated, and sometimes capital- intensive, solutions to achieve the same levels of reduction. very large buildings that have successfully targeted energy conservation objectives do so through a combination of sophisticated energy efficiency retrofits, integrated management systems, and investments in highly trained and qualified operational staff.
11 BOMA Canada. BOMA BESt Energy and Environmental Report (p.60). 2011. retrieved from http://www.bomabest.com/wp-content/uploads/BBEEr-2011-FinAL.pdf
Pre 1960 1960 – 1989 Post – 1990
FIGURE 31: AVERAGE EUI OF CERTIFIED OFFICE BUILDINGS, BY AGE AND SECTOR
26.0 27.0 28.0 29.0 30.0 31.0 32.0 33.0
Overall Private Sector Public Sector
ekWh/ft²/yr 30.19 32.23 28.16 30.69 31.83 29.56 31.24 31.48 30.99 Over 500,000 250,000 – 500,000 100,000 – 250,000 Under 100,000
FIGURE 32: AVERAGE EUI OF CERTIFIED OFFICE BUILDINGS, BY SIZE AND SECTOR
0.0 5.0 10.0 15.0 20.0 25.0 30.0 35.0 40.0 45.0 ekWh/ft²/yr Building Siz e (f t²) 35.63 30.34 40.93 31.83 33.76 29.90 30.32 32.67 27.97 30.41 31.64 29.18
Overall Private Sector Public Sector
Buildings
of all ages benefitfrom engaging in re-commissioning and major retrofits.
12 von neida, B. & Hicks, t. (U.S. Environmental protection Agency). Building Performance Defined: the EnergyStar National Energy Performance Rating System (p.11).
retrieved from http://www.energystar.gov/ia/business/tools_resources/aesp.pdf
b. Energy Efficiency Features Although it might be expected that there would be a positive correlation between the presence of energy efficiency features (EEF) and energy performance, this sample reveals that this is not necessarily the case (Figure 33). indeed, such a finding supports an EpA study which challenged the “misconception that building efficiency can be defined by the presence of efficient equipment”12. While
energy-efficient equipment can significantly contribute to improved building performance,
this is a double-edged sword; energy efficient equipment that is not being properly operated or commissioned can be a primary source of energy inefficiency.
When separating the buildings into groups based on age and size, there is a visible relationship between energy use intensity and building characteristics.
in Figures 34, 35 and 36, it is clear that implementing efficient energy features makes a difference in newer buildings but less so in buildings constructed before 1960.
very large
buildings that have successfully targeted energy conservation objectives do so through a combination of sophisticated energy efficiency retrofits, integrated management systems, and investments in highly trained and qualified operational staff. FIGURE 35: EEF SCORE AND EUI OF CERTIFIEDOFFICE BUILDINGS (1960 and 1989)
Energy Efficient Features Score (%)
ekWh/f t²/yr 0 20 40 60 80 100 0 20 40 60 80 100
FIGURE 33: EEF SCORE AND EUI OF CERTIFIED OFFICE BUILDINGS
Energy Efficient Features Score (%)
ekWh/ft²/yr 0 20 40 60 80 100 0 20 40 60 80 100
FIGURE 36: EEF SCORE AND EUI OF CERTIFIED OFFICE BUILDINGS (1990 to present)
Energy Efficient Features Score (%)
ekWh/f t²/yr 0 20 40 60 80 100 0 20 40 60 80 100
FIGURE 34: EEF SCORE AND EUI OF CERTIFIED OFFICE BUILDINGS (before 1960)
Energy Efficient Features Score (%)
ekWh/f t²/yr 0 20 40 60 80 100 0 20 40 60 80 100
Mid-size buildings (100,000 – 500,000 ft2) are better correlated to lower
EUi and Energy Efficient Features score than smaller or larger buildings (Figures 37, 38, 39 and 40).
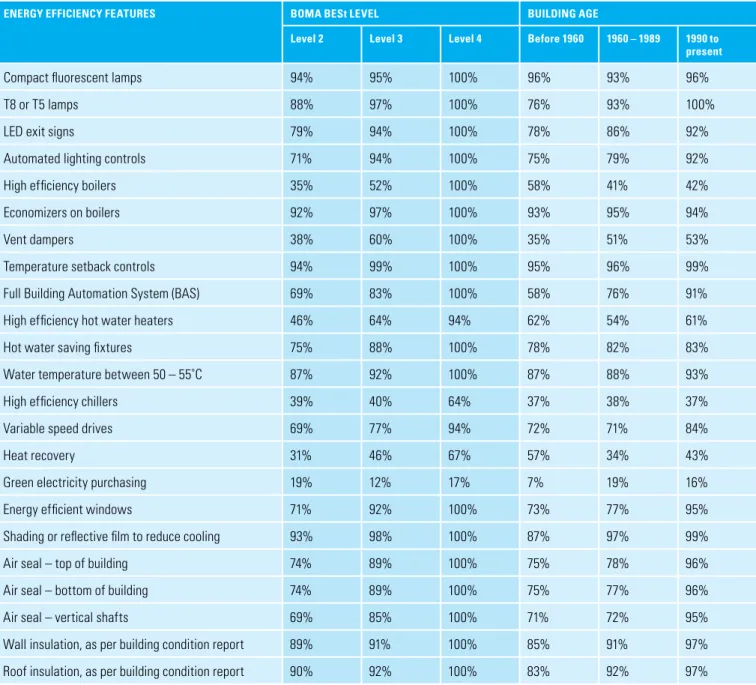
Several energy efficiency features are being implemented by the majority of buildings in the sample (table 1). these include lighting retrofits, temperature setback control, shading, and insulation. As expected, buildings with a higher certification level typically have the most energy efficiency features. in the majority of cases, newer buildings also have more energy efficiency features installed throughout the building.
While energy-efficient
equipment can significantly contribute to improved building performance, this is a double-edged sword; energy efficient equipment that is not being properly operated or commissioned can be a primary source of energy inefficiency.FIGURE 37: EEF SCORE AND EUI OF CERTIFIED OFFICE BUILDINGS (under 100,000 ft²)
Energy Efficient Features Score (%)
ekWh/ft²/yr 0 20 40 60 80 100 0 20 40 60 80 100
FIGURE 39: EEF SCORE AND EUI OF CERTIFIED OFFICE BUILDINGS (250,000 ft² – 500,000 ft²)
Energy Efficient Features Score (%)
ekWh/ft²/yr 0 20 40 60 80 100 0 20 40 60 80 100
FIGURE 38: EEF SCORE AND EUI OF CERTIFIED OFFICE BUILDINGS (100,000 ft² – 250,000 ft²)
Energy Efficient Features Score (%)
ekWh/ft²/yr 0 20 40 60 80 100 0 20 40 60 80 100
FIGURE 40: EEF SCORE AND EUI OF CERTIFIED OFFICE BUILDINGS (above 500,000 ft²)
Energy Efficient Features Score (%)
ekWh/ft²/yr 0 20 40 60 80 100 0 20 40 60 80 100
table 1: EEF of Certified Office Buildings, by Level and Building Age
ENERGY EFFICIENCY FEATURES BOMA BESt LEVEL BUILDING AGE
Level 2 Level 3 Level 4 Before 1960 1960 – 1989 1990 to present
Compact fluorescent lamps 94% 95% 100% 96% 93% 96%
t8 or t5 lamps 88% 97% 100% 76% 93% 100%
LEd exit signs 79% 94% 100% 78% 86% 92%
Automated lighting controls 71% 94% 100% 75% 79% 92%
High efficiency boilers 35% 52% 100% 58% 41% 42%
Economizers on boilers 92% 97% 100% 93% 95% 94%
vent dampers 38% 60% 100% 35% 51% 53%
temperature setback controls 94% 99% 100% 95% 96% 99%
Full Building Automation System (BAS) 69% 83% 100% 58% 76% 91%
High efficiency hot water heaters 46% 64% 94% 62% 54% 61%
Hot water saving fixtures 75% 88% 100% 78% 82% 83%
Water temperature between 50 – 55˚C 87% 92% 100% 87% 88% 93%
High efficiency chillers 39% 40% 64% 37% 38% 37%
variable speed drives 69% 77% 94% 72% 71% 84%
Heat recovery 31% 46% 67% 57% 34% 43%
green electricity purchasing 19% 12% 17% 7% 19% 16%
Energy efficient windows 71% 92% 100% 73% 77% 95%
Shading or reflective film to reduce cooling 93% 98% 100% 87% 97% 99%
Air seal – top of building 74% 89% 100% 75% 78% 96%
Air seal – bottom of building 74% 89% 100% 75% 77% 96%
Air seal – vertical shafts 69% 85% 100% 71% 72% 95%
Wall insulation, as per building condition report 89% 91% 100% 85% 91% 97%
Achieved BOMA BESt Level 2 Energy Score: 69
in October 2011, royal Bank Building, owned by Melcor developments Ltd., became the first commercial property in downtown Edmonton to provide building electricity and heat utilizing Combined Heat and power (CHp), or Cogeneration technology.
CHp technology converts natural gas into both electricity and heat in a single process at the point of use. the natural gas fired reciprocating prime mover acts as the primary boiler for the building with supplemental heat from the central boiler plant. Waste heat is recovered from the generator and the prime mover’s water jacket and returned to the heating water, reducing the hours of operation for the central boilers. At the same time the building is absorbing waste heat, it is also generating electricity, which reduces the demand placed on the grid.
Cogeneration is highly energy efficient (80%)13 and as well as providing
a building with heat and power, it can deliver a number of environmental benefits. One of these benefits is reducing the fresh water consumed at a water cooled coal fired power generation station. this process can take about 95 Litres of fresh water to produce a kilowatt of electricity. CHp at the royal Bank Building produces approximately 145 kWh. Since October 2011, when the unit was commissioned, it has produced at total of 1,662,000 kWh. this means that approximately 155,000,000 Litres of fresh water have not been withdrawn from the environment. in addition, by using natural gas as fuel, this process reduces the amount of carbon dioxide and sulfur being released into the atmosphere13.
producing electricity and recovering waste heat from natural gas powered Combined Heat and power technology saves money while reducing overall environmental impacts.
13 Melcor developments Ltd & power Ecosystems 2008. retrieved from http://www.bomabest.com/wp-content/uploads/BBEEr-2013-royal-Bank-Benefits-of-Cogen.pdf royal Bank Building, Edmonton,
BOMA BESt Level 2 (Certified 2012)
Combined Heat and power plant at royal Bank Building, Edmonton
ROYAL BANK
BUiLDiNG, EDMONtON
LEADER iN NEW ENERGY
tECHNOLOGY:
c. Energy Management
Energy Management BESt practices include having an energy policy in place, regular energy audits, energy monitoring, staff training, as well as on-going preventive maintenance. When looking at overall scores Energy Management scores are not significantly correlated with good energy performance (Figure 41).
However, as with the energy efficiency features, when looking at management and energy performance on a more granular scale, trends become visible – particularly when buildings are grouped by size. regardless of age, there are always some buildings with very high levels of energy consumption despite a very good Energy Management score (Figure 42). there is a relationship between Energy Management scores and EUi for buildings built between 1960 and 1989.
FIGURE 41: ENERGY MANAGEMENT SCORE AND EUI OF CERTIFIED OFFICE BUILDINGS
Energy Management Score (%)
ekWh/ft²/yr 40 50 60 70 80 90 100 0 20 40 60 80 100
FIGURE 43: ENERGY MANAGEMENT SCORE AND EUI OF CERTIFIED OFFICE BUILDINGS (1960 and 1989)
Energy Management Score (%)
ekWh/ft²/yr 40 50 60 70 80 90 100 0 20 40 60 80 100
FIGURE 42: ENERGY MANAGEMENT SCORE AND EUI OF CERTIFIED OFFICE BUILDINGS (before 1960)
Energy Management Score (%)
ekWh/ft²/yr 40 50 60 70 80 90 100 0 20 40 60 80 100
FIGURE 44: ENERGY MANAGEMENT SCORE AND EUI OF CERTIFIED OFFICE BUILDINGS (1990 to present)
Energy Management Score (%)
ekWh/ft²/yr 40 50 60 70 80 90 100 0 20 40 60 80 100
When examining the relationship between the EUi and Energy Management Scores by size there is a correlation between better energy performance and higher management scores, particularly for mid-size buildings (100,000-500,000 ft2) (Figures 46, 47, 48 and 49).
taken as a whole, this suggests that no single variable can be taken in isolation to account for good energy performance. rather both sound management practices and regular maintenance and commissioning of energy efficient features are needed.
No single variable
can be taken in isolation to account for good energy performance. Rather both sound management practices and regular maintenance and commissioning of energy efficient features are needed.the greatest
contributors to a high score are: demand response management measures, and evidence of energy training.
FIGURE 45: ENERGY MANAGEMENT SCORE AND EUI OF CERTIFIED OFFICE BUILDINGS (under 100,000 ft²)
Energy Management Score (%)
ekWh/ft²/yr 40 50 60 70 80 90 100 0 20 40 60 80 100
FIGURE 47: ENERGY MANAGEMENT SCORE AND EUI OF CERTIFIED OFFICE BUILDINGS (250,000 ft² – 500,000 ft²)
Energy Management Score (%)
ekWh/ft²/yr 40 50 60 70 80 90 100 0 20 40 60 80 100
FIGURE 46: ENERGY MANAGEMENT SCORE AND EUI OF CERTIFIED OFFICE BUILDINGS (100,000 ft² – 250,000 ft²)
Energy Management Score (%)
ekWh/ft²/yr 40 50 60 70 80 90 100 0 20 40 60 80 100
FIGURE 48: ENERGY MANAGEMENT SCORE AND EUI OF CERTIFIED OFFICE BUILDINGS (above 500,000 ft²)
Energy Management Score (%)
ekWh/ft²/yr 40 50 60 70 80 90 100 0 20 40 60 80 100
As part of Commerce Court’s on-going commitment to sustainability, the gWL realty Advisors property Management team, on behalf of the owners, bciMC realty Corporation, implemented an Energy Master plan (EMp) in 2007 to structure utility management activities. the EMp was based on Energy@Work inc.’s award-winning framework.
Over the next four years, the property Management team assembled the tools and knowledge to aggressively pursue tenant comfort improvements, better building performance and utility conservation, to keep the complex ahead of the curve in the face of newer office towers being built in toronto’s Financial district.
these tools included a utility tracking system, real-time monitoring on each major utility meter, and a calibrated building energy simulation model.
in-depth knowledge was also gathered though 5 ASHrAE level 2 audits, the simulation model calibration process, and monthly discussions with the technical team.
By the end of 2011, the pieces were in place to implement one of the largest Existing Building Commissioning (EB Cx) projects ever undertaken in Canada.
EB Cx is a systematic approach aimed at optimizing building operation, and is a proven means—when done properly—of Commerce Court is a timeless, 3 million square foot commercial office and retail complex located in the heart of toronto’s Financial district.
14 planyC: greening Buildings & Energy Efficiency. About Local Law 87. 2013. retrieved from http://www.nyc.gov/html/gbee/html/plan/ll87_about.shtml
ExiStiNG BUiLDiNG
COMMiSSiONiNG
At COMMERCE COURt
SPECiAL FEAtURE
significantly improving tenant comfort, as well as building and utility performance while ensuring occupant safety. in fact, based on its consistent success, new york City recently mandated14 that all existing commercial
buildings over 50,000 ft2 be commissioned
every 10 years.
Energy@Work was engaged to assemble an EB Cx team—which included engineers specializing in commissioning, representatives from the management and operations teams, relevant contractors, and utility representatives—and to guide the project through the four phases of the EB Cx process. PHASE 1 – PLAnninG:
this phase is the least intensive, but is essential to the success of the rest of the project. in this phase, the objectives, scope, and EB Cx team roles and responsibilities are defined, necessary background information is gathered, and the plan for the rest of the project is specified.
PHASE 2 – inVEStiGAtiOn:
this is the most intensive phase. in this phase, monitoring plans are put into place (over 250 control points were tracked on 15-minute intervals producing hundreds of thousands of individual points of data), pre-functional checklists on building systems were completed, and functional tests were performed. the object of this phase is to achieve a holistic knowledge of building systems and operations, and generate a “Master List of Findings” from which measures can be derived. At Commerce Court, over 100 findings were identified during this phase.
PHASE 3 – iMPLEMEntAtiOn: in the implementation phase, measures identified and selected through the investigation are implemented. From the identified findings at Commerce Court, the EB Cx team decided to pursue 64 measures for implementation, including:
• Multiple control sequence changes; • Sensor calibration and/or replacement; • pumping system optimization; • Optimizing outdoor air control
and building pressurization. PHASE 4 – trAnSFEr And PErSiStEnCE:
the final phase ensures that obtained savings can be maintained and that operations are equipped with the right tools moving forward. in this case, these tools included sensor calibration forms and procedures, data labeling, real time Monitoring (rtM), a new operator manual, the building model, and a BAS monitoring plan for critical sensors.
rESULtS:
Since the EMp was implemented in 2007, Commerce Court has avoided over $5 million in utility costs through conservation and there were an additional $1 million in utility incentives that helped to reduce project costs. the EB Cx project is credited with an overall one-year energy savings in 2012 of 7% resulting in a simple payback period of less than 1 year. Further savings are expected in 2013 as more EB Cx measures and implemented.
COnCLUSiOn:
Commerce Court’s results have been outstanding, especially considering the property’s size and complexity, but they aren’t surprising. Existing Building Commissioning produced results at Commerce Court because it was done correctly—enthusiastically supported at all levels, properly funded, and structured based on expert experience. Commerce Court’s success is replicable at almost any property willing to put in a similar level of commitment.
ELECTRICITY DEMAND HOURLY PROFILE COMPARISON – TWO WEEK DAYS (kW)
kW
7 8 9 10 11 12 13 14 15 16 17 18 19 20 21 22 23 24 0 1 2 3 4 5 6
Real Time Data: 10:00 AM (Five minute intervals to match Hourly Ontario Energy Price – or HOEP) Peak demand (kW) reduced
Base load (kW) reduced Early equipment start-up eliminated 0 1,000 2,000 3,000 4,000 5,000 6,000 7,000 8,000 9,000 10,000 Hour 19-Jan-12 14-Jun-13
Commerce Court’s typical daily electricity demand in 2013 (blue line) compared to a typical weekday in early 2012 (red line). notice that the baseload in early morning is reduced, equipment start-ups delayed, and peak demand reduced. real-time data comes directly from the main toronto Hydro electric meter at five-minute intervals.
Buildings across all BOMA BESt Levels as well as across building age score well for energy management practices (table 2). the greatest contributors to a high score are: demand response management measures, and evidence of energy training.
despite growing evidence that sub-metering is extremely helpful for identifying energy saving opportunities as well as facilitating ongoing commissioning practices, this technology is still not commonly found in buildings. Sub-meters are especially critical for building managers seeking to understand the energy performance of individual buildings within an office complex.
ENERGY MANAGEMENT BOMA BESt LEVEL BUILDING AGE
Level 2 Level 3 Level 4 Before 1960 1960 – 1989 1990 to present
Energy policy 98% 99% 100% 98% 98% 99%
Energy audit 100% 100% 100% 100% 100% 100%
Energy monitoring 99% 100% 100% 100% 99% 100%
Flattening load profile 79% 94% 94% 78% 87% 88%
Energy training and updates 83% 93% 100% 80% 91% 86%
Energy improvement budget 99% 100% 100% 99% 100% 100%
tenant sub-metering 43% 61% 75% 57% 46% 64%
User-friendly operating manual for all services 94% 97% 100% 93% 97% 93%
preventative maintenance schedule 100% 100% 100% 100% 100% 100%
table 2: Energy Management Measures of Certified Office Buildings, by Level and Building Age
Le Windsor, Montreal, BOMA BESt Level 4 (Certified 2012)
Achieved BOMA BESt Level 4 Energy Score: 82
Energy is a priority for Le Windsor. Building management is working closely with occupants and the operational and maintenance team to successfully implement an energy and environment performance contract. Le Windsor is operated in an integrated way; building systems and procedures are reviewed and optimized every day, ensuring occupant well-being. Ongoing commissioning is performed by an energy analyst committed
to reducing energy consumption and CO2 emissions. While improvements in performance can typically be achieved through the implementation of no-to-low cost projects, occasionally larger investments are required for achieving targets. When this occurs, a team composed of building management and operations staff will meet to thoroughly review all options.
Altogether, these practices enable the building to reduce its energy consumption by at least 2% each year.