Robust Direction of Arrival Estimation using Multiple
Signal Analysis
Raja Sekhar Yeduri
PG Student
GVP College of Engineering (A)
Visakhapatnam
G.Radha Kumari
Assistant Professor GVP College of Engineering
(A) Visakhapatnam
Ch.Kusma Kumari,
Ph.D Assistant Professor GVP College of Engineering (A)Visakhapatnam
ABSTRACT
Direction of arrival (DOA) estimation is one of the focal problems in the fields of Wireless communications, Radar, Sonar, Radio Astronomy and Seismology. The main objective of the DOA estimation is to obtain the desired signals direction as well as the interference signals direction based on the data received from the array sensor at the base station. In literature various techniques are researched for DOA estimation. Among which are two high resolution algorithms, viz. MUSIC (MUltiple SIgnal Classification) and ESPRIT (Estimation of Signal Parameters via Rotational Invariance Technique, MUSIC algorithm is implemented in this paper with Empirical Mode Decomposition technique. The key feature of EMD is to decompose a signal into sum of intrinsic mode functions (IMF) with a final residue of non linear and non stationary signals. The work presented in this paper deals with EMD application to the problem of DOA estimation as a preprocessing technique. This technique separately de-noises the rows of the array data matrix where each row corresponds to the output of a particular sensor array. Especially in low-SNR conditions, the estimation performance of MUSIC algorithm is enhanced significantly when de-noising is given to array data matrix prior to DOA estimation stage.
Keywords
Direction Of Arrival (DOA), MUltiple SIgnal Classification (MUSIC), Empirical Mode Decomposition (EMD), Intrinsic Mode Function (IMF).
1.
INTRODUCTION
Antenna array design has received much attention in the last few decades. It is one of the areas of research in the wide-ranging field of signal processing, and focuses on the problem of estimating signal parameters from the data received at the antenna array. In general, the parameters are the signal contents, the angles of arrival and the power. Spectral estimation techniques have the capability to select desired frequency components out of a composite signal in the presence of noise and interference [1]. DOA estimation plays an important role in array signal processing, because both the base station and mobile station can use manifold antenna elements enhancing the capacity and throughput of the system significantly.
In recent years, the detection of a signal from a particular direction has received noteworthy significance in the applications like defence, wireless mobile communications, radar, sonar and tracking targets [2]. In commercial applications, the significance of DOA estimation is essential to spot the direction of an emergency telephone call in order to dispatch a rescue squad to the right location. In mobile communications, the major intent of DOA estimation is to estimate the direction of the desired user’s signals and also the
directions of interferer’s signals based on the received data at the sensor array base-station. In defence applications, the role of DOA estimation is to recognize the direction of possible threats. Different DOA estimation algorithms are Bartlett, Capon, Min-norm, MUSIC, and ESPRIT. However MUSIC and ESPRIT algorithms can be considered to be the high resolution and exact methods that are commonly used in the smart antenna design [3] but MUSIC algorithm received enough attraction because of its accuracy and robustness. It is well-known that in real data analysis the signals do not exist without noise, considered negligible for high SNR. Yet, there are conditions in which the noise significantly corrupts the signal, and it must be removed in order to proceed with further data analysis. The procedure for noise removal is referred to as signal de-noising or simply de-noising. There is a large range of applications in which de-noising is important. Some of them are medical signal analysis, data mining, and radio astronomy. EMD can be treated as a de-noising technique which decomposes a signal into sum of intrinsic mode functions (IMF) [4].
This paper is structured as follows. Section 2 describes the receiving signal model. Section 3 presents DOA estimation using MUSIC algorithm. Empirical Mode Decomposition (EMD) as a de-noising technique is explained in section 4. The proposed method is explained in section 5. Simulation results and discussions on MUSIC and EMD-MUSIC algorithms are given in section 6. Finally the conclusion is given in section7.
2. SIGNAL MODEL
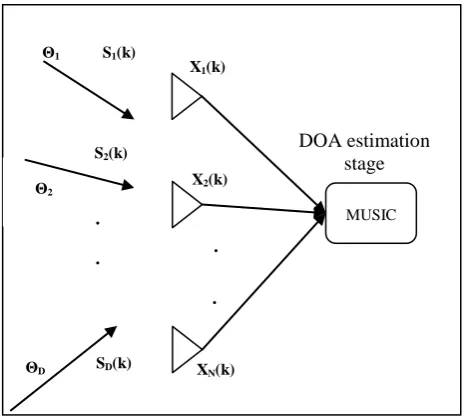
The signal model shown in Fig.1 describesDsignals are arriving from Ddifferent directions and they are received by Narray elements. Each received signal includes zero mean Gaussian noise. Time is represented by the th
k sample, thus the array output is given by
) ( ) (
) (
) ( )] ( ).... ( ), ( [ )
( 2
1
2
1 n k
k S
k S
k S a
a a k X
D
D
) ( ) ( * )
(k A S k n k
X ...………..…. (1)
) (k
S = incident complex signals vector at timek. )
(k
18 Fig 1: Receive array with incident plane waves from various
directions
)]
(
),...
(
),
(
[
a
1a
2a
NA
, an (ND) matrix of steering vectors.= N-element array steering vector for the
idirection of arrivalD i
e e
a
i N d j i d j
i) [1 ... .], 1,2,3,... (
sin ) 1 ( 2 sin 2
The calculations are based on instances of the incoming signal because of the time varying nature of arriving signals. Since the matrix of steering vectors is changing with time, the
corresponding arrival angles will also change. The correlation matrix of the array and the source
correlation matrix are found by the expected value of the respective absolute values squared. i.e.
The noise covariance matrix is R E[n(t)nH(t)] nn
The source covariance matrix is RssE[s(t)sH(t)] The array output covariance matrix is
R E[X(t)XH(t)] xx
Thus,
R
xx
AR
ssA
H
R
nnCorrelation matrix is often referred to as the covariance matrix if the mean values of the signals and noise are zero.
Given -array elements withDnarrowband signal sources with uncorrelated noise. In [5] the following assumptions on the correlation matrix are considered and the same are also considered in this paper. First, is an NNHermitian matrix. A Hermitian matrix is equal to its complex conjugate transpose i.e.,
R
XX
R
XXH . The correlation matrix of the array has N Eigen values along with N associated Eigen vectors . If the Eigen values are sorted from smallest to largest and the matrix E is divided into two subspaces such that . The subspace EN is called thenoise subspace and is constructed by the (ND) Eigen vectors related with the noise. For uncorrelated noise, the Eigen
values are given as 2
2
1
...
N D
n
.The subspace is called the signal subspace and is constructed by theDEigen vectors related with the arriving signals. The noise subspace is an N(ND)matrix. The signal subspace ES is a NDmatrix.
The objective of DOA estimation methods is to describe a function which gives an indication of the angles of the incoming signal based upon maxima vs. angle. This function is conventionally called the pseudo spectrum. The unit of the pseudo spectrum is in energy or in watts.
3. DOA ESTIMATION ALGORITHM
The DOA estimation algorithms are categorized as conventional and subspace algorithms. The Bartlett and Capon (also called as Minimum Variance Distortionless Response) are conventional type algorithms which are highly reliant on the physical size of the array aperture which results in deprived resolution and exactness. MUSIC and ESPRIT methods are categorized under sub space based methods based on the Eigen decomposition [6] which are more precise and gives high resolution and not limited to physical size of the array aperture [7].3.1 MUSIC Algorithm for DOA estimation
MUltiple SIgnal Classification (MUSIC) is one of the popular high resolution techniques that give estimation of the DOA. It was given by Statesmen [8]. This algorithm is based on exploiting the Eigen structure of input covariance matrix. The incident complex signals are somewhat correlated creating non diagonal signal correlation matrix. The algorithm is used to describe the techniques involved in obtaining the parameters of various wave fronts arriving at the antenna array based on the calculations made on the received signal at the sensor array. MUSIC algorithm divides the decomposition of the input covariance matrix into two orthogonal matrices, i.e., signal-subspace and noise-signal-subspace in which the noise signal-subspace is used for finding the Direction of arrival. The algorithm is summarized as following:1. The array correlation matrix is found by
R
xx
AR
ssA
H
n22. The Eigen values and Eigen vectors for
R
xxare calculated and sorted them in ascending order.3. Last ‘D’ Eigen vectors are corresponding to the signals and First ‘
N
D
’Eigen vectors are corresponding to the noise. 4. TheN(ND)dimensional subspace spanned by theEigen vectors corresponding to the noise is formed such that
]
...
[
1 2 N D Ne
e
e
E
5. The MUSIC pseudo spectrum is obtained by
) ( )
( 1 )
(
a E E a P
H N N H MUSIC
The DOA angle is estimated by the peaks in the obtained pseudo spectrum.
4. EMPIRICAL MODE DECOMPOSITION
EMD is relatively unconventional method in Signal Processing proposed by Huang et al. [9]. It is an adaptive signal analysis method applicable to time-frequency analysis of nonlinear and non stationary signals [10]. EMD decomposes the given signal DOA estimationstage
X1(k)
.
.
. .
Θ2
S2(k)
S1(k)
Θ1
SD(k) X
N(k)
X2(k)
ΘD
MUSIC
into a finite number of zero-mean functions, called Intrinsic Mode Functions (IMFs). These IMF’s are obtained as the combination of amplitude and frequency modulated sinusoids. An IMF is defined as a function that satisfies the following requirements:
1. In the entire data set, the number of extrema and the number of zero-crossings must be equal or differ at most by 1.
2. The mean value of the envelope defined by the local maxima and the local minima at any point is zero.
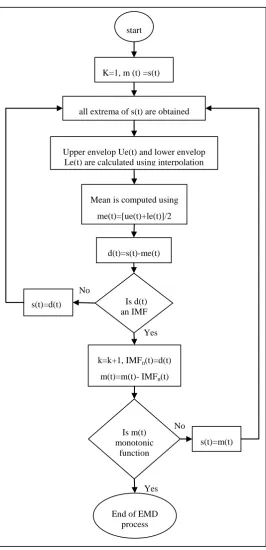
Instead of constant amplitude and frequency in a simple harmonic component, an IMF can have variable amplitude and frequency along the time axis. The procedure of extracting an IMF is called “sifting”. IMF generation process for a given signal is shown in Fig 2.
5. EMD BASED DOA ESTIMATION
Robust scheme for DOA estimation using Empirical Mode Decomposition (EMD) algorithm is shown in Fig 3. EMD is given for pre-processing prior to the DOA estimation stage. The algorithm separately de-noises the rows of the array data matrix where each row corresponds to the output of a particular array sensor, i.e. the signals X1(K),X2(K)...XN(K)are given to
EMD de-noising.
)
(
)
(
.
)
(
K
A
S
K
n
K
[image:3.595.307.574.77.629.2]Xi
, for i=1,2,..N. --- (2) The noise corrupted signals Xi(K)(for i=1,2,..N) are given to EMD. The IMFs are generated by decomposition procedure. Noise signal is characterized by high frequency components [11]. Thus, starting extracted IMFs are treated as noise IMFs and are discarded and the remaining IMF’s are summed with the residue. The de-noised signal is then applied to the MUSIC algorithm for estimating the direction of arrival.Fig 3: Receive array with De-noising prior to DOA estimation
Fig 2: Flow diagram of EMD process
5. SIMULATION RESULTS AND
DISCUSSIONS
The above technique for DOA estimation is simulated using MATLAB. The performance of the algorithm has been analyzed by considering the performance measure of signal to noise ratio. The numerical example considered in this paper is with 6 array elements separated by a distance of λ/2. Additive white Gaussian noise is considered with 0.1 variance. The simulation has been run for the incoming signals from 3 different angles
1
25
,
2
20
and
3
35
. The effect ofNo Yes No
Yes start
K=1, m (t) =s(t)
all extrema of s(t) are obtained
Upper envelop Ue(t) and lower envelop Le(t) are calculated using interpolation
Mean is computed using me(t)=[ue(t)+le(t)]/2
d(t)=s(t)-me(t)
k=k+1, IMFn(t)=d(t)
m(t)=m(t)- IMFn(t)
s(t)=m(t) Is d(t)
an IMF
Is m(t) monotonic
function s(t)=d(t)
End of EMD process DOA
estimation stage De-noising stage
X1(k)
.
.
. .
Θ2
S2(k)
S1(k)
Θ1
SD(k) X
N(k)
X2(k)
ΘD
EMD
MUSIC EMD
.
20 changing the SNR with four different values (10, 20,-10,-20)
[image:4.595.321.521.134.337.2]dB is shown in Fig 4 and Fig 5. It is clearly evident that the MUSIC algorithm with high values of SNR (10dB, 20dB) gives the estimated angle close to the true angles of arrival whereas with the low values of SNR (-10dB,-20dB) the algorithm cannot predict the angles. Particularly at very low SNR values (say -20dB) the MUSIC algorithm is not capable for angle estimation. The power levels also decreases for low values of SNR.
Fig 4: The effect of variation in SNR (10,-10)dB on MUSIC algorithm
For very low SNR value (-20dB) MUSIC algorithm fails to detect the arrival angles and biasing of the signal occurs as shown in Fig 5. Hence false detection occurs and it can be eliminated by using EMD as a de-noising scheme prior to the DOA estimation stage.
Fig 5: The effect of variation in SNR (20,-20) on MUSIC algorithm.
For SNR =0 dB, the MUSIC algorithm could able to estimate the direction of the arriving signals approximately with less power as shown in Fig 6. Whereas the EMD-MUSIC algorithm
[image:4.595.67.270.177.386.2]estimates the directions of the angles with more power compared with the MUSIC algorithm. The comparison between MUSIC and EMD-MUSIC algorithm for different values of SNR are shown in below figures.
[image:4.595.323.520.380.590.2]Fig 6: Comparison between MUSIC and EMD-MUSIC spectrum for SNR = 0dB
Fig 7: Comparison between MUSIC and EMD-MUSIC spectrum for SNR =-10dB
For very low SNR value (-10 dB) MUSIC algorithm is not able to detect the peaks or the true angles as shown in Fig. 6. But using EMD as a de-noising method, the performance of the MUSIC algorithm was improved in estimating the angle closer to the true angle.
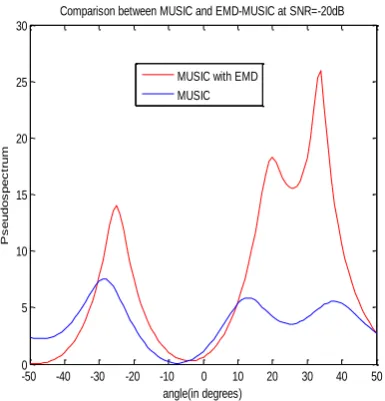
For very low SNR value (-20 dB) MUSIC algorithm is not able to detect the peaks or the true angles as shown in Fig. 7. But using EMD-MUSIC method, the performance of the MUSIC algorithm was improved in estimating the angle closer to the true angle.
-50 -40 -30 -20 -10 0 10 20 30 40 50 0
5 10 15 20 25 30 35 40
angle(in degrees)
P
s
e
u
d
o
s
p
e
c
tr
u
m
MUSIC
SNR= -10 dB SNR=10 dB
-50 -40 -30 -20 -10 0 10 20 30 40 50
0 5 10 15 20 25 30 35 40 45 50
angle(in degrees)
P
s
e
u
d
o
s
p
e
c
tr
u
m
MUSIC
SNR= -20 dB SNR=20 dB
-50 -40 -30 -20 -10 0 10 20 30 40 50
0 5 10 15 20 25 30 35 40
Comparison between MUSIC and EMD-MUSIC at SNR=0dB
angle(in degrees)
P
s
e
u
d
o
s
p
e
c
tr
u
m
MUSIC with EMD MUSIC
-50 -40 -30 -20 -10 0 10 20 30 40 50 0
5 10 15 20 25 30
Comparison between MUSIC and EMD-MUSIC at SNR=-10dB
angle(in degrees)
P
s
e
u
d
o
s
p
e
c
tr
u
m
[image:4.595.68.270.503.697.2]Fig 8: Comparison between MUSIC and EMD-MUSIC spectrum for SNR =-20dB
Table 1. Angle estimation at various SNR’s
SNR (in dB)
TRUE ANGLE
(in degrees)
MUSIC Estimated
ANGLE (in degrees)
EMD MUSIC Estimated ANGLE
(in degrees)
20
-25 -25 -25
20 20 20
35 35 35
10
-25 -25 -25
20 20 20
35 35 35
0
-25 -25 -25
20 20 20
35 34 35
-10
-25 -25 -25
20 16 19
35 36 35
-20
-25 -29 -25
20 13 20
35 38 34
Using Empirical Mode decomposition as a de-noising stage prior to the directional of arrival stage gives the exact values even at SNR = -20dB. So EMD based de-noising enhances the resolution in direction of arrival estimation.
5. CONCLUSION
This paper presents results of direction of arrival estimation using MUSIC algorithm. The effect of signal to noise ratio on the performance of the MUSIC algorithm and its ability to resolve incoming signals accurately and efficiently has been performed. To increase the estimation performance, EMD based de-noising scheme is considered. The results show that the estimation performance of MUSIC increased significantly for when EMD based de-noising is applied prior to DOA estimation stage.
EMD based technique in combination with ESPRIT algorithm can be used to improve the performance of the direction of arrival (DOA) estimation which is the future scope of this paper.
6. REFERENCES
[1] Moustafa M. Abdalla, Mostafa B. Abuitbel, Mohamed A. Hassan,"Performance evaluation of direction of arrival estimation using music and esprit algorithms for mobile communication systems” ©2013 IEEE.
[2] Frank B.Gross, Smart Antennas for Wireless Communications.
[3] Mustafa Abdalla, Khaled A. Madi, and Rajab Farhat, “Sensitivity Analysis for Direction of Arrival Estimation Using Capon and Music Algorithms in Mobile Radio Environment”,International Science Index 72, 2012 waset.org/publications/7555.
[4] Anil Chacko, Samit Ari “Denoising of ECG signals using Empirical Mode Decomposition based technique” ISBN: 978-81-909042-2-3 ©2012 IEEE.
[5] Ainur K. Shauerman , Alexander A. Shauerman “Spectral- Based Algorithms of Direction-of-Arrival Estimation for Adaptive Digital Antenna Arrays” , ISBN 978-1-4244-6628-3/10/$26.00 © IEEE.
[6] K.Al-Midfa, ''Investigation of Direction-of-Arrival Algorithms''. Ph.D. Thesis, University of Bristol, UK, 2003.
[7] Tsoulos, G “Smart Antennas for Mobile Communication Systems: Benefits and Challenges”, IEE Electron. Comm.Eng. Journal, ll (2): 84-94, Apr. 1999.
[8] Schmidt, R., “Multiple Emitter Location and Signal Parameter Estimation,” IEEE Transactions on Antenna. Propagation, Vol. AP-34, No. 2, pp. 276–280, March 1986.
[9] N. E. Huang, Z. Shen, S. R. Long et al., “The empirical mode decomposition and the Hubert spectrum for nonlinear and non-stationary time series analysis,” Proceedings of the Royal Society A, vol. 454, no. 1971, pp. 903–995, 1998.
[10] Kusma Kumari Cheepurupalli and Raja Rajeswari Konduri,“Noisy Reverberation Suppression Using AdaBoost Based EMD in Underwater Scenario”, Hindawi Publishing Corporation International Journal of Oceanography, Article ID 563780, 7 pages, 2014. [11] W.-B. Jin and Y. Jun, “Velocity determination of single
sound source based on Doppler Effect,” in Proceedings of the International Conference on Wavelet Analysis and Pattern Recognition (ICWAPR ’07), pp. 956–961, Beijing, China, November 2007.
-50 -40 -30 -20 -10 0 10 20 30 40 50
0 5 10 15 20 25 30
Comparison between MUSIC and EMD-MUSIC at SNR=-20dB
angle(in degrees)
P
s
e
u
d
o
s
p
e
c
tr
u
m