Weighted Non-Linear Diffusion Filtering with Wavelet
Thresholding in Image Denoising
Reena Singh
Research Scholar, ECED MNNIT, Allahabad
V. K. Srivastava
Professor, ECED MNNIT, Allahabad
ABSTRACT
Wavelet based image denoising is an important technique in the area of image noise reduction. In this paper, a new adaptive wavelet based image denoising algorithm in the presence of Gaussian noise is developed. In the existing wavelet thresholding methods, the final noise reduced image has limited improvement. It is due to keeping the approximate wavelet coefficients unchanged. Since noise affects both approximate as well as detail coefficients, the proposed technique incorporates methods to eliminate noise in both types of coefficients. The propose technique is applied in two phases. In the first phase, an adaptive data driven threshold for image denoising via wavelet soft-thresholding is applied on detail coefficients. In the second phase of the proposed algorithm, anisotropic diffusion is applied on approximate coefficients. In this context, a weighted diffusivity function is proposed which incorporates contextual discontinuities in the image. The diffusivity function derived is applied depending on local image features and hence improve the capability of feature preservation along with noise removal. The proposed technique was applied on standard noisy image and the results obtained show the superiority of the method over other wavelet based denoising techniques.
General Terms
Image denoising, anisotropic diffusion
Keywords
Wavelet thresholding, BayesShrink, anisotropic diffusion, weighted diffusivity function, denoising, wavelet coefficients.
1.
INTRODUCTION
Images are often corrupted by noise during the acquisition and transmission process, which usually induces the degradation of image quality. Image denoising is the problem of estimating the noise free image from the noisy observation. There are various methods for image denoising. Simple mathematical filters such as average filter, median filter and Gaussian filter are some of the techniques employed for image denoising [1].Also, wavelet thresholding is a method which has been reported in several studies for noise reduction [8, 14].FFT based image denoising technique does not preserve the sharpness of the edge as in the original image since its basis functions are not localized in time or space [10, 25]. The localized nature of wavelet transforms both in time and space results in denoising with edge preservation. The discrete wavelet transform (DWT) can decompose the image in to a form with a series of coefficients [12]. Small coefficients are dominated by noise while coefficients having large absolute values carry more signal information than noise. Replacing noisy coefficient below a certain threshold value by zero leads to denoised image [23] . As the advantage of this method the edges of the image will be preserved. However they tend to destroy the texture regions of the image.
Besides wavelet thresholding, anisotropic diffusion [15] is also applied for denoising of images. The basic idea behind anisotropic diffusion is to evolve from an original image uo (x, y), defined in a convex domain Ω Ϲ R×R, a family of increasingly smooth images u(x, y) derived from the solution of the following partial differential equation [20]:
(1)
Where c(.) is the diffusion coefficient chosen to be non-negative and monotonically decreasing function of gradient magnitude , which satisfies certain criteria such as diffuses more in smooth areas and less around large intensity transitions. It enables smoothing of noise like regions and perseverance of edges. Such diffusivity function is given by:
(2)
Where k is a constant to be tuned for particular application. The limitation of the above diffusion equation is that image close to each other is likely to diverge during the diffusion process. The ill-posedness of above diffusion equation has been reviewed by several researchers. Catte et al [3] proposed a Gaussian regularized version of the Perona-Malik diffusion by replacing the image gradient with a smoothed gradient (Gσ*u) in the diffusivity function. From the point of view of robust statistics, Black et al [4] suggested the Tukey’s biweight diffusivity function to introduce robust anisotropic diffusion with preservation of sharp boundaries and better continuity of edges. Yu et al [5] presented kernel anisotropic diffusion by defining a kernalised diffusivity function to improve the effectiveness of anisotropic diffusion in denoising the low signal to noise ratio images. However all the work reviewed here has certain drawbacks such that they don’t incorporate adaptively to local contextual features. This resulted in thin edges blurring and fine features loss during the diffusion process. In this paper, to avoid smoothing of image features in anisotropic diffusion filtering, a novel scheme called context adaptive anisotropic diffusion [18] is applied via weighted function. It allows feature preservation along with noise removal.
performance comparison with other methods is done on section-4.Finally section-5 gives the conclusion of the work done in this paper.
2.
LITERATURE SURVEY
The background of proposed work is in two parts. Section-2.1 describes anisotropic diffusion and section-2.2 gives the concept of wavelet thresholding methods and also explains the different thresholding methods.
2.1
Denoising using Non-Linear diffusion
filtering
Physical background of diffusion processes
Diffusion is a physical process that equilibrates concentration differences without creating or destroying mass [20]. The equilibrium property is expressed by Fick’s law:
(3)
This equation states that a concentration gradient causes a flux j which aims to compensate for this gradient. D is a diffusion tensor, a positive definite symmetric matrix. The case where j and are parallel is called isotropic. Here diffusion tensor [19] is simply replaced by a positive scalar valued diffusivity g. In the general anisotropic case, j and are not parallel.
The concept of diffusion is expressed by the continuity equation given by:
(4)
Where t denotes time. Combining (1) and (2) we get diffusion equation by:
(5)
If the diffusion tensor D is constant over the whole image domain, it is called homogenous diffusion and a space dependent filtering is called inhomogeneous diffusion. If the diffusion filter is independent of image features, it leads to linear diffusion filtering and if it is a function of differential structure of the image, it leads to non-linear diffusion filtering.
Perona - Malik model
P-M proposes a non-linear diffusion [26] method for avoiding the blurring and localization problems of linear diffusion filtering. They apply an inhomogeneous process that reduces the diffusivity at those locations which have a larger likelihood to be edges. This likelihood is given by:
(6)
With initial condition u(x, y, 0) =u(x, y) and g (.) is a non-negative function of magnitude of local image gradient . The desirable characteristics of diffusion coefficient are such that:
1. It diffuses more in smooth areas and less around large intensity transitions.
2. It incurs backward diffusion around large intensity transitions so that edges are sharpened and to assure forward diffusion in smooth areas for noise removal. Two such diffusion coefficients suggested by P-M are: (7)
(8)
Where s= and k is conductance parameter. Optimum value of k is chosen so that diffusion is performed efficiently.
High values of k leads to edge smoothing and low value results in inefficient diffusion. However in some cases the diffusion coefficients suggested by P-M leads to misinterpretation of noise as edges and enhance them to create false edges. The ill-posedness is alleviated through the introduction of a smoothing operation to a variable of diffusion coefficient such that
(9)
2.2
Denoising using wavelet thresholding
Wavelet denoising attempts to remove noise present in signal while preserving the signal characteristics, regardless of the frequency content. It involves three steps: a linear forward transform, nonlinear thresholding step and a linear inverse wavelet transform. Wavelet shrinkage [8, 9] is a non-linear process and the efficiency of this denoising technique heavily depends on the choice of threshold.
Denoising Concept
Let the signal be {fij}, i=1…M, j=1…N where M, N are the matrix dimension corrupted by additive noise. The noisy version of the signal is given by:
gij = fij + nij (10)
Where {nij} are independent and identically distributed (iid) zero mean, white Gaussian noise with standard deviation σ.The goal is to estimate {fij} from noisy observation {gij}.Such that mean squared error (MSE) is minimum. The two-dimensional orthogonal discrete wavelet transforms (DWT) and its inverse is denoted by W and W-1 respectively. Then P represents the matrix of wavelet coefficients of Y having four sub-bands namely LL, LH, HL, HH. By applying the wavelet thresholding [14] method on each coefficient of P from the detail sub-band using a hard or soft threshold function, the truncated coefficient namely matrix is obtained
i.e. = (11) The soft threshold function is given by:
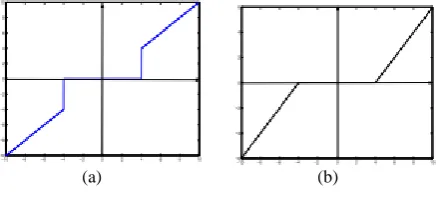
(12) It takes the argument and shrinks it towards zero by the threshold T. The other popular alternative is hard threshold function given by:
(13) = 0, otherwise.
Using above functions all the coefficient values less than the threshold in each sub-band is replaced by zero, and the value greater than the threshold is unchanged. In applications, soft thresholding is more preferable over hard thresholding as it gives more visually pleasant images [7]. Finding an optimum threshold is a tedious process. A small threshold value may retain the noisy
(a) (b)
[image:2.595.322.542.645.744.2]Coefficient while a large value tends to loss of coefficients that carry image details. Many threshold selection processes exists, but in this paper, focus is on some representative ones. They are VisuShrink, Sureshrink and BayesShrink [14, 16] A brief explanation of the methods is given below:
1. VisuShrink: It is based on applying the universal threshold proposed by Donoho and Johnstone [4]. This thresholding is given by , where the standard deviation of noise and n is is the number of pixels in the image. This threshold does not adapt well to discontinuities in the image.
2. SureShrink: The SURE (Stein’s Unbiased Risk Estimate) method generates threshold derived from minimizing risk when soft threshold is used [11].Sureshrink method is a hybrid of the universal and SURE threshold, with the choice being dependent on the energy of the particular sub-band. This threshold is data driven and does not depend on the number of samples explicitly.
3. BayesShrink: This rule uses a Bayesian mathematical framework for image to derive sub-band dependent thresholds. It provides threshold that empirically minimizes the Bayesian risk based on the assumption that the images show properties of generalized Gaussian Distribution (GGD) [10][20]. The estimated threshold for each sub-band is given by:
(14)
Where is the estimated noise variance and is the standard deviation of the noise free sub-band coefficients. The noise variance is estimated as the median absolute deviation (MAD) of the diagonal detail coefficients of level 1 .e. HH1 sub-band given by:
(15) Where is the wavelet coefficient of HH1 subband
The estimate of the subband noise free standard deviation is given by:
(16) , where is the variance estimate of the noisy coefficients. Based on the comparative results of above methods, we found that BayesShrink performs better than Sure and VisuShrink in terms of Mean Square Error (MSE). The reconstruction using BayesShrink is smoother and visually more appealing than the one obtained using SureShrink.In this paper,wavelet thresholding technique based on BayesShrink rule is used and is applied to detail coefficients.
3.
PROPOSED WORK
The wavelet thresholding method is applied on noisy image after wavelet decomposition. The detail coefficients are threshold such that the coefficient less than the threshold are eliminated and above the threshold are retained. This method is not efficient in removing noise that is affected in large pixel values. On the other hand, the context adaptive non-linear diffusion filtering is able to retain the texture and edges in the image while reducing noise in large pixel values. In the work presented here, both wavelet thresholding and non-linear diffusion filtering is applied in order to reduce noise affecting
large as well small magnitude coefficients. The proposed denoising algorithm is explained as below:
I. The wavelet decomposition of noisy image at level N is done using appropriate wavelet filter.
II. For each level from 1 to N, appropriate threshold is selected based on MAD method and then soft threshold is applied on detail coefficients.
III. Thereafter non-linear diffusion filtering is applied on approximate coefficients. The process is explained below:
Let I(x, y, t) be the approximate coefficient at location x, y at iteration t. In order to preserve the intrinsic features (i.e... edges and textures) underlying an image as much as possible, context adaptive non-linear diffusion filtering is applied. The diffusion filtering equation is given as:
(17)
The above equation can be implemented by using finite difference method by using 8 nearest neighbors given as: (18)
To assign proper weights and hence control diffusion, it is necessary to obtain local image features. Local gray level variance is calculated in order to obtain contextual discontinuities from the image.
Local gray level variance is given by:
(19)
Where D is suitable window size, mI(x, y) is local mean. T more effectively characterizes the local features of the image. Figure shows the local gray level variance over a 7×7 window.
It is being observed that local gray level variance increases in regions containing edges or textures. As the degree of homogeneity increases the local gray level variance approaches noise variance(σn
2
).As a result of above observation, w(x,y) is constructed by incorporating both σI2 (x,y) and σn
2
at time t, which takes an exponentially decaying form as follows:
(20)
Where and ρ are tunable parameters controlling the steepness and sensitivity respectively. The behavior of w(x, y) is such that as σI2 (x, y) increases w(x, y) →0 and vice-versa. It means in homogenous regions, w(x, y) tends to 1 while in heterogeneous regions it tends to 0 and hence stops the diffusion process. This preserves the image features whole removes the noise.
The diffusion process is implemented in the following steps: Set parameters ρ, λ, and the no. of iterations.
(b) Estimate the local gray level variance σI2 (x, y) for each coefficient by using (19).
(c) Calculate the values of weight w(x, y, t) for each coefficient according to (20).
(d) Perform the diffusion according to (17) until no. of iterations met.
IV. Apply the inverse wavelet transform to obtain the denoised image.
Once the noise is removed, the denoised image should be similar in appearance to the original image. To better evaluate the performance of proposed method, Peak signal to Noise ratio has been used. This performance criterion is also described in the following section.
4.
EXPERIMENTAL RESULTS AND
PERFORMANCE EVALUATION
The advantage of the proposed method against other image denoising methods is evaluated by comparison of their noise removal performance using different test images as shown in Fig.2. The images taken are grayscale of size 512×512 each. In the evaluation process, the original images were corrupted by adding zero mean white Gaussian noise , salt and pepper noise and speckle noise.
1 2
[image:4.595.319.541.71.296.2]3 4
Fig 2: Test images used in evaluation of proposed method
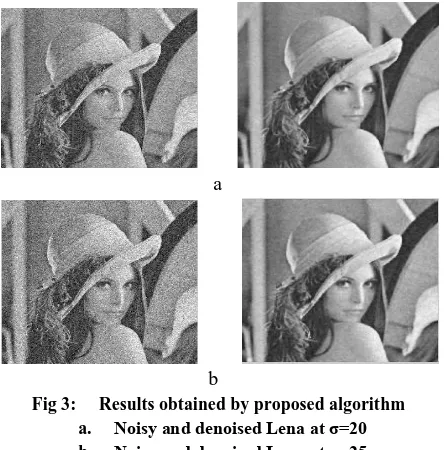
Initially, the noisy image is decomposed using a 5-level discrete wavelet transform. The decomposition is performed using Db10 mother wavelet. This mother wavelet has a good noise reduction capability .The wavelet coefficients are grouped in to approximate and detail sub bands. The finest level has the highest resolution and as the level increases resolution decreases. The soft thresholding method using MAD approach was applied on the detail coefficients in each level. The context adaptive weighted diffusivity function is applied on the approximate coefficients as described in previous section. Finally by applying the inverse wavelet transform, the denoised image is obtained. The performance of the proposed denoising algorithm at different standard deviations is shown in Fig.3.
a
b
Fig 3: Results obtained by proposed algorithm a. Noisy and denoised Lena at σ=20 b. Noisy and denoised Lena at σ=25
The proposed method was compared with P-M anisotropic diffusion and context adaptive diffusion techniques and the results are shown in Fig. 4.
a b
c d
[image:4.595.55.266.335.532.2]
e
Fig 4: Comparison of proposed method with existing methods
a) Original image
b) Noisy image (Gaussian σ=20 ,speckle and salt and pepper noise)
c) Denoised image using P-M anisotropic diffusion d) Denoised image using Context adaptive
anisotropic diffusion
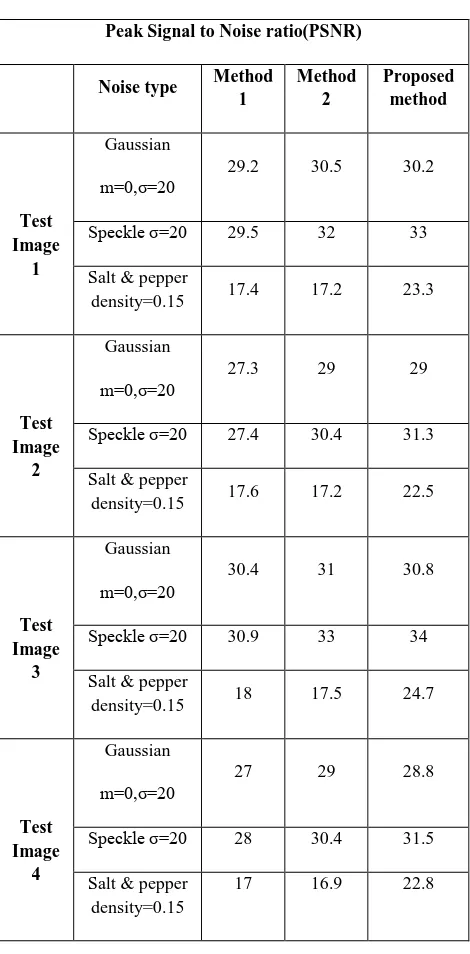
[image:4.595.317.541.352.632.2]The methods can be evaluated by visually comparing their output performances. To numerically compare the performance of the proposed method with the existing denoising methods as shown in Table I, a PSNR criterion is used. As shown in Table I, the proposed method gives better results for all three types of noise as compared to P-M anisotropic diffusion. The performance of proposed technique is superior in reducing speckle and salt and pepper noise in comparison to method1 and method2.
PSNR:
It stands for Peak Signal to Noise ratio. It is a performance metric for the ratio between the maximum possible power of a signal and the power of the corresponding noise that affects the fidelity of its representation. It is most commonly used as a measure of quality of denoised signal or image. For M×N images, and are respectively noisy and denoised images. The PSNR is defined as follows-
Where MAX(Y) =255 for 8 bit grayscale image.MSE stands for Mean square Error. It is given by:
[image:5.595.312.547.120.597.2]
TABLE 1. Comparison of proposed method performance with the existing methods in reducing noise from different
images. Method 1= P-M anisotropic diffusion and Method 2=Context adaptive anisotropic diffusion
Peak Signal to Noise ratio(PSNR)
Noise type Method 1
Method 2
Proposed method
Test Image
1
Gaussian m=0,σ=20
29.2 30.5 30.2
Speckle σ=20 29.5 32 33
Salt & pepper
density=0.15 17.4 17.2 23.3
Test Image
2
Gaussian m=0,σ=20
27.3 29 29
Speckle σ=20 27.4 30.4 31.3
Salt & pepper
density=0.15 17.6 17.2 22.5
Test Image
3
Gaussian m=0,σ=20
30.4 31 30.8
Speckle σ=20 30.9 33 34
Salt & pepper
density=0.15 18 17.5 24.7
Test Image
4
Gaussian m=0,σ=20
27 29 28.8
Speckle σ=20 28 30.4 31.5
Salt & pepper density=0.15
17 16.9 22.8
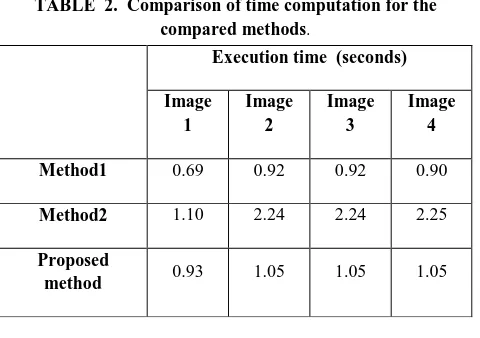
TABLE 2. Comparison of time computation for the compared methods.
5.
CONCLUSIONS
In this paper, context adaptive non-linear diffusion and wavelet thresholding methods are combined for the purpose of image denoising. Initially, wavelet thresholding was a very effective and popular method in image denoising. But since it was not applied to approximate coefficients, noise affecting these coefficients remains in denoised image. This affects the performance of final denoised image hence to remove noise affecting approximate coefficients non-linear diffusion filtering is applied on these coefficients along with wavelet thresholding to detail coefficients. This combination reduces noise from both approximate as well as detail coefficients and increases the quality of final denoised image effectively. Further to the basic anisotropic diffusion technique, context adaptive weighted diffusivity function is incorporated for increasing the effectiveness of anisotropic diffusion. This further increases the quality of the denoised image. The performance of the proposed algorithm is evaluated using standard images. The result obtained indicates that the proposed method gives better performance in comparison to P-M anisotropic diffusion technique.
6.
REFERENCES
[1] Senel H.G.,Peters R.A.,Dawant B.: “Topological median filters”, IEEE Trans. Image Process, 2002,11,(2),pp. 89-104.
[2] Chang S.G., YU B., Vetterli M.: ‘Adaptive wavelet thresholding for image denoising and compression’, IEEE Trans. Image Process., 2000, 9, (9), pp. 1532–1545 [3] Catte, F., Lions, P.L., Morel, J.M., Andcoll, T.: ‘Image selective smoothing and edge detection by nonlinear diffusion’, SIAM J. Numer.Anal., 1992, 29, (1), pp. 182– 193
[4] Black, M.J., Shapiro, G., MARIMONT, D.H., AND Heeger, D.: ‘Robust anisotropic diffusion’, IEEE Trans. Image Process., 1998, 7, (3),pp. 421–432
[5] Yu, J.H., Wang, Y.Y., and Shen, Y.Z.: ‘Noise reduction and edge detection via kernel anisotropic diffusion’, Pattern Recognition. Lett.,2008, 29, (10), pp. 1496–1503
[6] Canny, J.: ‘A computational approach to edge detection’, IEEE Trans.Pattern Anal. Mach. Intel., 1986, 8, (6), pp. 679–697
[7] S. G. Chang, B. Yu, and M. Vetterli, “Adaptive wavelet thresholding for image denoising and compression,” IEEE Trans. Image Process., vol. 9, no. 9, pp. 1532– 1546, Sep. 2000.
[8] S. G. Chang, Y. Bin, and M. Vetterli, “Spatially adaptive wavelet thresholding with context modeling for image denoising,” IEEE Trans.Image Process., vol. 9, no. 9, pp. 1522–1531, Sept. 2000.
[9] D. L. Donoho and I. M. Johnstone, “Ideal spatial adaption via wavelet shrinkage,” Biometrika, vol. 81, pp. 425–455, 1994.
[10]S. Beheshti and M. A. Dahleh, “A new information-theoretic approach to signal denoising and best basis selection,” IEEE Trans. Signal Processing, vol. 53, no. 10, pp. 3613–3624, Oct. 2005.
[11]T. Blu and F. Luisier, “The SURE-LET approach to image denoising,”IEEE Trans. Image Process., vol. 16, no. 11, pp. 2778–2786, Nov.2007.
[12] Gonzalez R.C. Woods: ‘Digital image processing’(Prentice-Hall, 2004)
[13] Aubert g., kornprobst p.: ‘Mathematical problems in image processing: partial differential equations and calculus of variations’ (Springer, New York, 2005) [14]Chang S.G., Yu b., Vettereli m.: ‘Adaptive wavelet
thresholding for image denoising and compression’, IEEE Trans. Image Process., 2000, 9, (9), pp. 1532–1546 [15]You Y.-L., Xu W., Tannenbaum A., Kaveh M.: ‘Behavioral analysis of anisotropic diffusion in image processing’, IEEE Trans. Image Process., 1996, 5, (11), pp. 1539–1553
[16]Donoho D.L.: ‘Denoising by soft thresholding’, IEEE Trans. Inf. Theory, 1995, 41, (3), pp. 933–936
[17]M.Nikpour and H.Hassanpour,” Using diffusion equations for improving performance of wavelet based image denoising techniques”,IET Image Process.,2010.Vol.4,Iss.6,pp. 452-462
[18]H.C.Li, P.Z.Fan and M.K.Khan,” Context-adaptive anisotropic diffusion for image denoising”, ELECTRONICS LETTRES 5th July 2012 Vol. 48 N0.14 [19]Feng Liu and Jingbo Liu,”Anisotropic diffusion for
image denoising based on diffusion tensors”, J.Vis. Commun.Image R.23(2012)16-521
[20]J.Wickert,” Theoretical foundations of anisotropic diffusion in image processing”,Comput 221-236 .Suppl.,11 (1996)
[21]Wenhua Ma,Yu-Li You and M.Kaveh,”Monotonically edge-sharpening anisotropic diffusion”,Journal of Electronic Imaging21(1),013008(Jan-Mar2012) Execution time (seconds)
Image 1
Image 2
Image 3
Image 4
Method1 0.69 0.92 0.92 0.90
Method2 1.10 2.24 2.24 2.25
Proposed