Volume72– No.21, June 2013
2.50 Gbps Optical CDMA Transmission System
Debashish Sahoo
Electronics and CommunicationEngineering Department National Institute of Technology
Hamirpur, INDIA
Naresh Kumar
Electronics and CommunicationEngineering Department National Institute of Technology
Hamirpur, INDIA
D.R. Rana
Electronics and Communication Engineering Department National Institute of Technology
Hamirpur, INDIA
ABSTRACT
Optical CDMA technique is required to meet the increased demand for high speed, large capacity communications in optical networks. Data access security and ability to support asynchronous burst data transmission are the major driving forces to generate interest in the OCDMA techniques. In this paper, we have presented an OCDMA model to the range of 100 km. The simulation results reveal that the transmission distance is limited mainly by the multi-access interference (MAI) which arises when there are a large number of users in the system because of the fact that one user data becomes noise for all other users in the channel.
General Terms
Optical Code Division Multiple Access, Multi User Interference
Keywords
1.
Optical Code Division Multiple Access (OCDMA), Bit Error Rate (BER), Pseudo Orthogonal (PSO) code, Multi-Access Interference (MAI), Non-Return-to-Zero (NRZ), Single Mode Fiber (SMF).2.
INTRODUCTION
Extensive study of Code Division Multiple Access (CDMA) has been carried out in the context of microwave communications. It allows users to access any shared channel randomly at any arbitrary time. Its use in optical fiber networks has attracted considerable attention since 1985 [1]. In long distance optical networks, the information consists of a multiplexed aggregate data stream originating from many individual subscribers and normally is sent in a well time-synchronous format. Optical CDMA transmission systems do not require any time or frequency management [2]. It operates asynchronously without centralized control and does not suffer from packet collisions. As a result, OCDMA systems have lower latencies than TDMA. In an OCDMA system each bit is divided into N time periods, called chips [3]. An optical signature sequence can be created by sending short optical pulse during some chip intervals, but no others. A user on the OCDMA system has unique signature sequence. The encoder of transmitter represents each bit by sending signature sequence [4-5]. The crosstalk between different users sharing the common fibre channel, known as Multiple Access Interface (MAI) is usually the dominant source of bit errors in an OCDMA system[6].
Future optical CDMA networks need to support multimedia services. Research is still going on to develop a better OCDMA code which will support the multimedia services. The design of a set of eight matrix codes for operation at 2.5 Gbps has been described [7]. The results indicate that the codes propagate satisfactorily if dispersion management is used. Multi-access interference (MAI) in a bursty traffic environment is also discussed. The design consideration of matrices and performance analysis from communication point of view has been studied [8]. OCDMA implementation complexity could be avoided by using a guard time in the codes and an optical hard limiter in the receiver which shows that 2-D wavelength/time codes are better than one-dimensional (1-D) CDMA/WDM combinations [9]. The design of OCDMA system with improved coding techniques which helps in reducing hardware requirement and still offers better performance for higher number of users [10]. In this paper we propose the simulative OCDMA transmitter and receiver with optical fibre reported in section 2. The simulation results have been discussed in section 3. The conclusion of our simulation results is presented in section 4.
3.
SYSTEM DESCRIPTION
Fig 1: Simulation setup of optical CDMA transmission link
4.
RESULTS AND DISCUSSION
Three cases of performance analysis are: Case I describes the analysis of Optical CDMA transmission links with NRZ and RZ modulation, Case II investigates different parameters on optical CDMA transmission link and Case III gives impact of MAI in optical CDMA transmission link.
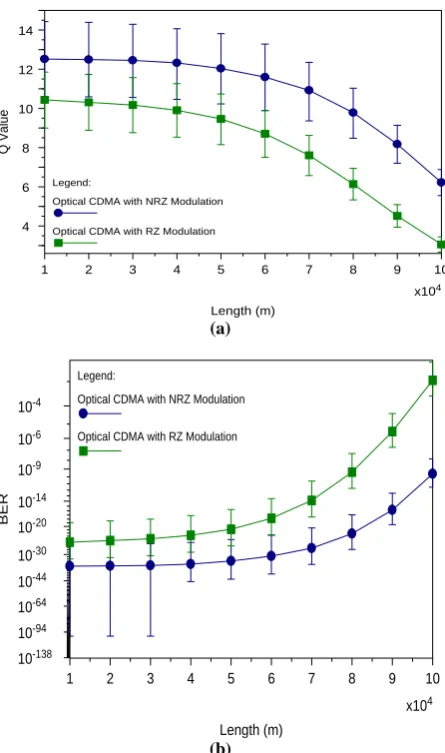
Case I: Performance Investigation in optical CDMA transmission link with NRZ and RZ modulation
The parameters used in this case are data rate 2.50 Gbps, aperture area 180 cm2, transmitted power 3 mW, fiber length 100 km and dispersion 16.75 ps/nm/km.
x104
Length (m)
1 2 3 4 5 6 7 8 9 10
Q
V
a
lu
e
4 6 8 10 12 14
Legend:
Optical CDMA with NRZ Modulation
Optical CDMA with RZ Modulation
(a)
x104
Length (m)
1 2 3 4 5 6 7 8 9 10
B
E
R
10-138
10-94 10-64 10-44
10-30 10-20 10-14 10-9 10-6 10-4
Legend:
Optical CDMA with NRZ Modulation
Optical CDMA with RZ Modulation
(b)
Fig 2: (a) Evaluation of Q-value versus transmission length with NRZ and RZ modulation (b) Evaluation of BER versus transmission length with
NRZ and RZ modulation
The graphs of Q-value and BER versus transmission length for NRZ and RZ modulation are presented in figure 2 (a) & (b). From results it has been observed that there is a significant increase in the value of Q factor when we apply NRZ modulation technique. The Q-value lies within [12.5, 12 and 6.2] and [10.4, 9.5, and 3] for transmission distance of 10 km, 50 km and 100 km in case of NRZ and RZ modulation respectively. In case of BER, it has been observed that there is a significant decrease in the value of BER, which lies within [10-37, 10-33, and 10-10] and [10-26, 10-21, and 10-3] for transmission distance from 10 km, 50 km and 100 km in case of NRZ and RZ modulation respectively
Optical Fiber
. . .
. .
. . .
Optical Power Splitter
Decoder using
PSO code PIN
BER Tester
Decoder using
PSO code PIN
BER Tester
User 1
User 3
Optical CDMA Rx Optical CDMA Tx
User 1
User 3
. . .
.
.
.
.
.
. . .
Optical Multiplexer
Wavelength1
Mode-locked LASER
Wavelength 2
Mode-locked LASER
Wavelength 3
Mode-locked LASER
Wavelength 4
Mode-locked LASER
Optical Multiplexer PRBS
Generator
NRZ Modulator
Mach Zehnder Modulator
Encoder Using PSO
code
EDFA
PRBS Generator
NRZ Modulator
Mach Zehnder Modulator
Encoder Using PSO
code
[image:2.595.318.541.136.513.2]Volume72– No.21, June 2013
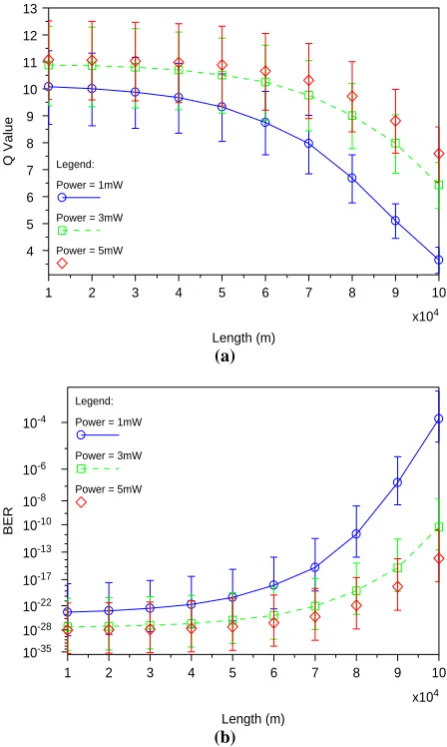
Case II: Performance Investigations of Different parameter in optical CDMA transmission link
x104 Length (m)
1 2 3 4 5 6 7 8 9 10
Q
V
a
lu
e
4 5 6 7 8 9 10 11 12 13
Legend: Power = 1mW Power = 3mW Power = 5mW
(a)
x104 Length (m)
1 2 3 4 5 6 7 8 9 10
B
E
R
10-35 10-28 10-22 10-17 10-13 10-10 10-8 10-6 10-4
Legend: Power = 1mW Power = 3mW Power = 5mW
(b)
Fig. 3: (a) Evaluation of Q Value versus transmission length with different input power levels for single user (b) Evaluation of BER versus transmission length with
different input power levels for single user
The graphs of Q-value and BER versus transmission length at different transmitter power level are presented in figure 3 (a) & (b). From results it has been observed that there is significant increase in the value of Q factor when we increase the transmission power. The Q-value lies within [11.8, 10.6 and 3], [12.5, 12 and 6.3] and [12.8, 12.4 and 7.6] for transmission distance of 10 km, 50 km and 100 km in case of 1 mW, 3 mW and 5 mW respectively. In case of BER, from results it has been observed that there is a significant decrease in the value of BER when we increase the transmission power. BER lies within[10-32,10-26 and 10-5], [10-33, 10-31 and 10-8] and [10-34, 10-32 &10-14] for a transmission distance of 10 km, 50 km and 100 km in case of 1 mW, 3 mW and 5 mW of transmitter powers respectively.
x104 Length (m)
1 2 3 4 5 6 7 8 9 10
Q
V
a
lu
e
6 8 10 12 14 16
Legend: Bitrate = 1.25Gbps Bitrate = 2.50Gbps Bitrate = 3.75Gbps
(a)
x104 Length (m)
1 2 3 4 5 6 7 8 9 10
B
E
R
10-138 10-104 10-78 10-58 10-43 10-32 10-24 10-18 10-13 10-10 10-7
Legend: Bitrate = 1.25Gbps Bitrate = 2.50Gbps Bitrate = 3.75Gbps
(b)
Fig. 4: (a) Evaluation of Q Value versus transmission length with different input bit rates for single user (b) Evaluation of BER versus transmission length with
different input bit rates for single user
[image:3.595.315.539.109.495.2] [image:3.595.54.278.113.487.2]Case III: Impact of MAI in optical CDMA transmission link
x104
Length (m)
1 2 3 4 5 6 7 8 9 10
Q
V
a
lu
e
6 7 8 9 10 11 12 13 14 15
Legend:
Without MAI
With MAI at 2 Users
With MAI at 3 Users
(a)
x104
Length (m)
1 2 3 4 5 6 7 8 9 10
B
E
R
10-138
10-104
10-78
10-58
10-43
10-32
10-24
10-18
10-13
10-10
10-7
Legend: Without MAI
With MAI at 2 Users
With MAI at 3 Users
(b)
Fig. 5: (a) Evaluation of Q Value versus transmission length with and without MAI
(b) Evaluation of BER versus transmission length with and without MAI
The graphs of Q value and BER versus transmission length with and without MAI are given in figure 5(a) & 5(b). It has been observed that the Q-value starts decreasing and BER starts increasing when number of users increase due to Multi Access Interference (MAI) [11]. The Q factor lies within 12.5 to 6.2 for without MAI case, 10.8 to 6.5 for with MAI case at 2 users and 8.7 to 5.9 for with MAI case at 3 users for a transmission length of 10 km to 100 km. The BER lies within 10-37 to 10-10 for without MAI case, 10-28 to 10-5 for with MAI case at 2 users and 10-18 to 10-8.8 for with MAI case at 3 users for a transmission length of 10 km to 100 km. lstmpEye Eye Diagram
x10-10 Time (s)
0 1 2 3 4 5 6 7 8
x10-5
S
ig
n
a
l
(V
)
0 2 4 6 8 10 12
(a)
lstmpEye Eye Diagram
x10-10
Time (s)
0 1 2 3 4 5 6 7 8
x10-5
S
ig
n
a
l
(V
)
0 1 2 3 4 5 6 7 8
(b)
lstmpEye Eye Diagram
x10-10 Time (s)
0 1 2 3 4 5 6 7 8
x10-5
S
ig
n
a
l
(V
)
0 1 2 3 4 5 6
[image:4.595.315.539.67.411.2](c)
Figure 6: Eye diagram of received signal for single user taking NRZ signal (a) without MAI at single user
(b) With MAI at 2 users, (c) with MAI at 3 users
The eye diagrams for single, two and three users are shown in figure 6 (a), (b) & (c). It has been observed that the efficiency of the system is degraded with the increase in number of users. Thus it is established that MAI plays key detrimental role in optical CDMA communication system.
4. CONCLUSION
[image:4.595.53.278.104.424.2] [image:4.595.56.276.597.765.2]Volume72– No.21, June 2013
5.
REFERENCES
[1] Dixon, R. C. 1984. Spread Spectrum Systems, second ed.John Wiley, New York.
[2] Yin, H., Richardson, D. J. 2007. Optical Code Division Multiple Access Communication Networks Theory and Applications, Tsinghua University Press, Beijing and Springer-Verlag GmbH Berlin Heidelberg.
[3] Ahmad, S. 2010 what is Optical CDMA. http:// ezinearticles.com/?What-is-Optical-CDMA?&id= 4177189.
[4] Prucnal, P.R., Santoro, M.A., and Fan, T.R., “Spread Spectrum Fiber-Optic Local Area Network Using Optical Processing”, IEEE Journal of Light wave Technology, 4 (1986) 547-554.
[5] Kwong,W. C., Prucnal, P. R., and Liu, Y. L. 1993. All-serial Coding Architecture for Ultrafast Optical Code-Division Multiple Access, ICC Technical Program, 1 (1993), 552-556.
[6] Yang, C. C., Huang, J. F., and Tseng, S. P. 2004. Optical CDMA Network Codes Structured With M-Sequence Codes Over Waveguide-Grating Routers, IEEE Photonics Technology Letters, 16 (2004) 641-643.
[7] Mendez, A. J., Gagliardi, R. M., Feng, H. X. C., Heritage, J. P., and Morookian, J. M., “Strategies for realizing optical CDMA for dense, high-speed, long span, optical network applications”, IEEE Journal of Light wave Technology, 18 ( 2000) 1685-1697.
[8] Mendez, J., Gagliardi, R.M., Hernandez, V. J., Bennett, C.V., and Lennon, W.J., “Design and performance analysis of wavelength/time (W/T) matrix codes for optical CDMA”, IEEE Journal of Light wave Technology, 21 (2003) 2524-2533.
[9] Mendez, A. J., Gagliardi, R. M., Hernandez, V. J., Bennet, C. V., and Lennon, W. J., “High performance optical CDMA system based on 2-D optical orthogonal codes”, IEEE Journal of Light wave Technology, 22 (2004) 2409-2419.
[10]Kaur, G., and Gupta, N. 2009. Design and performance analysis of optical CDMA system using newly designed multi-wavelength prime sequence codes at 1Gbps bit rate, Special issue on New Technologies, Mobility and Security, (2009).