www.ijsrp.org
Application of Generalized Linear Model to the
Minimization of Defectives in Sewing Process of Apparel
Industry
N.A.M.R.Senaviratna
Department of Mathematics & Computer Science, Open University of Sri Lanka
Abstract- The Apparel industry in Sri Lanka represent as one of the largest contributors for the export revenue of the country. The quality of garments is vital to its survival in an increasingly competitive apparel industry in order to maintain the production of high quality garments and improved productivity in the apparel industry.
The objective of this study is to improve efficiency of the sewing process in apparel industry through the reduction of defectives. This study is focused in three major defect types; run off stitches, unbalanced shape and wavy seams. I have developed generalized linear models for each defect type to find the significant factors affecting on the proportion of occurrence of defects. Under these models, I have recommended few remedial actions to be implemented. On implementation of recommended remedial actions, the percentage of defectives was up to an acceptable level. The outcome of this study reflected that an industry may gain higher productivity and profitability with improved quality product by minimising reworks activities.
Index Terms-Defects, Defects in sewing, Generalized Linear Model, Quality
I. INTRODUCTION
Despite its modest beginnings in 1970s, the apparel industry in Sri Lanka has grown to become one of the largest contributors to the export revenue of the country representing over 43% of its total exports. Moreover the apparel industry also contributes around 39% to the industrial production of Sri Lanka. Being the single largest employer in the manufacturing sector, the apparel industry provides at least 75% of Sri Lanka’s employment directly as well as indirectly.
The quality of garments is vital to its survival in an increasingly competitive apparel industry in order to maintain the production of high quality garments and improved productivity in the apparel industry.
Presently statistical methods are widely used by industries for improving the production process and reducing its defects. Most of the industries in Sri Lanka collect data pertaining to its day to day production process. Only few industries make use of such data for the improvement of their industry. If one can analyze such data by using the proper statistical methods, it would be possible to come across valuable findings, which could be used for the improvement of that industry.
One of the major problems in the apparel industry is the high defect rate. As a result, the rate of production is not as high as expected and also the industry cannot achieve its targets. The biggest disadvantage is the buyer dissatisfaction since the quality of the products is considerably at very lower level. Further cost of the labour used for the reworking of defective products and cost for materials used for defective products are significantly high. Therefore the loss generated due to defects is also significantly high.
In this paper, only the subjects of sewing quality are analyzed. As sewing defects are minimised it is possible for firms to decrease their costs, while they increase the production speed. Hence, they can be more powerful at a competitive atmosphere.
www.ijsrp.org
style consists with four colours which are Black, Cream, Chocolate and Pink mix. Information and data of the garments was required for this study and were collected during the period from December 2011 to February 2012.
Table 1.1: Details of the DN672 style
Item Type of the fabric/foam Supplier
Inner cup fabric Garry fabric South Asia textiles
Foam KBRB Hocheung
Outer cup fabric IPE012 Hayleys
Manufacturing Process
[image:2.612.33.559.246.379.2]
Figure 1.1: Chart of Manufacturing Process of brassieres
II. ANALYSIS AND DISCUSSION
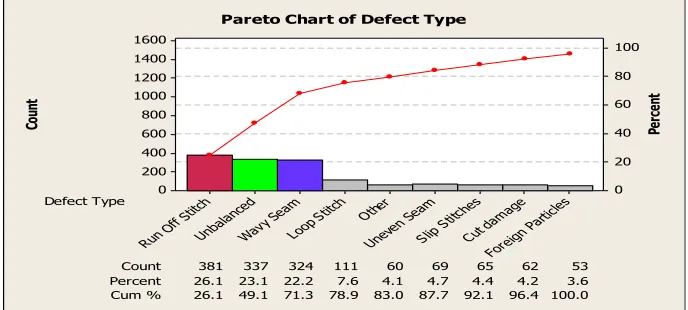
Major types of defects were identified through Pareto Chart shown in Figure 1.2 below;
Co un t Pe rc en t Defect Type Count 53
Percent 26.1 23.1 22.2 7.6 4.1 4.7 4.4 4.2 381
3.6 Cum % 26.1 49.1 71.3 78.9 83.0 87.7 92.1 96.4
337
100.0 324 111 60 69 65Fo 62
reign Pa rticles Cut d
amag e
Slip S titche
s
Uneve n Sea
m Other Loop Stitch Wavy Seam Unba lanced Run O
ff Stitc h 1600 1400 1200 1000 800 600 400 200 0 100 80 60 40 20 0
[image:2.612.134.478.450.605.2]Pareto Chart of Defect Type
Figure 1.2: Pareto Chart of Defect Type
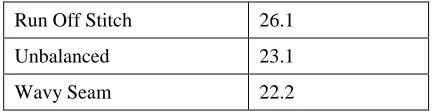
Major defects from Pareto Chart are considered for analysis and the defects are listed in Table 1.2 below;
Table 1.2: Major defects identified from Pareto Chart
Defect Type Percentage
Merchandizing
Department Warehouse
Material Quality
Assurance Lab Sample Room
www.ijsrp.org
Run Off Stitch 26.1
Unbalanced 23.1
Wavy Seam 22.2
[image:3.612.198.418.50.106.2]Four factors identified as a result of the preliminary study and are listed in Table 1.3 which are expected to have an effect on the percentage of defectives;
Table 1.3: Potential Factors
Factors Levels
Colour of the garment Chocolate
Cream Black Pink mix
Size of the garment Small
Large
Line Number 2
3 7 8
Target per Day in each line
200-300 301-400 401-500 501-600 601-700
In order to analyze and identify which factors have the most significant impact on the percentage of defects, the ‘Generalized Linear Modelling’ technique was used with the aid of ‘GLIM 3.76’ statistical package, which was developed by the ‘Working Party’ on Statistical Computing of the Royal Statistical Society. GLIM programs were tried to write for major defect types, considering the presence or absence of a defect in a garment as a Bernoulli trial.. Since the number of parameters is higher than the number of observations, full model could not be fitted. Then I tried to fit the model with main factors and certain two-way interaction terms. However, adequate model was not found under the binomial distribution.
Then the ‘General Linear Model’ was utilized to find the adequate model for proportion of defects. It was assumed the defect proportion has the normal distribution. Since the assumptions were not satisfied by this method, it failed to identify the factors which affect the defect proportion.
Then the Generalized Linear Model was used by considering the gamma distribution. Initially full model was fitted for each defect type. The goodness-of-fit for generalized linear models can be characterized by the deviance value, which is formed as the logarithm of a ratio of likelihoods. The deviance for the full model was approximately zero and the deviance for all other models was positive. Hence the smaller the deviance, the better the model fit. The deviance was often used as a goodness-of-fit statistic for testing the adequacy of a fitted model.
After fitting a particular model, the importance of each factor in the model can be evaluated by the resultant increase in deviance when we remove that factor from the model. This increase can be compared with the appropriate F statistic to compute the p-value for this factor. If the p-value is less than 0.05, then the factor is significant at the 95% level.
www.ijsrp.org
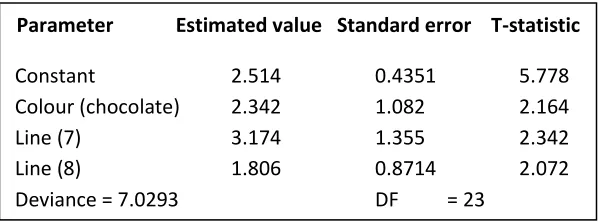
Table 1.4: Generalized Linear Model for proportion of Run Off Stitch
According to the Table 1.4, it is clear that the colour and line are factors that affect on occurrence of ‘Run Off Stitches’. The garments which are coloured Black, Cream and Pink mix had the same effect on occurrence of ‘Run Off Stitches’, while Chocolate colour garments had a different effect. The lines 2 and 3 had similar effect, while lines 7 and 8 had a different effect.
Table 1.5: Generalized Linear Model for proportion of Unbalanced Shape
[image:4.612.157.456.442.551.2]According to the Table 1.5, it is clear that the Line and Target are factors that affect in occurrence of unbalanced shape. The lines 2, 3 and 7 have similar effect while Line 8 has different effect.
Table 1.6: Generalized Linear Model for proportion of Wavy Seams
According to the Table 1.6, it is clear that the size, colour and target are factors that affect on occurrence of Wavy seams.
Solutions Provided
Through discussions with the managers and supervisors, following remedial actions were implemented for the each defect which is indicated in the Table 1.7.
Table 1.7: Defects and Remedial Actions
Defects Action
Run Off Stitches The stitches are extended than required and the operators are trained to control the speed of
the machine
Unbalanced The operators are trained to check for unevenness by using a sample garment
Parameter
Estimated value Standard error T-statistic
Constant
2.514
0.4351
5.778
Colour (chocolate)
2.342
1.082
2.164
Line (7)
3.174
1.355
2.342
Line (8)
1.806
0.8714
2.072
Deviance = 7.0293
DF
= 23
Parameter
Estimated value Standard error T-statistic
Constant
13.34
2.478
5.383
Line (8)
-20.6
7.485
-2.752
Target
-0.00654
0.00186 -3.516
Line (8).Target 0.03674
0.0453
2.401
Deviance = 8.5225
DF
= 23
Parameter
Estimated value Standard error T-statistic
Constant
3.354
2.325
1.442
Colour(chocolate) -3.403
0.9709 -3.505
Size(large)
2.626
1.233
2.129
Target
0.007461 0.002911
2.563
Size(large).Target -0.007467 0.002919 -2.558
www.ijsrp.org
Wavy Seam Operators are trained to handle large size garments in proper way
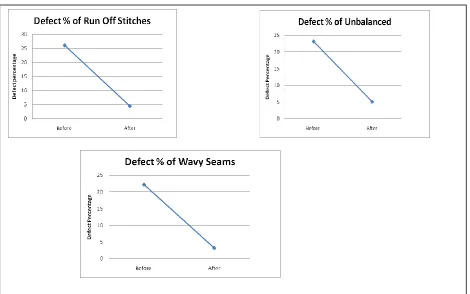
[image:5.612.73.543.111.405.2]After the remedial actions were taken, the garments were checked for defects. The results are indicated in Figure 1.3.
Figure 1.3: Defect Percentage each defect type Before & After Implementation
III. CONCLUSION
Good quality increases the value of a product or service, establishes the brand name and builds up good reputation for the garment exporter, which in return results in customer satisfaction, high sales and foreign exchange for the country. In this study there were three major defect types occurred in a garment. All the defect types had a very high percentage of occurring and that was more than the acceptable level of 5%. Using Generalized Linear Models, significant factors affected on the defect percentage had been found. Remedial actions had been discussed with the management to overcome these significant factors. After implementing the remedial actions, the defect percentage of each defect was decreased to an acceptable level.
IV. REFERENCES
[1] M. Islam,A.M.Khan, M.R.Khan, “Minimization of reworks in quality and productivity improvement in the Apparel Industry”, International Journal of Engineering and Applied Sciences, Vol.1, No.4,2013.
[2] Chethan Kumar C.S,N.V.R.Naidu,K.Ravindranath, “Performance improvement of manufacturing industry by reducing the Defectives using Six Sigma Methodologies”, IOSR Journal of Engineering, Vol.1, Issue 1, pp. 001-009.
[3] A.Senjuntichai, A.Pitthayakornpisuth, “Application of General Linear Model to the Reduction of Defectives in Packaging Process of Soap Industry”, Lecture Notes in Engineering and Computer Science, 2010.
[4] Sandeep Kanumuri, Pamela C. Cosman, Amy R. Reibman, “A Generalized Linear Model for MPEG-2 Packet-Loss Visibility”, Proceedings of the Packet Video Workshop,2004.
[5] Serpil KAYA, M. Ç. ERDOGAN, “The study of the effect of operations to defect rates in sewing”, www.iranpejohesh.com.
[6] Wayne Tincher, Wayne Daley and Wiley Holcombe, “Detection and removal of defects in Apparel Production”, Final Report, Defense Logistics Agency,1993.
[7] Kume, Hitoshi, “Statistical Methods for Quality Improvement”, The Association for Overseas Technical Scholarship (AOTS),1985. [8] Alexander M.Mood, Franklin A.Graybill, Duane C.Boes, “Indroduction to the theory of Statistics”, TATA McGraw-Hill, 2001,
www.ijsrp.org [9] B.M.S.G.Banneheka, “Generalized Linear Model”, Lecture Notes in Statistics, 2008.
[10] P. McCullagh and J. A. Nelder, . “Generalized Linear Models”, 2nd Edition, Chapman & Hall.
[11] Foster Jr., T., Howard, L., and Shannon, P., “The Role of Quality Tools In Improving Satisfaction with Government”, The Quality Management Journal, vol. 9, pp.20-31,2002.
[12] Kapuge, A.M. and M. Smith, “Management practices and performance reporting in the Sri Lankan apparel sector”, Management Audit Journal, vol. 22, no 3, pp 303- 318, 2007.
AUTHOR