and Accuracy of the Disk Diffusion Method for Antibiotic
Susceptibility Testing
Michael Hombach,aFlorian P. Maurer,aTamara Pfiffner,aErik C. Böttger,aReinhard Furrerb
Institut für Medizinische Mikrobiologie, Universität Zürich, Zürich, Switzerlanda
; Institut für Mathematik, Universität Zürich, Zürich, Switzerlandb
Parameters like zone reading, inoculum density, and plate streaking influence the precision and accuracy of disk diffusion antibiotic susceptibility testing (AST). While improved reading precision has been demonstrated using automated imaging systems, standardization of the inoculum and of plate streaking have not been systematically investigated yet. This study analyzed whether photometrically controlled inoculum preparation and/or automated inoculation could further improve the standardization of disk diffusion. Suspensions ofEscherichia coliATCC 25922 andStaphylococcus aureusATCC 29213 of 0.5 McFarland standard were prepared by 10 operators using both visual comparison to turbidity standards and a Densichek photometer (bioMérieux), and the resulting CFU counts were determined. Furthermore, eight experienced operators each inoc-ulated 10 Mueller-Hinton agar plates using a single 0.5 McFarland standard bacterial suspension ofE. coliATCC 25922 using regular cotton swabs, dry flocked swabs (Copan, Brescia, Italy), or an automated streaking device (BD-Kiestra, Drachten, Neth-erlands). The mean CFU counts obtained from 0.5 McFarland standardE. coliATCC 25922 suspensions were significantly differ-ent for suspensions prepared by eye and by Densichek (P<0.001). Preparation by eye resulted in counts that were closer to the CLSI/EUCAST target of 108CFU/ml than those resulting from Densichek preparation. No significant differences in the standard deviations of the CFU counts were observed. The interoperator differences in standard deviations when dry flocked swabs were used decreased significantly compared to the differences when regular cotton swabs were used, whereas the mean of the standard deviations of all operators together was not significantly altered. In contrast, automated streaking significantly reduced both interoperator differences, i.e., the individual standard deviations, compared to the standard deviations for the manual method, and the mean of the standard deviations of all operators together, i.e., total methodological variation.
T
he basic parameters of disk diffusion antibiotic susceptibilitytesting (AST), such as agar type, agar depth, incubation con-ditions, the reading endpoint, and the ideal inoculum density,
have been increasingly standardized in the past (1, 2). Current
CLSI and EUCAST recommendations offer detailed protocols for these basic aspects that provide a high level of
standardiza-tion (3,4). While improved reproducibility of zone diameter
reading has been demonstrated using software-guided imaging systems instead of visual reading by eye, other factors causing AST variation, such as inoculum preparation or agar plate streaking, both performed by human operators, are more
dif-ficult to standardize (5).
Systems for standardizing the inoculum for disk diffusion AST
have been evaluated previously (6,7). The results were reported to
be comparable but not superior to the standard method, i.e., vi-sual adjustment of the inoculum solution to 0.5 McFarland stan-dard turbidity. Systematic studies evaluating the impact of auto-mated agar plate streaking on the results of AST are, however, rare despite recent articles emphasizing the potential role of full labo-ratory automation for the standardization of diagnostic
microbi-ology (8–10).
AST methods are used to generate individual treatment recom-mendations (the AST report) for clinicians. Methodological vari-ation contributes to categorial errors and, thus, erroneous
treat-ment of patients (11,12). Therefore, further improvement in the
reproducibility and precision of disk diffusion AST will lead to more appropriate AST reports and related treatment recommen-dations.
Having shown recently that operator-dependent factors
con-tribute significantly to the zone diameter variation of disk diffu-sion AST results, we here evaluated whether photometrically con-trolled inoculum preparation, inoculation with flocked swabs, and automated inoculation of agar plates could further improve
the standardization of disk diffusion testing (13).
MATERIALS AND METHODS
Bacterial strains.Escherichia coliATCC 25922 andStaphylococcus aureus ATCC 29213 were used in this study. These strains represent the EUCAST and CLSI quality control (QC) strains for AST.
Susceptibility testing.Susceptibility testing was done by disk diffu-sion according to EUCAST recommendations (4). In brief, preparation of a 0.5 McFarland standard inoculum from overnight cultures was followed by incubation of Mueller-Hinton agar plates at 35°C in ambient air. All Mueller-Hinton agar plates were incubated in the fully automated Sirscan system, comprising an automated incubator and automated reading equipment. Incubation time was fixed to 16 h. Antibiotic disks (seeTable 2for the compounds tested) were obtained from i2a, Montpellier, France,
Received28 August 2015 Returned for modification26 September 2015 Accepted7 October 2015
Accepted manuscript posted online14 October 2015
CitationHombach M, Maurer FP, Pfiffner T, Böttger EC, Furrer R. 2015.
Standardization of operator-dependent variables affecting precision and accuracy of the disk diffusion method for antibiotic susceptibility testing. J Clin Microbiol 53:3864 –3869.doi:10.1128/JCM.02351-15.
Editor:N. A. Ledeboer
Address correspondence to Michael Hombach, [email protected].
Copyright © 2015, American Society for Microbiology. All Rights Reserved.
on May 16, 2020 by guest
http://jcm.asm.org/
and Mueller-Hinton agar was obtained from Becton Dickinson, Franklin Lakes, NJ. Inhibition zone diameters were recorded using the Sirweb/ Sirscan system (i2a) to standardize reading precision (5).
Operator influence on inoculum standardization.Suspensions ofE. coliATCC 25922 andS. aureusATCC 29213 of 0.5 McFarland standard turbidity were prepared by 10 experienced operators using colonies from overnight growth on Columbia sheep blood agar (bioMérieux, Marcy l’Etoile, France) by visual comparison of the test tubes to freshly prepared and vortexed 0.5 McFarland turbidity standards manufactured according to EUCAST guidelines and by using a calibrated Densichek instrument (bioMérieux) (4). To assist visual inoculum adjustment, bacterial suspen-sions were compared to McFarland standards against a white background with black lines (i.e., a Wickerham card) (14). All preparations and mea-surements were done in triplicate. Immediately after preparing the 0.5 McFarland standard bacterial suspensions using both methods, the absor-bance at 600 nm was measured using an Eppendorf BioPhotometer plus (Eppendorf AG, Hamburg, Germany). In addition, inoculum concentra-tions were determined by diluting bacterial suspensions 100,000-fold (100 l into 900l of a 0.85% NaCl solution five times) and subsequent plating of 100l of the final dilution onto Columbia sheep blood agar (bioMéri-eux) within 15 min from the initial preparation. Plates were incubated for 24 h at 35°C, and colonies were counted manually. The number of CFU per milliliter of bacterial suspension was calculated by multiplying colony counts by 106. The same lots of media and disks were used for the
exper-iments.
Operator influence on agar plate inoculation.A single 0.5 McFarland standard bacterial suspension was prepared from an overnight culture of E. coliATCC 25922 according to EUCAST recommendations (4). This suspension was split between 8 experienced operators, each of whom in-oculated 10 square Mueller-Hinton II agar plates (12 by 12 cm; Becton Dickinson) according to EUCAST recommendations using regular cotton swabs (Paul Hartmann AG, Heidenheim, Germany). Antibiotic disks were obtained from i2a and were applied to the agar within 15 min from streaking, the plates were incubated as recommended by EUCAST, and inhibition zone diameters were recorded as described above. This exper-iment was repeated twice, but instead of cotton swabs, the same operators either used regular, dry, flocked swabs (product number 519CS01; Copan, Brescia, Italy) or applied 50l of the bacterial suspension to the agar plates and used the InoqulA BT automated inoculation device (BD-Kiestra, Drachten, Netherlands) for spreading of the inoculum. The same lots of media and disks were used for the experiments.
Statistical calculations.Student’sttest was used to test for statistically significant differences in CFU counts obtained from 0.5 McFarland stan-dard bacterial suspensions prepared by eye using visual comparison to a reference solution and by the Densichek instrument. The Levene variance homogeneity test with the Brown-Forsythe modification (Levene/Brown-Forsythe test) for homogeneity was used to test for significant differences in individual operator standard deviations (SDs) on a 95% probability level (P⬍0.05 was considered significant). The Kolmogorov-Smirnov and Shapiro-Wilk tests were applied to test for normal distribution of measured values on a 95% probability level.
Software.All calculations were done using IBM SPSS statistics soft-ware, version 20 (IBM Corporation, Armonk, NY), and Microsoft Excel 2010 software (Microsoft Corporation, Redmond, WA).
RESULTS
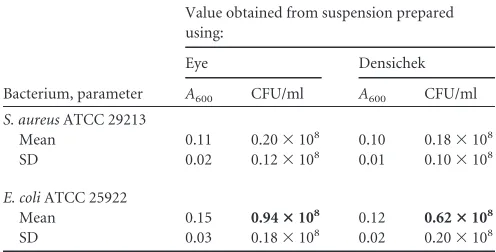
No difference was found between the mean CFU counts of S.
aureusATCC 29213 prepared by eye and using Densichek (P⫽
0.900) (Table 1). ForE. coliATCC 25922, the mean CFU counts⫾
standard deviations were (0.94⫾0.18)⫻108CFU/ml when
den-sity was adjusted by eye and (0.62⫾0.20)⫻108CFU/ml with the
Densichek instrument, a significant difference (P⬍0.001). As
EUCAST and CLSI recommend a general inoculum of 1⫻108
CFU/ml for disk diffusion AST in their current guidelines, prep-aration by eye achieved results that were closer to the target value
than those of preparation using Densichek (15,16). To what
ex-tent these differences will influence actual diameter values and clinical categorization, however, cannot be derived from the re-sults of this study.
No significant differences were observed between SDs of ab-sorbance values or CFU counts obtained from bacterial
suspen-sions ofE. coliATCC 25922 orS. aureusATCC 29213 adjusted to
0.5 McFarland standard by eye or by the Densichek instrument (using Levene’s test of equality of standard deviations for eye
ver-sus Densichek,P⫽0.371 andP⫽0.420 forE. coliandS. aureus,
respectively) (Table 1).
All mean inhibition zone diameters of repetitive
measure-ments forE. coliATCC 25922, with the exception of the results for
meropenem and manual streaking, were in the EUCAST quality control (QC) range irrespective of the inoculation method, i.e.,
cotton swabs, flocked swabs, or automated streaking (Table 2).
However, the percentages of individual measurements that were situated in the EUCAST QC range showed differences, increasing from 92.0% of average measurements in the QC range for manual streaking with cotton swabs to 93.3% for manual streaking with
flocked swabs and 98.1% for automated streaking (Table 2). The
average SD of measurements was lower (0.93 mm) for the auto-mated streaking instrument than for inoculation using cotton swabs (1.19 mm) and flocked swabs (1.11 mm).
Changes in inhibition zone diameter SDs were further ana-lyzed with respect to individual drug classes. The SDs generally decreased for both the flocked swab and automated streaking compared to those for cotton swabs. However, for the flocked swab, this effect was statistically significant only for beta-lactam inhibitor combinations (amoxicillin-clavulanic acid and pipera-cillin-tazobactam, SD decrease of 21.6%), whereas for the auto-mated streaking instrument, significant decreases of 12.5% to 33.9% were found for 6 of 9 drug classes (penicillins, beta-lactam inhibitor combinations, cephalosporins, aminoglycosides,
fluo-roquinolones, and colistin) (Table 3). No significant changes in
SDs were observed for the carbapenems (ertapenem, meropenem, and imipenem), tetracyclines (tetracycline and minocycline), or trimethoprim-sulfamethoxazole for either flocked swab or
auto-TABLE 1Comparison of absorbance values and CFU counts obtained from 0.5 McFarland standard bacterial suspensions prepared by visual comparison to a reference solution or using the Densichek instrumenta
Bacterium, parameter
Value obtained from suspension prepared using:
Eye Densichek
A600 CFU/ml A600 CFU/ml
S. aureusATCC 29213
Mean 0.11 0.20⫻108 0.10 0.18⫻108
SD 0.02 0.12⫻108 0.01 0.10⫻108
E. coliATCC 25922
Mean 0.15 0.94ⴛ108 0.12 0.62ⴛ108
SD 0.03 0.18⫻108 0.02 0.20⫻108
aLevene’s test of equality of standard deviations was applied to test for significant
differences in standard deviations of absorbance and CFU counts. The Mann-Whitney test was applied to test for differences in mean CFU counts.Pvalues equal to or smaller than 0.05 were considered statistically significant. Values that are significantly different are in boldface.
on May 16, 2020 by guest
http://jcm.asm.org/
[image:2.585.297.545.107.233.2]TABLE 2 Drug-specific mean measurements and standard deviations of inhibition zone diameters and percentages that are within EUCAST quality control ranges for E. coli ATCC 25922 Antibiotic EUCAST QC range (mm) Value (mm unless % is indicated) for measurements of inhibition zone diam obtained using: Cotton swab Flocked swab Automated streaking Range %o f measurements in range Mean SD Range %o f measurements in range Mean SD Range %o f measurements in range Mean SD Ampicillin 16–22 18–23 99 20.1 1.16 19–23 98 20.4 0.93 18–23 99 20.6 0.83 Amikacin 19–26 21–27 98 24.3 1.18 23–27 92 25.2 0.93 22–25 100 23.6 0.72 Amoxicillin-clavulanic acid 18–24 21–26 84 23.6 0.97 22–25 96 23.3 0.73 21–24 100 22 0.77 Cephalothin — a 18.8 1.42 18.3 1.33 18.9 1.1 Cefepime 31–37 30–37 99 33.3 1.37 30–37 99 33.9 1.16 31–37 100 33.4 1.23 Cefotaxime 25–31 25–31 100 28.7 1.22 26–31 100 28.6 0.86 26–29 100 27.6 0.75 Cefoxitin 23–29 25–29 100 27.2 0.9 25–29 100 27.2 0.91 25–28 100 26.8 0.84 Cefpodoxime 23–28 22–28 99 25.2 1.2 24–28 100 25.4 0.88 23–26 100 24.2 0.82 Ceftazidime 23–29 24–30 99 26.9 1.1 26–30 98 27.3 1.02 25–30 99 26.7 0.97 Ceftriaxone 29–35 28–35 98 31.1 1.42 28–35 100 31.3 1.33 28–33 100 30.5 1.15 Cefuroxime 20–26 22–26 100 24 0.97 22–26 100 23.9 0.88 21–25 100 22.9 0.67 Ciprofloxacin 30–40 30–38 100 35.1 1.7 34–40 100 38.4 1.7 33–38 100 36.1 1.02 Colistin — 15.7 0.72 15 0.71 14.9 0.63 Ertapenem 29–36 30–37 99 33 1.47 29–36 100 32.5 1.38 28–34 100 31.4 1.38 Gentamicin 19–26 22–27 99 24 1.14 23–27 98 24.6 0.87 22–26 100 23.9 0.67 Imipenem 26–32 29–37 54 33.3 1.41 28–34 85 30.9 1.47 26–35 84 30.9 1.85 Levofloxacin 29–37 30–36 100 33.3 1.26 32–40 80 36.1 1.54 32–37 100 33.9 1.01 Meropenem 28–34 32–38 41 35.6 1.29 30–36 89 33 1.2 30–34 100 31.9 1.07 Minocycline — 23.5 1.03 23.5 1.14 23.3 0.78 Nalidixic acid 22–28 25–31 64 28 1.38 25–31 55 28.2 1.41 25–30 79 27.7 0.96 Norfloxacin 28–35 30–36 99 32.4 1.36 31–39 70 34.8 1.72 31–35 100 32.5 0.83 Piperacillin-tazobactam 21–27 22–26 100 24.3 0.97 22–26 100 24.3 0.78 23–26 100 24.2 0.72 Tetracycline — 25.8 0.9 24.9 0.9 23.7 0.78 Tobramycin 18–26 20–24 100 22 0.95 21–25 100 23.3 0.92 20–24 100 22.3 0.77 Trimethoprim-sulfamethoxazole 23–29 24–29 100 25.6 1.16 24–29 100 26.6 1.14 24–29 100 26.5 1.04 Avg 92 27 1.19 93.3 27.2 1.11 98.1 26.4 0.93 a—, not available.
on May 16, 2020 by guest
http://jcm.asm.org/
mated streaking compared to the SDs for cotton swab inoculation (Table 3).
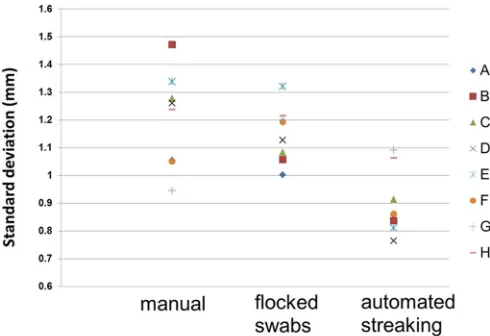
The range (i.e., heterogeneity) of standard deviations for indi-vidual operators decreased significantly with the flocked swab sys-tem compared to the range of SDs for cotton swabs (Levene/
Brown-Forsythe test for homogeneity,P⫽0.011). However, the
mean standard deviations for all operators were not significantly different when the flocked swab system and cotton swabs were
used (P⫽0.780). In contrast, using automated streaking, both the
range of individual operator standard deviations (P⫽0.033) (Fig.
1) and the mean standard deviation for all operators decreased
significantly compared to the individual ranges and overall means
of SDs for the manual methods (P⫽0.005).
DISCUSSION
Operator skills, e.g., with respect to inoculum preparation and plate inoculation, account for a significant part of the
method-ological variation in disk diffusion AST (13). Methodological
vari-ation influences the precision and reproducibility of measure-ments and, thus, affects the reliability of AST reports in terms of the predicted therapeutic success or failure of individual drugs. Even a 1-fold standard deviation of 1 mm to 1.5 mm can cause significant major and very major error rates, in particular for
problematic bacterial populations like extended-spectrum
-lac-tamase (ESBL)- or AmpC-positive isolates (12). In particular, for
settings with clinical breakpoints of species-drug combinations for which intermediate zones have been abandoned or with nar-row intermediate zones, the cumulated probabilities of major and
very major error rates can reach a critical level (11). In
conse-quence, further improvements regarding standardization of the disc diffusion method are desirable. We have shown in a previous work that highly standardized zone diameter readings can be
ob-tained using an automated zone reader (5). Hence, the impact of
reading imprecision on the total methodological variation of the disk diffusion method can be reduced to a negligible proportion. The highest relative contributions to methodological variation originate from operator influence (mainly plate inoculation, fol-lowed by inoculum preparation) and the quality of consumables,
such as agar plates and antibiotic disks (13). Standardization of
consumables for disk diffusion testing cannot be influenced by the laboratories but remains a responsibility of the manufacturers.
In the present study, we questioned, however, whether the op-erator influence on inoculum preparation and plate inoculation could be further standardized. Early studies indicated that bacte-rial growth that is not confluent but shows densely grouped colo-nies may be ideal for disk diffusion reproducibility. However, this approach would require different seeding densities for individual
species, e.g., 6,400 to 7,500 CFU/cm2forS. aureusor 1,700 CFU/
cm2 forE. coli (2). Therefore, Ericsson and Sherris decided to
recommend an inoculum of 1⫻108CFU/ml, which leads to
con-fluent growth for virtually all species (2). Both EUCAST and CLSI
have based their current guidelines on this recommendation (15,
16). To achieve confluent growth, preparation of a 0.5 McFarland
[image:4.585.38.546.78.201.2]standard bacterial suspension, preferably by using a photometric device, is recommended, although visual comparison with 0.5
TABLE 3Drug class-specific changes in standard deviations of inhibition zone diameter measurementsa
Parameter
SD of inhibition zone diam measurements (mm) or % change in SD for:
Penicillins
Inhibitor
combinations Cephalosporins Carbapenems Aminoglycosides Quinolones Tetracyclines
Trimethoprim-sulfamethoxazole Colistin SD using standard
manual methodb 1.16 0.97 1.2 1.39 1.09 1.42 0.96 1.16 0.72
Change in SD using flocked swabs
⫺0.23 ⫺0.21 ⫺0.15 ⫺0.04 ⫺0.18 0.17 0.06 ⫺0.02 ⫺0.01
% change using flocked
swabs ⫺
19.8 ⫺21.6 ⫺12.5 ⫺2.9 ⫺16.5 12.0 6.3 ⫺1.7 ⫺1.4
Change in SD using automated streaking ⫺
0.33 ⫺0.22 ⫺0.26 0.04 ⫺0.37 ⫺0.46 ⫺0.18 ⫺0.12 ⫺0.09
% change using
automated streaking ⫺
28.4 ⫺22.7 ⫺21.7 2.9 ⫺33.9 ⫺32.4 ⫺18.8 ⫺10.3 ⫺12.5
aInhibition zone diameter values for all drug classes showed normal distributions (Kolmogorov-Smirnov and Shapiro-Wilk tests,P⬍0.001). The Levene/Brown-Forsythe
test was applied to test for homogeneity of SDs.Pvalues equal to or smaller than 0.05 were considered statistically significant. SDs that are significantly different are in boldface.
b
The manual method using regular cotton swabs, representing the currently accepted standard, was the comparator method.
FIG 1Ranges of standard deviations for inhibition zone diameters from 10 inde-pendent replicate measurements by eight operators (A to H) for all drugs on average using the three inoculation methods. The Levene/Brown-Forsythe test for homogeneity was applied to test for significant differences in individual operator standard deviations.Pvalues equal to or smaller than 0.05 were considered statis-tically significant. The range (i.e., heterogeneity) of individual operator SDs signif-icantly decreased with the flocked swab method (P⫽0.011). The mean SD for all operators obtained using the flocked swab method was not significantly different from that obtained using the manual method (P⫽0.780). With the use of the automated streaking method, both the range of individual operator SDs (P⫽ 0.033) and the mean SD for all operators (P⫽0.005) significantly decreased com-pared to those obtained using the manual method.
on May 16, 2020 by guest
http://jcm.asm.org/
[image:4.585.40.285.443.611.2]McFarland standards is accepted and is still widely practiced (15,
16). It has to be noted that a 0.5 McFarland standard suspension
will result in 108CFU/ml forE. colibut not for other species, such
asS. aureus. In this study, inoculum preparation using a photo-metric device (the Densichek instrument) was not more accurate than inoculum preparation by visual comparison of the test tube to a 0.5 McFarland turbidity standard in front of a Wickerham
card, i.e., a white background with black lines (Table 1): the
non-photometric preparation resulted in a mean inoculum density of
0.94⫻108CFU/ml forE. coli, closer to the proposed EUCAST and
CLSI target value of 1.0⫻108CFU/ than the mean inoculum
density found for the photometrically adjusted suspension
(0.62⫻108CFU/ml) (Table 1). Furthermore, the variability in
CFU counts displayed no significant differences between the counts resulting from Densichek and from visual preparation
(Levene’s test of equality of standard deviations forE. coliandS.
aureusfor eye versus Densichek,P⫽0.371 andP⫽0.420,
respec-tively) (Table 1). Therefore, the contribution of inoculum
vari-ability to total methodological variation of the disk diffusion AST method could not be reduced by photometric measurements us-ing the Densicheck instrument.
Improvement of the plate inoculation procedure was achieved using both flocked swabs and automated streaking instead of reg-ular cotton swabs. Most importantly, following inoculation using either flocked swabs or automated streaking, the mean zone di-ameters for a broad panel of antibiotics all remained within the
EUCAST quality control ranges forE. coliATCC 25922 (Table 2).
The use of flocked swabs significantly decreased interoperator
het-erogeneity with respect to individual standard deviations (P⫽
0.011) but did not improve the mean of the standard deviations of
all operators (P⫽0.780). In contrast, agar plate inoculation using
automated streaking led to a significant decrease of both the in-teroperator heterogeneity with respect to individual standard
de-viations (P⫽0.005) and the mean of the standard deviations of all
operators (P⫽0.033) (Fig. 1). Regarding the SDs of individual
zone diameter measurements, the flocked swab inoculation method could significantly reduce the SD for only one of nine drugs belonging to different classes (SD reduction of 21.6% for
beta-lactam inhibitor combinations;P⬍0.05) (Table 3).
Auto-mated inoculation significantly reduced the SDs of individual zone diameter measurements for six of nine drugs compared to the SDs of measurements obtained using cotton swabs (SD reduc-tions of 12.5% to 33.9%). Furthermore, improved standardiza-tion when applying automated streaking was mirrored in higher numbers of individual measurements situated in the EUCAST QC range than were obtained with manual streaking (92.0%, 93.3%, and 98.1% of individual measurements in QC range for manual streaking, manual streaking with flocked swabs, and automated
streaking, respectively) (Table 2).
For this study, we used EUCAST QC ranges and methodolog-ical recommendations. However, the results may apply similarly to CLSI standards, as the CLSI recommendations concerning in-oculum preparation from overnight cultures, incubation condi-tions, agar plate inoculation, disk application, and incubation times are essentially the same.
A limitation of this study is the use of ATCC strains that depict an idealized model for variation studies. Clinical strains will, most likely, yield more variability. However, the advantage of such highly characterized strains is their comparability both for the
existing QC/variation ranges of EUCAST and CLSI and for inter-laboratory purposes.
To summarize, photometrically controlled preparation of bac-terial suspensions equal to 0.5 McFarland standard turbidity did not decrease variation in CFU counts, and therefore, photometri-cally controlled preparation using the Densicheck instrument did not decrease the contribution of inoculum preparation to the total methodological variation of the disk diffusion method. The use of flocked swabs for inoculation of disk diffusion agar plates can help to standardize AST results among a heterogeneously skilled group of operators in an individual clinical laboratory by signifi-cantly decreasing interoperator variations. However, the use of flocked swabs will not decrease the mean standard deviation of an individual clinical laboratory. The use of an automated agar plate streaking device has the potential to further standardize AST re-sults by decreasing the total methodological variation.
ACKNOWLEDGMENTS
We thank the team of the bacteriology laboratory for technical assistance, and we are much obliged to Forouhar Mouttet for proper statistical anal-yses.
This work was supported by the University of Zurich. All authors have no conflicts of interest to declare.
REFERENCES
1.Bauer AW, Kirby WM, Sherris JC, Turck M.1966. Antibiotic suscepti-bility testing by a standardized single disk method. Am J Clin Pathol45:
493– 496.
2.Ericsson HM, Sherris JC.1971. Antibiotic sensitivity testing. Report of an international collaborative study. Acta Pathol Microbiol Scand B Micro-biol Immunol217(Suppl 217):211⫹.
3.Clinical and Laboratory Standards Institute.2012. Performance stan-dards for antimicrobial susceptibility testing; approved standard, 11th ed. CLSI document M02-A11. CLSI, Wayne, PA.
4.European Committee on Antimicrobial Susceptibility Testing.2015. EUCAST disk diffusion method, version 5.0. http://www.eucast.org /fileadmin/src/media/PDFs/EUCAST_files/Disk_test_documents/Manual
_v_5.0_EUCAST_Disk_Test.pdf.
5.Hombach M, Zbinden R, Bottger EC. 2013. Standardisation of disk diffusion results for antibiotic susceptibility testing using the Sirscan au-tomated zone reader. BMC Microbiol13:225.http://dx.doi.org/10.1186
/1471-2180-13-225.
6.Baker CN, Thornsberry C, Hawkinson RW.1983. Inoculum standard-ization in antimicrobial susceptibility testing: evaluation of overnight agar cultures and the Rapid Inoculum Standardization System. J Clin Micro-biol17:450 – 457.
7.Korgenski EK, Daly JA.1998. Evaluation of the BIOMIC video reader system for determining interpretive categories of isolates on the basis of disk diffusion susceptibility results. J Clin Microbiol36:302–304. 8.Bourbeau PP, Ledeboer NA.2013. Automation in clinical microbiology.
J Clin Microbiol51:1658 –1665.http://dx.doi.org/10.1128/JCM.00301-13. 9.Greub G, Prod’hom G.2011. Automation in clinical bacteriology: what
system to choose? Clin Microbiol Infect17:655– 660.http://dx.doi.org/10
.1111/j.1469-0691.2011.03513.x.
10. Ledeboer NA, Dallas SD.2014. The automated clinical microbiology laboratory: fact or fantasy? J Clin Microbiol52:3140 –3146.http://dx.doi
.org/10.1128/JCM.00686-14.
11. Hombach M, Bottger EC, Roos M.2013. The critical influence of the intermediate category on interpretation errors in revised EUCAST and CLSI antimicrobial susceptibility testing guidelines. Clin Microbiol Infect
19:E59 –E71.http://dx.doi.org/10.1111/1469-0691.12090.
12. Maurer FP, Courvalin P, Bottger EC, Hombach M.2014. Integrating forecast probabilities in antibiograms: a way to guide antimicrobial pre-scriptions more reliably? J Clin Microbiol52:3674 –3684.http://dx.doi
.org/10.1128/JCM.01645-14.
13. Hombach M, Ochoa C, Maurer FP, Pfiffner T, Böttger EC, Furrer R.12 October 2015. Relative contribution of biological variation and technical
on May 16, 2020 by guest
http://jcm.asm.org/
variables to zone diameter variations of disk diffusion susceptibility test-ing. J Antimicrob Chemotherpii:dkv309.
14. European Committee on Antimicrobial Susceptibility Testing.2012. Reading guide: EUCAST disk diffusion method for antimicrobial sus-ceptibility testing, version 2.0. http://www.eucast.org/fileadmin/src /media/PDFs/EUCAST_files/Disk_test_documents/Reading_guide_v
_2.0_EUCAST_Disk_Test.pdf.
15. Clinical and Laboratory Standards Institute.2015. Performance stan-dards for antimicrobial susceptibility testing; 25th informational supple-ment. CLSI document M100-S25. CLSI, Wayne, PA.
16. European Committee on Antimicrobial Susceptibility Testing. 2015. Breakpoint tables for interpretation of MICs and zone diameters, version
5.0. http://www.eucast.org/fileadmin/src/media/PDFs/EUCAST_files
/Breakpoint_tables/v_5.0_Breakpoint_Table_01.pdf.