2019 International Conference on Artificial Intelligence and Computing Science (ICAICS 2019) ISBN: 978-1-60595-615-2
Nuclei Segmentation and Count in Breast Pathology Image
with Deep Learning
Chang-jiang ZHOU
1, Jie-jie XU
1Jin-ying ZHU
2,
Xiao-dong TENG
3and Jun LIAO
1,*1School of Science, China Pharmaceutical University, Nanjing 211198, China
2School of Basic Medicine and Clinical Pharmacy, China Pharmaceutical University,
Nanjing 211198, China
3Department of Pathology, the First Affiliated Hospital, College of Medicine, Zhejiang University,
Hangzhou 310003, China
*Corresponding author
Keywords: Segmentation, Pathology image, Deep learning.
Abstract. Nuclei quantitative analysis is significance in pathology image diagnosis such as Hematoxylin and eosin staining (H&E) slides and immunohistochemistry (IHC). In recent years, deep learning, in particular convolutional neural networks (CNN), have rapidly become a methodology of choice for nuclei segmentation. Training model requires datasets of images in which a vast number of nuclei have been annotated, however, there are few annotated IHC images. Here, we proposed a CNN model trained by publicly accessed annotated H&E images, and IHC slides can be tested after color deconvolution and normalization with color distribution of H&E image. Model showed better performance in nuclei segmentation than open source software with testing breast cancer H&E and IHC images from hospital. This result suggests the application potential of our new method for nuclei quantitative analysis, which is objective and efficient.
Introduction
Pathology image analysis services as a critical element of diagnosis in many areas of medicine, and especially in oncology. Hematoxylin and eosin staining (H&E) slides are common pathology images and with the new use of various antibodies and the emergence of more and more new antibodies, immunohistochemistry (IHC) has had a major impact on tumor diagnosis together with differential diagnosis, classification, prognosis, etc. [1]. For example, Ki-67 proliferation index is a valid and important biomarker to gauge neuroendocrine tumor (NET) cell progression within the gastrointestinal tract and pancreas [2]. However, the manual quantification and localization of the different subsets of cells containing a biomarker (in each IHC stained tissue) demands a large amount of time and effort. In addition, qualitative or semi-quantitative scoring systems suffer from low reproducibility, accuracy, and sensitivity, and decreased ability to distinguish the different stains apart when they overlap spatially.
Pathology, given its diversity and complexity, represents an excellent use case for application of deep learning strategies. Therefore, deep learning has made great throughout in pathology image analysis tasks, including subtype classification, mitosis detection, carcinoma localization [3], as well as nuclei segmentation. For example, Su et al. have applied a fast scanning deep convolutional neural network (fCNN) to pixel-wise region segmentation [4]. The fCNN removes the redundant computations in the original CNN without sacrificing its performance. High-quality pathologists-annotated pathology images are needed for training deep learning model. However, there are many H&E slides’ nuclei annotations whereas few IHC images’ annotations [5], while nuclei annotation is a labor-intensive and time-consuming task.
Materials and Methods
Dataset
The training dataset is a large publicly accessible dataset of H&E stained tissue images with more than 21,000 painstakingly annotated nuclear boundaries, whose quality was validated by a medical doctor [7]. It downloaded 30 whole slide images (WSIs) of digitized tissue samples of several organs from The Cancer Genomic Atlas (TCGA) and used only one WSI per patient to maximize nuclear appearance variation. Since computational requirements for processing WSIs are high, it cropped sub-images of size 1000 * 1000 from regions dense in nuclei, keeping only one such cropped image per WSI and patient. To further ensure richness of nuclear appearances, it covered seven different organs viz., breast, liver, kidney, prostate, bladder, colon and stomach, including both benign and diseased tissue samples.
We cropped 15 H&E and 15 Ki-67 IHC slides of breast cancer WSIs from 5 patients for testing set, which were provided by the First Affiliated Hospital, College of Medicine, Zhejiang University. The size of sub-image was 1000*1000.
Preprocessing
For a pathological slide captured at 40x magnification, we cropped ten sub-images of size 1000*1000 from cancerous regions randomly. Considering the diversity of stained images, we employed histogram color normalization to reduce difference. In this study, the best stained image selected by pathologist was used as model to normalize other images.
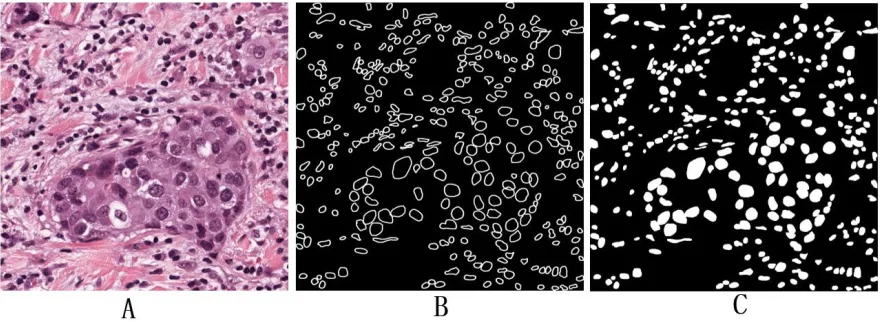
[image:2.612.94.535.415.576.2]The literature shows that in the nucleus segmentation of the pathological slides, for each pixel, it is better to convert it into 3 classifications (intracellular, cell border, extracellular) than to 2 (intracellular, extracellular) [7]. It has been observed that a 50*50 patch can contain the largest nuclei, so the pathological slide is processed into a 51*51 patch, and the patch category is labeled with the center pixel. The processing results are shown in Fig. 1.
Figure 1. Pathological slides training set processing.
IHC Slides Deconvolution
For IHC, the size of a whole-slide image can reach 1 gigabyte and both its width and height can reach 100000 pixels. While in clinical diagnosis, only the strongest positive region has the value for quantitative analysis, so we can’t crop images randomly in IHC.
There are several techniques available in the literature to realize stain colors separation. As the most widely used method in the digital pathology domain, Ruifrok et al. developed an un-mixing algorithm to un-mix the RGB image with up to three stains in the converted optical density space. Given the reference color vectors ∈ of the pure stains, the method assumes that each pixel of the color mixture a ∈ is a linear combination of the pure stain colors [8].
In the case of three channels, the color system can be described as a matrix of the form:
Every row represents a specific stain, and every column represents the optical density (OD) by the red, green and blue channel for each stain. The length of the vector will be proportional to the amount of stain, while the relative values of the vector describe the actual OD for the detection channels.
Then we did an orthonormal transformation of the RGB information to get independent information about each stain’s contribution. Before that, the transformation has to be normalized to achieve correct balancing of the absorption factor for each separate stain. We normalize the data as following:
̂ = , = 1,2,3 (1)
We got a normalized OD matrix M. If C is the 3 by 1 vector for amounts of the three stains at a particular pixel, then the vector of OD levels detected at that pixel is
Y = CM (2) From the above it is clear that
C = [ ] (3) This means, that multiplication of the OD image with the inverse of the OD matrix results in orthogonal representation of the stains forming the image. Then we can make the corresponding stain separation image according to the vector C.
With the algorithm above, we un-mixed the IHC images and selected 3 slides with the strongest positive of size 1000*1000 in each IHC for our study.
For the most positively expressed fragments, the algorithm above is still used for stain un-mixing. One retains only the positive nuclei while another retains all nuclei. Both IHC images are color normalized by standard H&E images, by this way, we can segment IHC nuclei by model trained by H&E images.
Convolutional Neural Network Framework
Based on the VGG which secured the 2nd place with 7.3% test error using an ensemble of 7 models in the classification task of ILSVRC-2014 challenge, we did some adjustments to make the model suitable for the specific application of pathological slides nucleus segmentation. The architecture of VGG is shown as Table 1 and it starts a stochastic gradient descent (SGD) at a learning rate of 0.001. We chose cross-entropy as loss function:
Table 1. The architecture of CNN.
Layer Filter size Padding Activation Pool Output size
Input - - - 51*51*3
Conv1 4*4 VALID Relu - 48*48*32
Conv2 3*3 SAME Relu 2*2/Max 24*24*32
Conv3 3*3 SAME Relu 24*24*64
Conv4 3*3 SAME Relu 2*2/Max 12*12*64
Conv5 3*3 SAME Relu 12*12*128
Conv6 3*3 SAME Relu 2*2/Max 6*6*128
Conv7 3*3 SAME Relu 6*6*256
Conv8 3*3 SAME Relu 2*2/Max 3*3*256
FC1 - - Relu 256
FC2 - - Rule 256
Output - - Softmax 3
While in testing, each patch was precited into three classes: intracellular, cell border, extracellular, presenting in different colors, then the result can be visualized.
Results
CNN-based nuclei segmentation model was tested by 12 annotated H&E slides from publicly accessible dataset, and it reached 0.837 of the accuracy. Additionally, we used an open source software Cell Profiler for comparison. Cell Profiler is a python-based software with several suggested pipelines for computational pathology [9]. F1-score is another commonly used object detection metric. As a result, the F1 score of CNN is 0.7328, while the Cell Profiler is 0.4046.
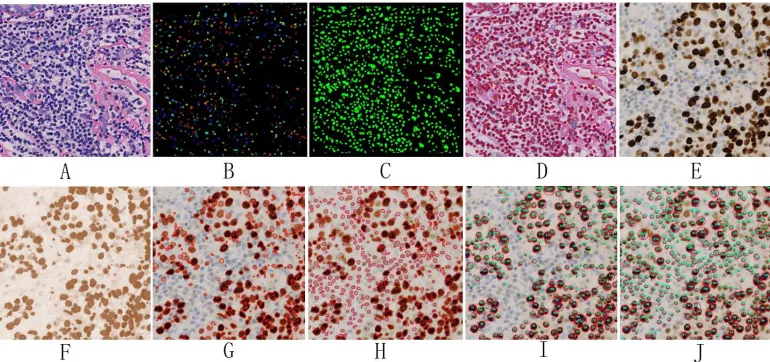
[image:4.612.113.498.479.660.2]After that, 15 H&E slides from hospital were tested, and the visualizing result is shown in Fig. 2. 2A is the original pathological image, 2B is the segmentation result of Cell Profiler, 2C is the segmentation result of our model, and 2D is the result of combining the model prediction with the original image.
Figure 2. The segmentation results of pathological slides.
can easily get IHC score by these two counts, which is significant while the pathologists only estimate approximately in clinical diagnosis.
In terms of contours of the segmentation, as Fig. 4 shows, the contours segmented by our proposed method are generally elliptical and conform to the shape of the cells. However, the software segmentation is mostly irregular and there are many nuclear contours connected together, which is difficult to count. Therefore, it proves that our method performs much better than Cell Profiler in nucleus segmentation. Although the training data was from publicly published dataset, our method still yielded the same result in the pathological slides from The First Affiliated Hospital of Zhejiang University. In addition, our model can be used to the IHC images without any tuning. Both above show that our proposed method is robust.
However, there are still some limits. Annotating is a time-consuming task so that our training set only contains publicly publishing dataset of H&E slides. Consequently, the performance on H&E is better than IHC images segmentation. We plan to further add more annotations of IHC images for our method to make fine tuning. And it will be more accurate on IHC images.
Summary
In this study, open-core learning data of H&E images was used to conduct deep learning model training, and a pathological slice intelligent segmentation counting model was obtained. The accuracy and robustness of were verified by the pathology images from hospital. In addition, for IHC images, the model also had a good segmentation effect and can count the proportion of positive cells. We hope deep learning will contribute to the development of nuclear morphometry and computational pathology software for research and clinical use. Such tools can be used in computational pathology for more effective treatment planning by allowing basic diagnosis, disease subtype identification, triaging, and predicting treatment outcome.
Acknowledgement
This research was supported by ‘Double First-Class’ University project (NO. CPU2018GY19) and High Performance Computing Center, China Pharmaceutical University.
References
[1] K.A. Matkowskyj, S. Mantey, S. Dan, R.T. Jensen, A.V. Danilkovich, and R.V. Benya, Quantitative immunohistochemistry (Q-IHC) by measuring cumulative signal strength can be used to determine GRP receptor number on archived tissues, Gastroenterology, vol. 118, no. 4, pp. A560-A560, 2000.
[2] X. Fuyong, S. Hai, N. Janna, and Y. Lin, Automatic Ki-67 counting using robust cell detection and online dictionary learning, IEEE Transactions on Biomedical Engineering,vol. 61, no. 3, p. 859, 2014.
[3] B.E. Bejnordi et al., Diagnostic assessment of deep learning algorithms for detection of lymph node metastases in women with breast cancer, Jama,vol. 318, no. 22, pp. 2199-2210, 2017.
[4] S. Hai, F. Liu, Y. Xie, F. Xing, S. Meyyappan, and Y. Lin, Region segmentation in histopathological breast cancer images using deep convolutional neural network, IEEE International Symposium on Biomedical Imaging, 2015.
[5] G. Litjens et al., 1399 H&E-stained sentinel lymph node sections of breast cancer patients: the CAMELYON dataset, Gigascience, vol. 7, no. 6, 2018.
[7] N. Kumar, R. Verma, S. Sharma, S. Bhargava, A. Vahadane, and A. Sethi, A Dataset and a Technique for Generalized Nuclear Segmentation for Computational Pathology, IEEE Trans Med Imaging,vol. 36, no. 7, pp. 1550-1560, Jul 2017.
[8] A.C. Ruifrok and D.A. Johnston, Quantification of histochemical staining by color deconvolution, (in eng), Anal Quant Cytol Histol,vol. 23, no. 4, pp. 291-9, Aug 2001.