LAYER SEGMENTATION AND DETECTION OF GA AND
DRUSEN FROM SD-OCT IMAGES
1MOHANDASS G, 2R ANANDA NATARAJAN
1Research Scholar, Sathyabama University, Chennai. 2
Supervisor, Pondicherry Engineering College, India
E-mail: [email protected]
ABSTRACT
A variety of literatures have been developed to solve the problem of retinal SD-OCT images segmentation which is a significant stage in an automatic diagnosis system. Various methods proposed in the literature have met with only limited success due to overlapping intensity distributions of retinal areas. In order to achieve this objective, we have proposed a novel technique to segment three layers, and detection of geographic atrophy (GA) and drusen. Here, we have proposed a new RELD (Region Enlarging Layer Detection) model for three layers segmentation. For detection, some statistical features are extracted and neural network is trained based on the feature to detect two pathologies like, GA and drusen. Then, scaled conjugate based neural network is used for geographic atrophy (GA) and drusen detection. The proposed technique is analyzed with the help of sensitivity, specificity and the accuracy. Finally, in the performance evaluation, the proposed technique is achieved better accuracy 96.92% when compared existing technique 76.21.
Keywords: Geographic Atrophy (GA), Drusen, layers, segmentation, RELD model
1. INTRODUCTION
Segmentation analysis is an intense field of research and development in the background of biomedical imaging analysis and computer-assisted diagnosis [1]. The majority difficult part of medical image analysis is the automated localization and delineation of structures of interest. Automated data evaluation is one way of enhancing the clinical utility of measurements. In particular, medical image segmentation extracts meaningful information and facilitates the display of this information in a clinically relevant way. A crucial role for automated information extraction in medical imaging usually involves the segmentation of regions of the image in order to quantify volumes and areas of interest of biological tissues for further diagnosis and localization of pathologies [2].
In recent years, Age-related Macular Degeneration (AMD) [17] is a leading cause of irreversible blindness in medical field [3]. There are many unanswered questions regarding the pathogenesis of AMD, which can be investigated in longitudinal studies using in vivo, high-resolution, cross-sectional imaging rather than colour fundus photographs. The non-invasive, cross-sectional
view of the retina from spectral domain optical coherence tomography (SD-OCT) imaging has been used to characterize the vitreoretinal interface, retina, RPE, and drusen complexes in the presence of AMD [4-6]. A general segmentation framework based on graph theory and dynamic programming was used to segment three retinal boundaries in SD-OCT images of eyes with drusen and geographic atrophy (GA). For quantitative AMD studies, segmentation of the retina into layers and measurement of drusen volume are crucial. However, manual segmentation is time and labor-intensive, limiting its use in large-scale studies. Researchers have therefore turned toward automatic segmentation techniques to process clinical data more efficiently [7].
boundaries or uniform layer structure. Intensity threshold based algorithms utilize simple analysis along the depth scan’s intensity profiles or find borders by investigating intensity gradients and are frequently confused by missing data, which leads to non-physiologic results [9-16]. In addition to the complexities associated with developing fully automatic segmentation algorithms, uncertainties over the true boundary locations of evolving pathologic structures in retinal SD-OCT images pose yet another challenge. Reaching a consensus on these boundaries is often not a trivial task [7].
In this paper, we have developed an efficient technique to segment three layers, and detection of geographic atrophy (GA) and drusen. The proposed technique is comprised into two modules: (i) Three layers segmentation (ii) GA and Drusen detection. In first module, the input SD-OCT images are firstly pre-processed using imadjust function. Then, RELD model is used for three layer segmentation; three layers are inner limiting membrane (ILM), inner aspect of the RPEDC, and Choroid layer. Then, GA and Drusen detection is done by scaled conjugate gradient neural network.
The rest of the paper is organized as follows: Section 2 explains contribution of proposed technique. A brief review of some of the literature works in retinal layers identification is presented in Section 3. The proposed retinal layer segmentation technique is detailed in Section 4. The experimental results and performance evaluation discussion is provided in Section 5. Finally, the conclusions are summed up in Section 6.
2. CONTRIBUTION OF PROPOSED TECHNIQUE
• Ultimate aim of the proposed technique is three layers segmentation as like inner limiting membrane (ILM), inner aspect of the RPEDC, and Choroid layer. This segmentation is done using a novel Region Enlarging Layer Detection (RELD) model.
• Geographic atrophy (GA) and drusen classification is done using scaled conjugate gradient neural network.
3. RELATED RESEARCHERS: A BRIEF REVIEW
Lots of researches have been performed for the segmentation of SD-OCT images. Some of the recent related works regarding the segmentation of SD-OCT images are reviewed in the following section.
B. Remeseiro, N et al. [19] have develpoed a top-down methodology to detect circular diffuse spot with a maximum diameter of 125µm, using techniques such as template matching and region growing. The proposed methodology consisted of five stages. The first stage involved the acquisition of the retinal image. The second stage entailed the extraction of the green channel of the colour image. In the third stage, the search area was restricted to the inside of the ETDRS (Early Treatment Diabetic Retinophaty Study) protocol grille. The fourth stage tries to localize the areas of the image which were suspected of being drusen using the template matching technique. Finally, the suspect areas were segmented using the region growing technique and filtered to rule out false lesions. The proposed system was integrated into a screening system to prevent the AMD.
Giovanni Gregori et al. [20] have presented that drusen measurement obtained using SD-OCT may be a uniquely useful clinical tool for assessing the natural history of drusen and disease progression. To measure drusen area and volume in eyes with non-exudative age-related macular degeneration (AMD) using spectral domain optical coherence tomography imaging (SD-OCT). Patients with drusen secondary to non-exudative AMD were enrolled in this study. Five separate SD-OCT scans, each consisting of 40 000 uniformly spaced A-scans organized as 200 A-A-scans in each B-scan and 200 horizontal B-scans, were performed on each eye. Each scan covered a retinal area of 6×6 mm centered on the fovea. An algorithm was used to quantitatively assess drusen area and volume. Measurements from the entire scans, as well as in regions contained within 3- and 5-mm circles centered on the fovea, were analyzed. Test-retest standard deviations of drusen area and volume measurements were calculated for each eye.
visualization of complex spatial relationships that may aid our understanding of retinal pathology.
Yogesh Kumar A. and Sasikala M [22] have presented a method for automated segmentation of the spectral domain OCT images together with a general approach for retinal abnormality diagnosis. Ten intraretinal layers were first automatically segmented into five surfaces and features were extracted in each surface locally to characterize texture properties across the macula. Abnormalities were then detected when the feature value of any subject was deviated from the preset normal range. This approach was applied to determine fluid-filled regions- SEADs (Symptomatic Exudate-Associated Derangements) in patients with macular edema, choroidal neovascularisation (CNV) and central venous occlusion.
Zhihong Hu et al. [23] have presented two approaches for the segmentation of retinal vessels in SD-OCT volumes that each takes advantage of complimentary information from fundus photographs. In the first approach, vessels were first segmented on the fundus photograph directly (using a k-NN pixel classifier) and this vessel segmentation result was mapped to the SD-OCT volume through the registration of the fundus photograph to the SD-OCT volume. In the second approach, after fundus-to-SD-OCT registration, vessels were simultaneously segmented with a k-NN classifier using features from both modalities. Three-dimensional structural information from the intra-retinal layers and neural canal opening obtained through graph-theoretic segmentation approaches of the SD-OCT volume are used in combination with Gaussian filter banks and Gabor wavelets to generate the features. The approach was trained on 15 and tested on 19 randomly chosen independent image pairs of SD-OCT volumes and fundus images from 34 subjects with glaucoma.
Stephanie J et al. [7] have developed a fully automatic algorithm to segment three retinal boundaries with a performance comparable to that of manual graders. They used a general segmentation framework based on graph theory and dynamic programming to segment three retinal boundaries in SD-OCT images of eyes with drusen and geographic atrophy (GA). A validation study for eyes with nonneovascular AMD was conducted, forming subgroups based on scan quality and presence of GA. To test for accuracy, the layer thickness results from two certified graders were compared against automatic segmentation results for 220 B-scans across 20 patients.
4. A TECHNIQUE OF THREE LAYER SEGMENTATION AND DISEASE CLASSIFICATION
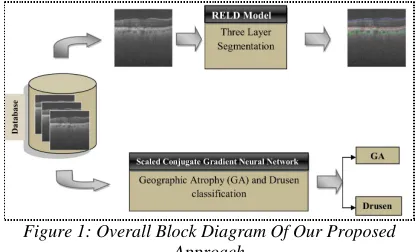
[image:3.612.313.521.329.455.2]Fast, accurate objective detection and quantification of imaging biomarkers are crucial for the study and diagnosis of ophthalmic diseases. Due to the time consuming and subjective nature of manual segmentation, considerable work has been done in recent years to automate the segmentation of ocular structures. For example, many layer segmentation algorithms have been developed to delineate the retinal [24-29], choroid-scleral [30, 31], and corneal layers [32, 33] on optical coherence tomography (OCT) images [34]. The above literatures have met with only limited success due to overlapping intensity distributions of retinal areas. In order to achieve this objective, we have proposed a novel technique to detect three layers and classify of GA and drusen.
Figure 1: Overall Block Diagram Of Our Proposed Approach
Proposed technique consists of two modules
Three layer segmentation using RELD model
GA and Drusen detection using scaled conjugate Gradient Neural network
4.1 Three Layers Segmentation Using Reld Model
4.1.1 Pre-Processing
Initially, the input SD-OCT images are pre-processed so as to make the image fit for further processing. Through pre-processing the noise is reduced and image is enhanced. Here, imadjust method for image enhancement. Also, imadjust creates an adjust image intensity value in a separate figure that is associated with the grayscale image in the current figure, called the target image.
)
(I
imadjust
J
=
4.1.2 Three Layers Segmentation
In the medical field, layer segmentation of SD-OCT images has a significant application. The primary task in SD-OCT layer segmentation is that it creates different categories of layers like inner limiting membrane (ILM), inner aspect of the RPEDC, and Choroid layer, etc. The layer segmentation of SD-OCT image is a serious problem because it is useful for a number of functions such as diagnosis, surgical planning, and monitoring treatment in biomedical applications. Here, we have used a novel Region Enlarging Layer detection (RELD) model to detect three layers as like inner limiting membrane (ILM), inner aspect of the RPEDC, and Choroid layer. Here, the following sequences of steps are utilized to do the layer segmentation.
(i) Seed point selection for each grid
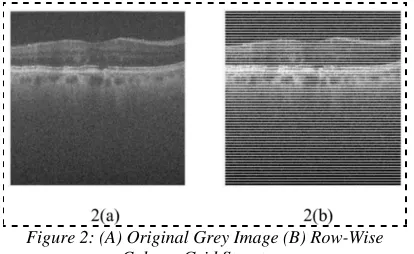
Grid structure generation: The input
retina image is firstly divided into row-wise column grid structure. Because, the three layers are normally row wise column structure, so we have made this format. The grid structure is depicted in figure 2. In gridding structure, grids are usually rectangular shape and the grid number to which the original image is considered as a variable. Gridding results in smaller rectangular grids so that analysis can be carried out easily. In this technique each of the grids is treated separately to which the RELD model is applied.
Figure 2: (A) Original Grey Image (B) Row-Wise Column Grid Structure
Seed point selection: The initial step in
layer region identification for the grid formed is to select a seed point for the grid. The initial region enlarging begins as the exact location of the seed. So, we have carried out histogram analysis to find out the seed point of each grid. The histogram analysis is plotted based on the each pixel’s intensity range (0-255). From the histogram plot, we have selected maximum intensity based (x, y) co-ordinates positions. The above process is applied for each grids, finally we obtain some seed points
for every grid. In the layer region segmentation, the neighbouring pixels of initial "seed points” and determines whether the pixel neighbours should be added to the region or not, based on certain conditions.
After seed point selection of each grids, begins region enlarging process. The region enlarging process starts with two constrains, such as original grey image and orientation image. These two steps with layers identification processes are detailed below.
(ii) RELD Model for Original Image
In grey image constrain, the neighbouring pixels of initial "seed points” and determines whether the pixel neighbours should be added to the region or not, based on certain conditions. This constrain of the threshold is check whether the entire neighbour image and satisfies that condition. The intensity of the threshold is maximum value of the neighbour image consideration. Suppose the image is having
the intensity value
I
I, and the neighbouring image intensity valueI
NI and the intensity of thethreshold values
T
IN , and threshold condition isgiven by
IN NI
I
I
T
I
−
≤
,This condition satisfied the intensity constrain is met. In this threshold condition check whether all pixels of rows and columns, if the condition satisfied the image is constrain.
(iii)RELD Model for Gradient image:
The gradient is a vector field that point is used to the direction of the image, that is X and Y direction. The gradients in X and Y axes are found out for “orientation “constraint. Here, IXI and IYI are to be the image value after applying gradient in X and Y axis. The intensity range of SD-OCT image is from 0 to 255 and the gradient is taking from that values. In a gradient the images are placed on X and Y direction. Finally, the gradient constrain value is taken from the combine the X and Y matrix (X, Y). The gradient matrix denoted g is given by
(
2 2)
11
YI XI I
I g
+ + =
Using in this formula, we can find the orientation for each of the pixels. Suppose the image is having the orientation value
O
I and the orientation of theneighbouring image
O
NIvalue the orientation of [image:4.612.92.299.455.582.2]NI
I
O
O
−
≤
T
ORThis condition is applied for every SD-OCT image of rows and columns, which some of the images are satisfied these condition, that images are constrained for orientation.
(iv)Identification of three layers
The above two threshold criterion (original and gradient) is satisfied then, corresponding images are segmented. Then, the layers detection is included following steps:
White pixels removal: Firstly, the white pixels
count
P
c is taken from every segmented image andone threshold condition is applied. Suppose the white pixels count
WP
c and thresholdT
candthreshold condition is given by
c
c
WP
T
>
This condition is applied for every segmented images, in which, some segmented images are satisfied and remaining segmenented images (non-satisfied) are removed.
Duplicate image removal: Then, pixel based
[image:5.612.313.532.303.384.2]similarity matching is applied for every image. Finally we obtain three images, which are includes inner limiting membrane (ILM), inner aspect of the RPEDC, and Choroid layer and these images includes some unwanted regions shown in figure 3.
Figure 3: After Duplicate Image Removal Process
Sharpening using Morphological operation
[image:5.612.93.298.447.523.2]After converting to binary image, the morphological process is applied for sharpening the regions and filling the gaps. The main process of the morphological operators is Opening, Closing, Erosion and Dilation that remove the hurdle and small holes from the image. The morphological operator used in the proposed approach is dilation. Output image of dilation process is depicted in figure 4.
Figure 4: After Morphological Dilation Process
Three layers edge’s identification using canny edge detection: After dilation process, three layer’s
edges are identified using canny edge detection. Canny edge detection is a powerful edge detection method and it uses two different thresholds (to weak and strong edges) and includes the weak edges in the output only if they are connected to strong edges. Output images of three layer’s edges are depicted in figure 5.
Figure 5: Three Layer’s Edges Identification Using Canny Edge Detection Process
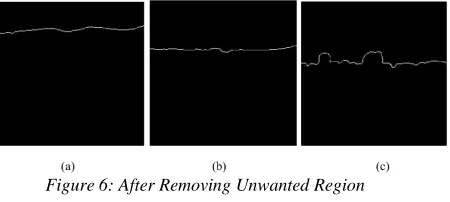
Removing unwanted regions using region props mat lab function: After applying dilation operation,
the unwanted small segments like holes and other noises are still presented in the image. In order to remove it, area of all the unwanted segments will be identified using region props mat lab trivial function. Here, through region props function given mat lab, the area is found out, and then it is filled with white pixels. Three layers regions are segmented in figure 6.
Figure 6: After Removing Unwanted Region
First layer identification: When applying region
props mat lab trivial function, we obtain inner limiting membrane (ILM) layer.
Second layer identification: After first layer
[image:5.612.315.540.542.643.2]removed, then, we obtain inner aspect of the RPEDC layer.
Third layer identification: Here, maximum
x-coordinates values are removed, then we obtain Choroid layer. The three layers are identified and marked in figure 9 and 11.
4.2 Ga and Drusen Detection Using Scaled Conjugate Gradient Neural Network
In this module, classification of SD-OCT images into Geographic atrophy (GA) and drusen has been discussed. We have utilized two processes for this purpose, (i) Feature extraction (ii) classification
(i) Feature extraction
This section gives details on the features which are extracted using the segmented region features, entropy features. The extracted features are also done feature selection process before giving it for training in the neural network. Here, two features entropy (f1) and layer’s pixel counts (f2) are taken for feature extraction purpose.
Entropy: Entropy is a statistical measure of
randomness that can be used to characterize the texture of the input image and is given by
∑
∑
= − = j j j j f f T f f T p where p p Pβ ( , )
) , ( log 2 1 2 1 1
Where,pj contains the histogram counts
returned from image histogram.
(ii) Classification
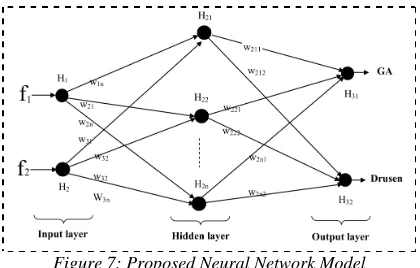
We have used neural network for the classification task. Scaled Conjugate Gradient Neural Networks provide a powerful tool that help doctors to analyze, model and make sense of complex clinical data across a broad range of applications. Neural Network is a multilayered structure having an input layer, an output layer, and a few hidden layers. In hidden layers and output layers, each layer consists of computing elements known as neurons which compute a weighted sum of the inputs and then does a nonlinear transform on the sum. Neurons belonging to different layers are connected through adaptive weights. The number of hidden layers and the number of neurons in each layer depend on the application and we have used 3 input layers and 20 hidden layers. The proposed neural network model is presented in figure 7.
We make use of scaled conjugate gradient algorithm based Neural Network. SCG is training algorithm and second order Conjugate Gradient algorithms that help minimize goal functions of several variables. In order to train neural networks, the gradient G of the loss function is computed with
respect to each weight
w
ijof the network. It showsthe fact that small change in that weight will affect the overall error
E
r. Initially, loss function is divided into separate terms for each pointq
in the training data.∑
∑
= − = k q k q k q r p q rr E E T Y
E ( )
2 1 ,
Where,
T
kqis the target value, q kY
is the output value. ‘k
’ range over the output units of the network.Let
−∆ = T E
p exp r be a vector from the
[image:6.612.313.523.417.551.2]space,
E
ris the error. The algorithm terminates once sufficiently when it is near to the minimum of the error function, where G = 0 and then the algorithm has converged.Figure 7: Proposed Neural Network Model
GA and an overlying small spot of hyper-reflectivity.
5. RESULT AND DISCUSSION
The results obtained for the proposed layer segmentation and GA & drusen detection technique is discussed in this section. The experimental set up and the evaluation metrics used are given in section 5.1. Section 5.2 is described dataset description. The experimental results obtained are plotted in section 5.3 and performance analysis is made in section 5.4.
5.1 Experimental Set Up and Evaluation Metrics
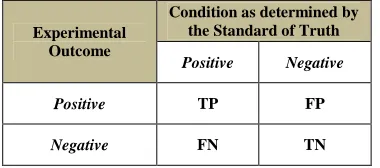
The proposed technique is performed in a windows machine having configurations Intel (R) Core i5 processor, 3.20 GHz, 4 GB RAM, and the operation system platform is Microsoft Wnidow7 Professional. We have used mat lab latest version (7.12) for this proposed technique. The evaluation metrics used to evaluate the proposed technique sensitivity, specificity and accuracy [35]. In order to find these metrics, we first compute some of the terms like, True positive (TP), True negative (TN), False negative (FN) and False positive (FP) based on the definitions given in table 1.
Table 1: Able Defining The Terms Tp, Fp, Fn, And Tn
Experimental Outcome
Condition as determined by the Standard of Truth
Positive Negative
Positive TP FP
Negative FN TN
Sensitivity is the proportion of true positives that
are correctly identified by a diagnostic test. It shows how good the test is at detecting a disease.
Specificity is the proportion of the true negatives
correctly identified by a diagnostic test. It suggests how good the test is at identifying normal (negative) condition. Accuracy is the proportion of true results, either true positive or true negative, in a population. It measures the degree of veracity of a diagnostic test on a condition. These can be expressed in the terms of TP, FP, FN and TN by:
FN) TP/(TP y
Sensitivit = +
FP) TN/(TN y
Specificit = +
FP) FN TP TP)/(TN TN
(
Accuracy = + + + +
5.2. Dataset Description
For our proposed method, we have considered rectangular volumes with nonneovascular AMD
[image:7.612.312.530.178.299.2]under the A2A SD-OCT study, which was registered at clinicaltrials.gov and approved by the institutional review boards (IRBs) of the four A2A SD-OCT clinics (Devers Eye Institute, Duke Eye Center, Emory Eye Center, and the National Eye Institute). The sample SD-OCT images are shown in figure 8.
Figure 8: Sample High And Low Quality SD-OCT Images With Drusen And GA
[image:7.612.312.522.411.572.2] [image:7.612.101.291.421.505.2]For each patient across all sites, 0° and 90° rectangular volumes centered at the fovea with 1000 A-scans and 100 B-scans were captured for one eye. The scan sizes and the axial, lateral, and azimuthal resolutions varied slightly by site, and are specified in Table 2.
Table 2: Study Dataset Resolution
Study site Devers Duke Emory NEI
Axial FWHM resolution in retina,
m
µ
4.54 4.38 4.56 4.56Axial pixel resolution
in retina,
µ
m
/pixel 3.21 3.23 3.06 3.24Lateral pixel resolution,
m
µ
/pixel6.60 6.54 6.58 6.50
Azimuthal pixel resolution,
m
µ
/pixel68.2 67.0 69.8 65.0
Scan width, mm 6.60 6.54 6.58 6.50
Scan Length, mm 6.82 6.70 6.98 6.50
scan artifacts arising from the imaging system; (7) tilt, clipping, or blank frames; and (8) ungradable. We used these existing scores in our study to classify the volumes as high quality, low quality, or excluded from the study based on the criteria in Table 3.
Table 3: Validation Study Volume Selection Criteria
Group 1
Group 2
Group 3
Group 4
Patients,
n
5 5 5 5Volumes per
patient,
n
2 1 1 1Total volumes,
n
10 5 5 5pathology Drusen Drusen Drusen Drusen
Volume
quality High Low High Low
Scan direction
(00/900) Both Either Either Either
5.2 Experimental Results
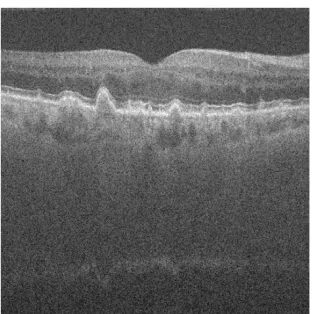
[image:8.612.333.501.285.643.2]The experimental results obtained for the proposed technique are given in this section. Figure 9 and 11 gives original SD-OCT images, figure 10 and 12 gives segmented three layers such as inner limiting membrane (ILM), inner aspect of the RPEDC, and Choroid layer.
Figure 9: Original SD-OCT Image
Figure 10: Marked Three Layers (Inner Limiting Membrane (ILM), Inner Aspect Of The RPEDC, And
Choroid Layer)
Figure 11: Original SD-OCT Image
Figure 12: Marked Three Layers (Inner Limiting Membrane (ILM), Inner Aspect Of The RPEDC, And
Choroid Layer)
5.3 Performance Analysis
[image:8.612.117.273.404.561.2]effectiveness of classification. The performance is evaluated by the use of evaluation metrics of sensitivity, specificity and accuracy. We also compare to existing technique to prove the validity of the method.
Effectiveness of segmentation technique
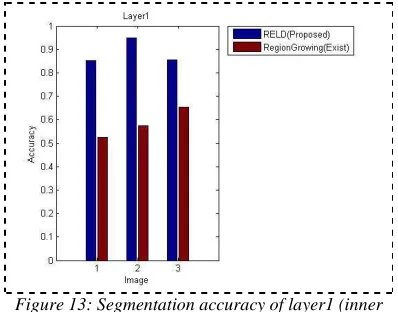
From the figures, we can see that our proposed technique have performed well by obtaining good evaluation metric values. Here, we have detailed results obtained for three layers (inner limiting membrane (ILM), inner aspect of the RPEDC, and Choroid layer) are drawn as graph shown in figure 13 to figure 15. In layer 1 (figure 13), we can see that our proposed technique have outperformed existing method by having better accuracy value of
94.75% when compared existing methods 58% for
second image. In layer 2 (figure 14), we can see that our proposed technique have outperformed existing method by having better accuracy value of
87.89% when compared existing methods 57% for
[image:9.612.316.521.52.421.2]third image. In layer 3 (figure 14), we can see that our proposed technique have outperformed existing method by having better accuracy value of 96.92% when compared existing methods 76.21% for first image. Totally, our proposed layer segmentation result is better result is better when compared with existing technique.
Figure 13: Segmentation accuracy of layer1 (inner limiting membrane (ILM))
Figure 14: Segmentation accuracy of Layer 2 (inner aspect of the RPEDC)
Figure 15: Segmentation accuracy of layer 3 (Choroid layer)
Effectiveness of classification technique
[image:9.612.95.294.438.594.2]Figure 16: Classification effectiveness of proposed technique
6. CONCLUSION
In this paper, we have proposed an efficient technique to segment three layers, and detection of geographic atrophy (GA) and drusen. Here, we have proposed a new Region Enlarging model for three layer segmentation. For detection, some statistical features are extracted and neural network is trained based on the feature to detect two pathologies like, GA and drusen. Then, scaled conjugate neural network is used for geographic atrophy (GA) and drusen detection. Finally, in the performance evaluation, the proposed segmentation technique is achieved better accuracy (96.92%) when compared existing technique (76.21%).
REFERENCE
[1] Thomas M. Lehmann, and Jorg Bredno, "Strategies to Configure Image Analysis Algorithms for Clinical Usage, "J Am Med Inform Assoc, Vol.12, No.5, pp.497-504. Sep-Oct 2005.
[2] A Review of Algorithms for Segmentation of Retinal Image Data Using Optical Coherence Tomography Computer and Information Science, Artificial Intelligence, “Image Segmentation", book edited by Pei-Gee Ho, April 19, 2011.
[3] Bressler NM,” Age-related macular degeneration is the leading cause of blindness,” JAMA, Vol.291, pp.1900-1901, 2004.
[4] Khanifar AA, Koreishi AF, Izatt JA, Toth CA,” Drusen ultra structure imaging with spectral domain optical coherence tomography in
age-related macular degeneration,
”Ophthalmology,Vol.115,pp.1883-1890,2008.
[5] Jain N, Farsiu S, Khanifar AA, et al. Quantitative comparison of drusen segmented on SD-OCT versus drusen delineated on color fundus photographs. Invest Ophthalmol Vis Sci.; vol.51, pp.4875-4883, 2010.
[6] Schuman SG, Koreishi AF, Farsiu S, Jung SH, Izatt JA, Toth CA.Photoreceptor layer thinning over drusen in eyes with age-related macular degeneration imaged in vivo with
spectral-domain optical coherence
tomography.Ophthalmology,Vol.116,pp.488-496,2009.
[7] Stephanie J. Chiu,Joseph A. Izatt,Rachelle V. O’Connell,Katrina P. Winter,Cynthia A. Toth and Sina Farsiu, "Validated Automatic Segmentation of AMD Pathology Including Drusen and Geographic Atrophy in SD-OCT Images, "Investigative Ophthalmology & Visual Science, Vol. 53, No. 1, January 2012.
[8] V Kajic, M Esmaeelpour, B Povazay, "Automated choroidal segmentation of 1060 nm OCT in healthy and pathologic eyes using a statistical model, “Biomedical Optics, 2012 [9] Cabrera Fernández D, Salinas H. M., Puliafito C.
A, “Automated detection of retinal layer structures on optical coherence tomography images,” Opt. Express, Vol.13, No.25, pp.10200-10216, 2005.
[10] Mishra A. K., Fieguth P. W., Clausi D. A., “Decoupled active contour (DAC) for boundary detection,” IEEE Trans. Pattern Anal. Mach. Intell.Vol.33, No.2, pp.310-324, 2011.
[11] Molnár J., Chetverikov D., Cabrera DeBuc D., Gao W., Somfai G., “Layer extraction in rodent retinal images acquired by optical coherence tomography,” Mach. Vis. Appl. 2011.
[12] Mujat M., Chan R., Cense B., Park B., Joo C., Akkin T., Chen T., de Boer J., “Retinal nerve fiber layer thickness map determined from optical coherence tomography images,” Opt. Express,Vol.13,No.23,pp. 9480-9491,2005. [13] Sarunic M. V., Yazdanpanah A., Gibson E., Xu
J., Bai Y., Lee S., Saragovi H. U., Beg M. F., “Longitudinal study of retinal degeneration in a rat using spectral domain optical coherence tomography,” Opt. Express,Vol.18,No.22, pp.23435-23441,2010.
[15] Mayer M. A., Hornegger J., Mardin C. Y., Tornow R. P., “Retinal Nerve Fiber Layer Segmentation on FD-OCT Scans of Normal Subjects and Glaucoma Patients,” Biomed. Opt. Express, Vol.1, No.5, pp.1358-1383, 2010. [16] F. Rossant, I. Ghorbel, I. Bloch, M. Paques, and
S. Tick, “Automated segmentation of retinal layers in OCT imaging and derived ophthalmic measures,” in IEEE International Symposium on Biomedical Imaging: from Nano to Macro, pp. 1370-1373, 2009.
[17] Age-Related Macular Degeneration (AMD),
National Eye Institute,
http://www.nei.nih.gov/health/maculardegen/in dex.asp
[18] B. Remeseiro, N. Barreira, D. Calvo, M. Ortega, and M.G. Penedo,"Automatic Drusen Detection from Digital Retinal Images: AMD Prevention,"EUROCAST 2009, LNCS 5717, pp. 187-194, 2009.
[19] B. Remeseiro, N. Barreira, D. Calvo, M. Ortega, and M.G. Penedo,"Automatic Drusen Detection from Digital Retinal Images: AMD Prevention, "EUROCAST 2009, LNCS 5717, pp. 187-194, 2009.
[20] Giovanni Gregori, Fenghua Wang, Philip J. Rosenfeld, Zohar Yehoshua,Ninel Z. Gregori, Brandon J. Lujan, MD, Carmen A. Puliafito, MD, MBA, William J. Feuer, MS, "Spectral Domain Optical Coherence Tomography Imaging of Drusen in Non-exudative Age-Related Macular Degeneration, “American Academy of Ophthalmology,2011.
[21] Grant D. Aaker, BA; Luis Gracia, PhD; Jane S. Myung, MD; Vanessa Borcherding, BA; Jason R. Banfelder, MchE; Donald J. D’Amico, MD; Szilárd Kiss, MD, ”Volumetric Three-Dimensional Reconstruction and Segmentation of Spectral-Domain OCT,” Ophthalmic Surgery, Lasers and Imaging,Vol.42,No.4, July/August 2011.
[22] Yogesh Kumar A., Sasikala M,"Texture Analysis of Retinal Layers in Spectral Domain OCT Images,"International Journal of Emerging Technology and Advanced Engineering, Volume 2, No.12, December 2012.
[23] Zhihong Hu ,Niemeijer, M.; Abramoff, M.D.; Garvin, M.K. ,"Multimodal Retinal Vessel Segmentation From Spectral-Domain Optical Coherence Tomography and Fundus Photography ,"IEEE Transactions on Medical Imaging, Vol.31,No.10,pp.1900-1911,2012. [24] A. Yazdanpanah, G. Hamarneh, B. R. Smith,
and M. V. Sarunic, “Segmentation of
intra-retinal layers from optical coherence tomography images using an active contour approach,” IEEE Trans. Med. Imaging ,Vol.30,No.2,pp. 484-496,2011.
[25] K. A. Vermeer, J. van der Schoot, H. G. Lemij, and J. F. de Boer, “Automated segmentation by pixel classification of retinal layers in ophthalmic OCT images,” Biomed. Opt. Express, Vol.2, No.6, pp.1743-1756, 2011. [26] Y. Y. Liu, M. Chen, H. Ishikawa, G. Wollstein,
J. S. Schuman, and J. M. Rehg, “Automated macular pathology diagnosis in retinal OCT images using multi-scale spatial pyramid and local binary patterns in texture and shape encoding,” Med. Image Anal.Vol.15,No.5,pp. 748-759,2011.
[27] Q. Yang, C. A. Reisman, K. Chan, R. Ramachandran, A. Raza, and D. C. Hood, “Automated segmentation of outer retinal layers in macular OCT images of patients with retinitis pigmentosa,” Biomed. Opt. Express, Vol.2, No.9, pp.2493-2503, 2011.
[28] S. J. Chiu, J. A. Izatt, R. V. O’Connell, K. P. Winter, C. A. Toth, and S. Farsiu, “Validated automatic segmentation of AMD pathology including drusen and geographic atrophy in SD-OCT images,” Invest. Ophthalmol. Vis. Sci. Vol.53, No.1, pp.53-61, 2012.
[29] S. J.Chiu, X. T. Li, P. Nicholas, C. A. Toth, J. A. Izatt, and S. Farsiu, “Automatic segmentation of seven retinal layers in SDOCT images congruent with expert manual
segmentation,” Opt.
Express,Vol.18,No.18,pp.19413-19428,2010. [30] V. Kajić, M. Esmaeelpour, B. Považay, D.
Marshall, P. L. Rosin, and W. Drexler, “Automated choroidal segmentation of 1060 nm OCT in healthy and pathologic eyes using a statistical model,” Biomed. Opt. Express, Vol.3, No.1, pp.86-103, 2012.
[31] L. Duan, M. Yamanari, and Y. Yasuno, “Automated phase retardation oriented segmentation of chorioscleral interface by polarization sensitive optical coherence tomography,” Opt. Express, Vol.20, No.3, pp.3353-3366, 2012.
[32] J. Eichel, A. Mishra, P. Fieguth, D. Clausi, and K. Bizheva, “A novel algorithm for extraction of the layers of the cornea,” in Canadian Conference on Computer and Robot Vision, pp. 313-320,2009. CRV '09 (IEEE, 2009).
boundaries in SDOCT images using graph theory and dynamic programming,” Biomed. Opt. Express, Vol.2, No.6, pp.1524-1538, 2011. [34] D. Huang, E.A. Swanson, C. P. Lin, J. S.
Schuman, W. G. Stinson, W. Chang, M. R. Hee, T. Flotte, K. Gregory, C. A. Puliafito, and J. G. Fujimoto, “Optical coherence tomography,” Science ,Vol.254,No.5035, pp.1178-1181,1991. [35] Wen Zhu, Nancy Zeng, Ning Wang,