ISSN: 1992-8645 www.jatit.org E-ISSN: 1817-3195
DETERMINING THE ECG 1 CYCLE WAVE
USING DISCRETE DATA
SABAR SETIAWIDAYAT1,3, M. RASJAD INDRA2, DJANGGAN SARGOWO2,
SETYAWAN SAKTI2
1
Medical Faculty of Brawijaya University of Malang, East Java, Indonesia
2
Medical Faculty of Brawijaya University of Malang, East Java, Indonesia
3
Engineering Faculty, of Widyagama University of Malang, East Java, Indonesia
E-mail : [email protected], [email protected]
ABSTRACT
The objective of this article is to present the recording results of the ECG examination intended to obtain the wave of each cycle. A method to represent each cycle duration of the wave from the discrete data ECG record has been made. The duration from R-peak to R-peak is used as a period of each cycle. The retreat time shift of the half HR is the last wave from the previous cycle. The discrete data from the MIT-BIH and the results of the measurement itself are used as the data to obtain the number of the cycle in the ECG record, the R position of each cycle, the duration of each cycle and the heart rate value.
Keyword : Cycle Duration ,Count Of Cycle, Discrete Data, ECG
1. INTRODUCTION
The result of the Electrocardiograph examination of each patient is usually represented in the form of the wave in the monitor screen or is directly printed in a piece of paper special for Electrocardiogram (ECG). The background of the vertical and horizontal lines in the monitor or in the paper is used as an aid to count the wave using a mV unit for the amplitude and a ms unit for the duration [7,5]. A accurate examination of many cycles is needed in order to know the morphology and to determine the heart rate, while the examination of a cycle is required to understand the peak, the segment and the interval of the PQRST values. In a record of the ECG result, the duration of each period may be counted from the peak to peak distance [2,8,9], the beginning and the ending points of a cycle is difficult to obtain, however. A cycle is a time period needed to extend the impulses from the Sino Atrial node to the Purkinje fibre, and and returning to Sino Atrial node and so on [7]. It is on the basis of the information from each cycle that various heart diseases such as coronary, miocard infarct, hiperthropy, fibrillation, ischemia, arrhythmia, tachicardia, etc may be diagnosed [15]. Other researchers working on the discrete ECG data among others are Alfredo IM & Qinghua Z,(Proceedings of the 29th annual International Conference of the IEEE EMBS, France, 2007) concluding that the QRS in a cycle may be detected using statistics. The difference with the present research is that it is intended to divide the results of
the ECG examination in the discrete form into its cycles.
Remembering the importance of the information on waves in each cycle, it is necessary to know how to determine each of the cycle from the result of the ECG wave, where the wave of each cycle is required to obtain the accuracy of the values of the PQRST peak, heart rate or the wave trajectory length in each cycle. This may be reached if in each examination of the patient, the ECG wave represented is taken into account, and also the sampling process using a certain frequency is also made. The sampling process will produce discrete data which are the amplitudes as the time function [2, 12]. The stored discrete data enable the ECG data to be printed or represented either in the monitor or in a piece of paper. Moreover, the discrete data may be copied, sent to other concerned persons, or processed using another software.
On the basis of the description above, this article is intended to determine the ECG components such as the waves, the intervals and the segments.
2. ECG WAVES
ISSN: 1992-8645 www.jatit.org E-ISSN: 1817-3195 cycle, impulses are emitted through the channel
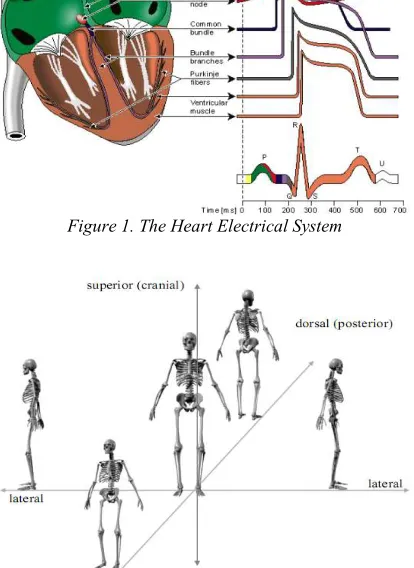
from the internodus atrium, AV node, bunder of HIS to the Purkinje fibre [15]. A heart functions as a pump to channel the blood from the heart to the lungs (pulmonal) or from the heart to all parts of the body (perifer) [15]. Figure 1 presents the heart electrical system. A normal heart shows 60-100 beats per minute called heart rate (HR). If the HR is under 60, it is called Bradicardia and above it, Tachicardia [15].
[image:2.612.314.522.75.359.2]If a doctor examines a patient’s heart using an Electrocardiograph, he will get an ECG wave represented in the monitor or at the paper special for the ECG. This wave is the representation of a part of the heart from the lateral, inferior, septal and anterior sides [15]. Figure 1 presents the heart electrical system, Figure 2, the side of a heart examined and Figure 3 shows the result of the heart examination using an electrocardiograph 12-lead.
Figure 1. The Heart Electrical System
[image:2.612.93.294.328.486.2]Figure 2. The Heart Sides Examined Using ECG
Figure 3. The Results of the Heart Examination Using the ECG 12-lead
On the base of the wave presentation in Figure 1, the examiners (cardiologist or the ECG expert) will be able to diagnose the patient’s heart condition. The examination starts from the whole wave presentation to the peak amplitude of a cycle. The number of cycles in general will be determined by counting the number of the peak amplitude of the R wave at the lead II and I [1, 3, 5].
3. DISCRETE DATA
[image:2.612.92.299.372.656.2] [image:2.612.96.296.509.663.2]ISSN: 1992-8645 www.jatit.org E-ISSN: 1817-3195
Figure 4. Analog, discrete and digital signals
4. METHOD
In this paper, a method to determine the number of cycles in an ECG record and the duration of a wave in a cycle is proposed. In this research, a quantitative approach was employed.
1. Determining the number of the ECG cycle
[image:3.612.293.522.62.290.2] [image:3.612.320.515.383.534.2]The number of cycles in general is determined by counting the number of R-peaks [3,14]. In the file of the ECG discrete data, a series of the amplitude number as a time function is shown. The amplitude shows the spread of impulses in the muscles (mV), while the time function is a sampling period (ms) [4, 6, 8]. One period is one cycle, namely the time needed to complete one wave cycle. One period may be obtained by measuring the time needed to pass from one R-peak to another R-peak [5,9]. The Algorithm to determine the number of cycle is as follows:
1. The number of R-peaks at the lead II or lead I discrete data is determined by choosing the R >1mV amplitude
2. If there is a group of numbers > 1mV, in each group the maximal value is chosen. 3. In each group, there is one value, the peak
R value.
4. The maximal values and also the proper n position is ordered, where n is the sampling order. The number of the maximal values is the number of cycles in the file.
2. Determining 1 cycle
One cycle is determined based on the n number or the duration between one R peak to another. If Dx is the duration between the Rn peak to the Rn + 1 peak, the end cycle (ec) is the ending cycle, and the start cycle is the starting cycle, ec=Peak Rn – 0.5Dx and sc=ec-Dx
The determination of the start cycle and the end cycle is presented at Figure 5.
Figure 5. Determination Of The Start And End Of A Cycle
Figure 6 shows a flowchart of a patient’s data recording and monitoring using discrete data. If the recording is chosen, the result of the examination will be represented and stored in the discrete file, but if the ECG monitoring is preferred, the result will be merely represented without being stored.
Figure 6. A Flowchart Of A Patient’s Discrete Data Recording
5. RESULT
The finding of this research showed the duration of the wave in each cycle and the value of peak R in each cycle. The duration of the wave in each cycle (dx) results in the beginning and the ending positions from each cycle wave.
ISSN: 1992-8645 www.jatit.org E-ISSN: 1817-3195 Hz. The results of running the program
[image:4.612.87.314.106.642.2] [image:4.612.90.300.248.513.2]Electrocardiogram discrete (ECGd) to determine the number of cycle ECG for 6 seconds for lead II from the data record 16265 are shown at Figure 6 and the order of the cycle is shown at Table 1. For the data record 102, it is shown at Figure 7 and the order of the cycle at Table 2. The data from the researcher’s measurement is Masda-01 with the sampling of 250 Hz. The result of running for the data lead II from the Masda-01 data record is shown at Figure 8 and the order of the cycle at Table 3.
Figure 6. The Presentation Of The Lead II For Data 16265 For 6 Seconds
Figure 7. The Presentation Of The Lead II Data 102 For 6 Seconds
Figure 8. The Presentation Of The Lead II Data Masda-01 For 6 Seconds
Table 1. The Position Of The Peak R And N In Each Cycle Data 16265
Peak R (mV) N position Cycle
2.635 43 1
2.675 125 2
2.755 206 3
2.855 287 4
2.735 366 5
2.855 446 6
2.955 525 7
2.175 605 8
2.725 683 9
2.775 761 10
Table 2. Position Of The Peak R And N In Each Cycle For Data 102
Peak R (mV) n position Cycle
2.438 13 1
2.575 194 2
2.575 377 3
2.513 585 4
2.598 749 5
2.428 933 6
2.418 1119 7
2.627 1308 8
[image:4.612.346.514.378.472.2]2.775 1516 9
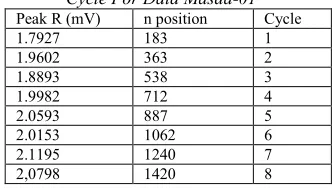
Table 3. Position Of The Peak R And N In Each Cycle For Data Masda-01
Peak R (mV) n position Cycle
1.7927 183 1
1.9602 363 2
1.8893 538 3
1.9982 712 4
2.0593 887 5
2.0153 1062 6
2.1195 1240 7
2,0798 1420 8
ISSN: 1992-8645 www.jatit.org E-ISSN: 1817-3195 Table 4. The Determination Of The Limit Of 1 Cycle
Lead II For Data 16265
Cycle Rn Rn1 Dx sc Ec
1 43 125 82 2 84
2 125 206 81 85 166
3 206 287 81 166 247
4 287 366 79 248 327
5 366 446 80 326 406
6 446 525 79 407 486
7 525 605 80 485 565
8 605 683 78 566 644
9 683 761 78 644 722
Figure 8. Extraction Of The Wave Of 1 Cycle Lead II Data 16265 In Duration For 6 Seconds
Table 5. Determination Of The Limit Of 1 Cycle Lead II For Data 102
cycle Rn Rn1 Dx sc ec
1 13 194 181 78 104
2 194 377 183 103 286
3 377 585 208 273 481
4 585 749 164 503 667
5 749 933 184 657 841
6 933 119 186 840 1026
7 119 1308 189 1025 1214
8 1308 1516 208 1204 1412
Figure 9. Extraction Of The Wave Of 1 Cycle Lead II Data 102 In Duration For 6 Seconds
Table 6. Determination Of The Limit Of 1 Cycle Lead II For Data Masda-01
cycle Rn Rn1 Dx sc Ec
1 183 363 180 93 273
2 363 538 175 276 451
3 538 712 174 451 625
4 712 887 175 625 799
5 887 1062 175 799 974
6 1062 1240 178 973 1151
ISSN: 1992-8645 www.jatit.org E-ISSN: 1817-3195
Figure 10. Extraction Of Wave Of 1 Cycle Lead II For Data Masda-01 In Duration For 6 Seconds
The sampling process with the frequency of 125Hz will possess step n with the duration of 8 ms, while the sampling with the frequency of 250 Hz will have step n with the duration of 4 ms [4, 13, 15]. Therefore, the duration of 1 cycle for the data 16265, 102 and masda-01 is shown at Table 7, Table 8, and Table 9, respectively.
Table 7. Duration Of Each Cycle For Data 16265
Cycle Dx Duration (second)
1 164 0.656
2 162 0.648
3 162 0.648
4 158 0.632
5 160 0.640
6 158 0.632
7 160 0.640
8 156 0.624
9 156 0.624
Average duration 0.638
Table 8. Duration Of Each Cycle Of The Data 102
Cycle Dx Duration (second)
1 181 0.724
2 183 0.732
3 208 0.832
4 164 0.656
5 184 0.736
6 186 0.744
7 189 0.756
8 208 0.832
Average duration 0.751
Table 9. Duration Of Each Cycle O For Data Masda-01
Cycle Dx Duration (second)
1 180 0.720
2 175 0.700
3 174 0.696
4 175 0.700
5 175 0.700
6 178 0.712
7 180 0.720
Average duration 0.707
On the basis of the average duration at Table 7, Table 8 and Table 9, the numbers of cycle for one minute for data 16265, 102 and data masda-01 for one minute are 94.01 bpm, 79.84 bpm dan 84.88 bpm, respectively. The numbers are the heart rate based on the number of cycles.
6. CONCLUSION
ISSN: 1992-8645 www.jatit.org E-ISSN: 1817-3195 record that may be presented or printed any time.
The Software designed in this present research may easily know each R peak and the number of cycles in the results of the ECG record, extract the duration for each cycle, or understand the heart rate. In this research, there are some differences in the values of the heart rate between the basis of the number of the R peak and of the cycles.
7. ACKNOWLEDGEMENT
This article is a part of the Dissertation made by the writer. This research was funded by DP2M Dirjen Dikti for the scheme of the Penelitian Hibah Bersaing (PHB) with the title “Designing Computer-based Electrocardiogram 12-lead”, in accordance with the Dirlitabmas’s decision no. 0481/E5.1/ PE/2015 dated on March 10, 2015.
REFERENCES
[1] Ali Zifan, et.all, 2005. Automated ECG segmentation using Pecewise derivative dynamic time warping, International Journal of Biological and life Science 1:3 2005. [2] Alfredo IM, Qinghua Z, 2007. An Algorthm for
QRS onset and offset detection in single lead electrocardiogram records. Proceeding of the 29th annual International Conference of the IEEE EMBS, Lyon-France.
[3] Andreas S, et.all, 1998. Analysis of beat to beat variability of frequency contents in the Electrocardiogram using two-dimensional Fourier Transforms. IEEE transactions on Biomedical Engineering, vol.45, No.2, February 1998
[4] Ashish Birle, Suyog Malviya, Deepak Mittal, 2015. A novel technique of R-peak detection for ECG signal analysis : variable threshold method. International Journal of Advanced Research in Electronics and Communication Engineering (IJARECE), vol.4, issue 5, May 2015
[5] David Prutchi, Michael Norris. 2005. Design and Development of Medical Electronic Instrument. A John Wiley & Sons, Inc., Publication
[6] Deboleena S and Madhuchhanda M, 2012. R-peak detection algorithm for ECG using double difference and RR interval processing. SciVerse ScienceDirect Elsevier, Procedia Technology 4 (2012) 873-877
[7] FU Huwez, PW Macfarlane, 2003. Assesment of selected ECG voltage criteria for abnormality in Eccentric and Concentric left ventricular hypertrophy. IEEE Computer in Cardiology, 2003;30:57-59
[8] Guyton. Arthur & Hall.E , 2008, Textbook of Medical Physiology, 11th edition, Elsevier, Singapore
[9] Hussain A Jaber AL, Ziarjawey and Cankaya, 2015. Heart rate monitoring and PQRST detection based on graphical user interface with Matlab. International Journal of Information and Electronics Engineering, vol.5, No.4, July 2015
[10] Jiapu Pan and Willis J.Tompkins, 1985. A real-time QRS detection Algorithm. IEEE Transactions on Biomedical Engineering, vol.BME-32, No.3, Marc 1985
[11] Kamalapriya M and Renulakshmi R, 2012.
Electrrocardiogram signal analysis using zoom FFT. IEEE Biosignal and biorobotics conference (BRC), 2012
[12] Mohammad Rakibul Islam, et.all, 2015.
Arrhythmia detection technique using basic ECG parameters. International journal of Computer Applications (0975-8887) vol.119, No.10,June 2015
[13] PA Otubu, For the Realisation of the design of Electrocardiogram for the Monitoring of the Physiology of Human Heart, Journal of Engineering and Applied Sciences 3(11):856-860, 2008. ISSN:1816-949X,@Medwell Journals, 2008
[14] Rashid GA, Mohammad AT, 2015. ECG
based detection of left ventricular
hypertrophy using higher order statistics. IEEE 2015 23rd Iranian Conference on Electrical Engineering (ICEE)
[15] Ramesh Kumar S, The Deterministic Chaos in Heart Rate Variability signal and analysis
Techniques, International Journal of
Computer Applications (0975-8887), vol.35, no.7, December 2011
[16] Sabar S, Rasjad I, Djanggan S, Setyawan S,
Using Discrete data of ECG in the Numerical and Spectral forms, International Journal of Electrical & Computer Sciences, IJECS-IJENS, vol.15, No.03, June 2015
ISSN: 1992-8645 www.jatit.org E-ISSN: 1817-3195 [18] Thulasi Prasad S & Varadarajan S, 2015.
Analysis of ST-Segment abnormalitiesin ECG using signal block averaging Technique. International Journal of Advanced Research in Computer and Communication Engineering, vol.4, Issue 2, February 2015 [19] Vivek SC, Durgesh KM, PB Patil, 2011.