INDIAN RESEARCH OUTPUT ON MEMS LITERATURE
USING SCOPUS DATABASE : A SCIENTOMERIC STUDY
1AL.BATHRINARAYANAN, 2 DR. M. TAMIZHCHELVAN
1
Librarian, Sri Krishna College of Technology, Coimbatore, India 2
Deputy Librarian, Gandhigram Rural Institute-Deemed University, Gandhigram, Dindigul, India Email: [email protected], [email protected]
ABSTRACT
The study explores the research output of MEMS literature from 1970 to 2013, data collected from Scopus database. The total number of publications has been identified as 294573 records among Indian contribution were 8050 records. The Indian contribution has been analysed and tabulated in this paper, from the study, 2.73 % (8050 items) by Indian authors, growth of publications from 1970 to 2013, author collaboration is single authored 11.4%, remaining are collaboration in nature, the length of the articles was counted by pages which confirms that most of the articles are in range of 6 to 10 pages.
Keywords: Bibliometrics, MEMS, Authorship Pattern, Scientometrics, Scopus database
1. INTRODUCTION
Scientometric is one of the research methods in sciences. The research output of the scientometric study give the views of the subject developments and the persons involved on the subjects in the globe. This subject is dealt by library and information science, because the analysis of the subjects, authors publications, indexing of the articles, and so on. It analyses the quantitative analysis and statistics to describe the patterns of publications in the given field of study. Bibliometrics is first known in information science and have been applied by F.J. Cole and N.B. Eales in 1917. This study intends to make a scientometric study of MEMS based on literature being contributed by Indian authors. Scientometric study is a simple statistical method of bibliography counting to evaluate and quantify the growth of a subject. The data was collected from Scopus the period of 1970 to 2013 to examine the growth of MEMS research in India, the sources of publications and collaboration in nature.
2. BIBLIOMETRIC STUDY
The similar terms of bibliometrics are scientometrics, informetrics, webomtrics. The term scientometrics and Informetrics have become a standard tool of science policy and research management in the recent years. Bibliometric analysis is employed by researchers to study the growth of literature in given field. Scientometrics for science policy and its management is the domain of research
evaluation at present the most important topic in the field. Pritchard (1969) defined the term Bibliometric as the application of statistical and mathematical methods to books and other communication. It is an important research method to identify the thrust areas of the research and incorporating different branches of human knowledge. There are famous Laws of Bibliometric i.e. (Lotka 1926) of scientific productivity, Bradford’s law (Bradford, 1934) of scattering and Zips law (Zips, 1949) on frequency of words. However, the bibliometrics study is unique and common to all the subjects after sixties.
3. MEMS: A BRIEF NOTE
MEMS is also the same way to non-electromechnical systems (NEMS) and technology. This has been prepared as a proposal and submitted to DARPA in 1986 and introduced the term “microelectromechanical” systems. It has very good impact on global economy for using this techniques and micro system based devices. To create tiny integrated product or devices are both the combination of mechanical and electrical components. Integrated circuit (IC) has been used to fabricate the devices using these techniques and the ranges from millimeters to micro-millimeters.
4. OBJECTIVES OF THE STUDY
The objectives of the study are
1. To examine the worldwide research production in MEMS from 1970-2013. 2. To identify the document type of the
publications in MEMS.
3. To compare and measure the growth rate of literature published.
4. To examine the journal producing more on MEMS during 1970-2013.
5. To find out the authorship pattern among Indian Authors during 1970-2013
5. HYPOTHESES
The following hypotheses have been formulated for this study based on objectives.
• There exists substantial literature on MEMS.
• Growth of publications in MEMS research in Indian authors
• There exists domination of collaborative research in MEMS.
• There exists steady growth in Indian publication production in MEMS.
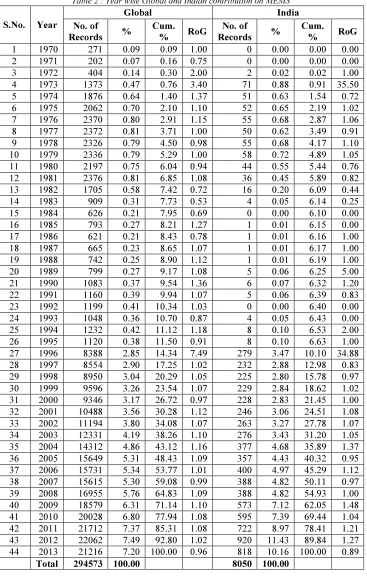
6. COLLECTION OF DATA
For this study, the literature on MEMS research data has been downloaded from ‘Scopus’, multidisciplinary online database, which is an international indexing and abstracting database, using the search term “MEMS”. For this study, publications commencing from 1970-2013 (44 years) has been downloaded from the database. A total of 2,94,573 data has been identified. Further, Indian Authors contributions were 8,050 during the same period. The collected data has been
classified by using Excel and the same was loaded in to SPSS (Statistical Package for Social Sciences) for the purpose of analysis. Statistical tools such as frequency distribution and percentage analysis and Scientometric techniques such as Authorship pattern, Relative Growth Rate (RGR), Doubling time (Dt), etc has been used for the study.
The Relative Growth Rate (RGR) is the increase in number of articles/pages per unit of time. This definition is derived from the definition of relative growth rates in the study of growth analysis of individual plants and effectively applied in the field of botany (Hunt, 1978), which in turn, had its origin from the study of the rate of interest in the financial investment (Blackman, 1919). The mean Relative Growth Rate (R) over the specific period of interval can be calculated from the following equations. There exists a direct equivalence between the relative growth rate and the doubling time(Mahapatra, 1985).
Description Formula
Relative Growth Rate (RGR)
Loge 2W – loge 1W
1-2R =
2T - 1 T
Doubling Time (Dt (a))
0.693 Dt (a) =
1-2R ( aa-1 year-1 )
Doubling Time (Dt (p))
0.693 Dt (p)=
1-2R ( pp-1 year-1 )
7. DATA ANALYSIS
7.1 Country Wise Distribution and Growth of Articles
[image:2.595.309.524.381.554.2]The MEMS publications have been using the country wise production along with comparing Rate of Growth of literature of USA contributions with the rest of the world as well as the same process has been repeated with India. The process has been tabulated below (table 1).
Table 1 : Country Wise Distribution and Growth of Articles
COUNTRY TP %
Germany 18259 6.20 0.18 2.27
UK 16365 5.56 0.16 2.03
Italy 15282 5.19 0.15 1.90 Canada 11655 3.96 0.12 1.45 India 8050 2.73 0.08 1.00 Brazil 7939 2.70 0.08 0.99 Spain 7919 2.69 0.08 0.98 Australia 7652 2.60 0.08 0.95 South Korea 7488 2.54 0.08 0.93 Taiwan 7452 2.53 0.07 0.93 Switzerland 5585 1.90 0.06 0.69 Russian
Federation 5277 1.79 0.05 0.66 Netherlands 5208 1.77 0.05 0.65 Others 6678 2.27 0.07 0.83 Total 294573 100.00 2.95 36.59
The table reveals that US contribution is 99766 (33.87%) that is one third of the production of the total articles were contributed by the authors from USA, followed by China 23609 (8.01%), Japan 20574 (6.98%), France 19815 (6.73%), Germany 18259 (6.20%), UK 16365 (5.56%), Italy 15282 (5.19%), Canada 11655 (3.96%), India 8050 (2.73%). Further it can be seen that only 8 countries were contributed more than 10,000 publications. Among the Ten countries, India position is 9th place. The growth rates of literature comparing USA with other countries are less contribution where as India with other countries are twelve times higher production in the case of USA and followed by doubled by China, Japan, France, Germany.
7.2 Year Wise Distribution of Literature on MEMS
Year wise contributions of articles across the world and India have been tabulated with Rate of growth of literature on MEMS.
Table 2 : Year Wise Global and Indian Contribution on MEMS
Figure 1 : Cumulative contribution of publications by Global
Figure 2 : Cumulative contribution of publications by Indian Authors
The contribution of articles to the literature on MEMS was steady 1973-81 but at the same time there was decrease on the part of contribution of the articles to the literature from 1982 – 1990 and again there was increase in the contribution after 1991 onwards. The same
situation prevails on the part of Indian contribution to the literature on MEMS. From the table it is observed that there was rapid growth of literature for the period 1971—1974 and 1996-1998 Internationally and same type of growth has been observed in India. The contribution of very low during the period 1980-1984 Internationally and there was no decline of contribution on the part of the Indian side.
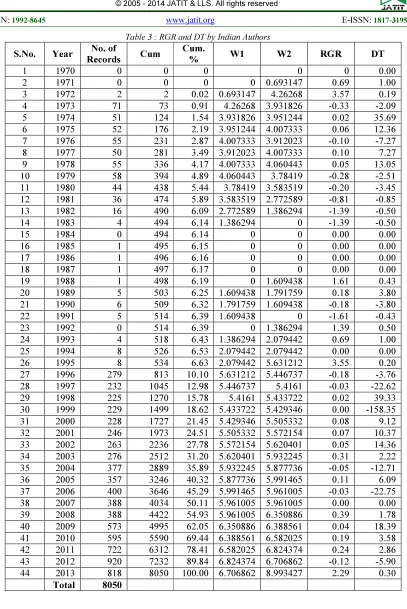
7.3 Relative Growth Rate of Articles and Dt of Articles on MEMS by Indian Authors
Relative Growth Rate and Doubling Time of articles to the literature on MEMS have been tabulated with year wise with number of articles.
Table 3 : RGR and DT by Indian Authors Figure 3 : Rate of Growth of Global Authors
Figure 4 : Rate of Growth of Indian Authors
Relative growth rate of contributions, a comparative study of pervious year cumulative growth, in the initial period seems to be high and slowly reduces. RGR ranges from 0.00 to 3.57. The doubling time ranges from 0.00 to 35.69 over the period. From the table it shows that the RGR is increased during the period 1970-1973, 1987-1990, 1992-1994, 1994-1996 and 2012 and RGR is decreased during the period 1978-194 and 1990-1992. There was increasing the Doubling Time during the period 1973-1975, 1977-78, 1997-1998 and it was decreased during the period 1998-2000.
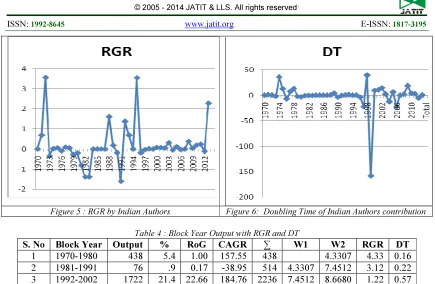
7.4 Block Year Output RGR and Dt
The contribution of data has been segregated into four blocks and each block covering a period of eleven years.
Table 4 : Block Year Output with RGR and DT Figure 5 : RGR by Indian Authors Figure 6: Doubling Time of Indian Authors
contribution
From the table, it reveals that there was a steady growth of literature on MEMS during the above period (1992-2013). The contribution of articles during the second block period (1981-1991) was in decreasing trend.
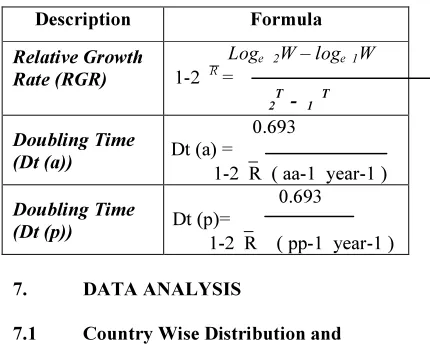
7.5 Authorship Pattern
authors of scientific literature. It describes the frequency of publication by authors in a given field. Collaborative Index (CI) is one of the early measures of degree of collaboration derived by Lawani (1980). Let the collection K be the research papers published in a discipline or in a journal during a certain period of interest.
Table 5 : Indian Authorship Pattern on MEMS
S.N o.
Authors collaborat
ion
Freque
ncy %
Numb er of Autho rs 1 Single 920 11.4 920
2 Double 2371 29.5 4742
3 Three 1961 24.4 5883
4 Four 1264 15.7 5056
5 Five and
Above 1534 19.1 10771
Total 8050 100.
00 27372 Average Authors per article = 3.40
Degrees of Collaboration =0.885714
Figure 7 : Author Collaboration
The data in Table 5 reveals that multi-authorship contributions dominate this field of research. Single authored contribution accounts for 920 (11.4%), two authors is 2371 (29.5%), three authors accounts for 1961 (24.47%) and four authored 1264 (15.7%) and finally more than four authors are contributed by 1534 (19.1%). Nearly 90% of researches are collaborative in nature. The average authors’ per article is 3.40 and the degrees of collaboration is 0.885714.
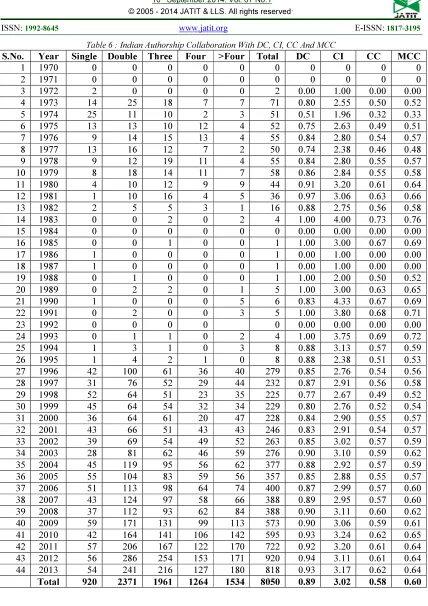
7.6 Authorship Collaboration - DC, CI, CC and MCC
The authorship pattern were analysed using Degrees of collaboration, Collaborative Index, Collaborative Coefficient and Modified Collaborative Coefficient for the period of 44 years on MEMS literature.
Table 6 : Indian Authorship Collaboration with DC, CI, CC and MCC
From the table 6, it is observed that Degrees of Collaboration is 1 for the years 1983, 1988, 1989, 1991, 1993. Collaborative Index in the year 1990 is 4.33 and followed by 1983 (4.0), 1991 (3.80), 1993 (3.75). The data is also subject to calculate the differentiations among levels of multiple authors CC and MCC. It has been calculated and presented in the table 6. CC is in the range between 0.00 and 0.73 and the MCC is between (1972) 0.00 and (1983) 0.76.
7.7 Bibliographical Form of Publications on MEMS from India
[image:4.595.310.513.484.687.2]MEMS literature has been analysed based on the contents form like Articles in journal, conference paper, review of the articles, book and editorial, etc. The data has been presented in Table 7 for the MEMS during 1970-2013.
Table 7 : Bibliographic Form Of Publications From India
Form Frequenc
y %
Cum. Percen
t
Article
6038 75.0
1 75.0 Conference
Paper
1316 16.3
5 91.35
Review 317 3.94 95.29
Book 3 .04 95.33
Editorial 8 .10 95.43
Note 34 .42 95.85
Short Survey 16 .20 96.05
Others 318 3.95 100.00
Total
8050 100.
0
(16.35%), Review is 3.94%, and others 3.95 only.
7.8 Top Authors in the Literature on MEMS
[image:5.595.72.298.275.600.2]The top authors were calculated based on the publications productions in the literature on MEMS during 1970 – 2013. The table 8 shows the top 23 authors among the Indian publications,
Table 8 : Top Authors In India During The Study Period 1970 – 2013
S.No. AUTHOR NAME No. of
Articles %
1 Chandra, S. 52 0.65
2 Bhattacharyya, T.K. 48 0.60
3 Saravanan, R. 44 0.55
4 Jussawalla, D.J. 35 0.43 5 Bhattacharya, E. 35 0.43
6 Ganatra, R.D. 34 0.42
7 Advani, S.H. 33 0.41
8 Mishra, D.C. 32 0.40
9 Pratap, R. 31 0.39
10 Ananthasuresh, G.K. 30 0.37
11 Bhide, S.V. 30 0.37
12 Das, S. 30 0.37
13 Ranadive, K.J. 26 0.32
14 Rahaman, H. 25 0.31
15 Sharma, A. 25 0.31
16 Pandit, M.K. 25 0.31
17 Rajendran, C.P. 24 0.30
18 Koul, S.K. 24 0.30
19 Rajendran, K. 22 0.27
20 Saha, H. 22 0.27
21 Ganguly, R. 21 0.26
22 Anbarasan, R. 20 0.25
23 Kayal, J.R. 20 0.25
24 Others 7362 91.45
Total 8050 100.00
It is observed from the table, 52 (0.65%) publications is the highest production among the Indian authors. Among the top author is Chandra, S and followed by Bhattacharyya, T.K. 58 (0.60%).
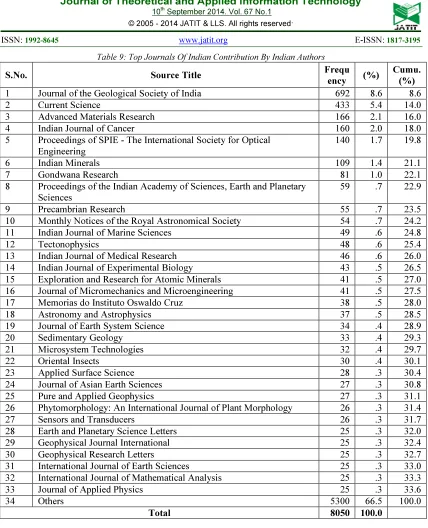
7.9 Journals Publication in the field of MEMS by Indian Authors
In this study, an analysis has been made to find out the list of top 33 journals producing
MEMS research output and the same is shown in the table 9.
Table 9 : Top Journals of Indian Contribution by Indian Authors
It is found that ‘Journal of the Geological Society of India’ 692 (8.6%) and Current Science
433 (5.4%) are the top two journals for publications on MEMS by the Indian authors.
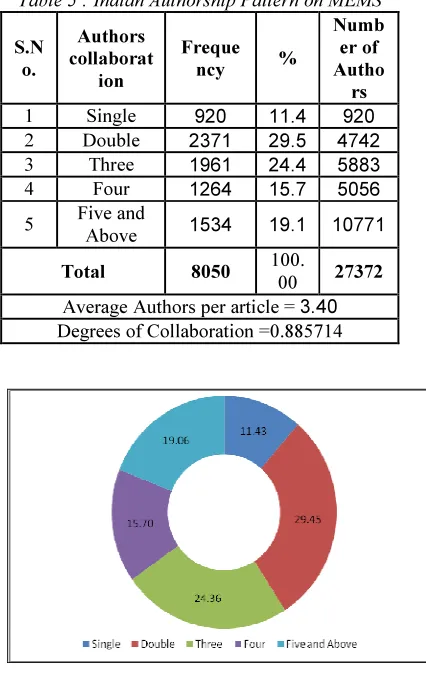
7.10 Number of Pages by the Indian Authors
[image:5.595.306.513.349.504.2]The table has been classified by using number of pages per articles like 1-5, 6-10, etc is shown. It can be observed the average number of pages written the articles on MEMS.
Table 10 : Number of Pages by the Indian Authors
S.No .
No. of pages
No. of
Articles %
1 1-5 1899 23.59
2 6-10 2896 35.98
3 11-15 1329 16.51
4 16-20 645 8.01
5 21-25 288 3.58
6 26-30 121 1.50
7 Above 30 872 10.83
Total 8050
100.0 0
One third of the publications length of the paper is 6-10 (2896 publications) and followed by 1899 in the length of 1-5 (23.59%).
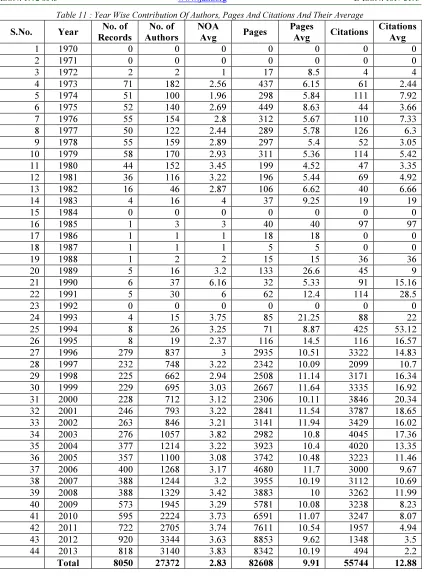
7.11 Year wise contribution of Authors, Pages and Citations and their average
It has been tabulated year wise productions with authors, average of authors, number of pages and average of pages and number of citations and average of citations.
Table 11 : Year Wise Contribution of Authors, Pages and Citations and their average
understood that average of authors are from two and three authors. The same way, number of pages were also calculated, it is found that average per article pages is 9.91 and the range of pages per articles are from 4 page to 40 pages. The overall citations among the Indian authors were calculated and the average per article citations is 12.88. The maximum average citation is 53.12 in the year 1994.
8. FINDINGS AND CONCLUSION
It can be seen from the study that the total production of articles from India is 8050 (2.73%) for the period of 1970 to 2013. It is found that India occupies 9th ranking among the world production of articles on MEMS. USA contribution is the top comparing with other countries. While comparing with India the USA has twelve time higher production. There was steady growth on the subject from 1991 onwards. The Doubling Time was increasing during 1973-75, 1977-88 and 97-98 and decreasing trends during the period 1998-2000. The contribution of articles during the second block period (1981-1991) was in decreasing trend. Single authored contribution accounts for 920 (11.4%). The average authors’ per article is 3.40 and the degrees of collaboration is 0.885714. The three fourth of publications are from Journals. Among the top author is Chandra, S and followed by Bhattacharyya, T.K. 58 (0.60%). Journal of the Geological Society of India 692 (8.6%) and
Current Science 433 (5.4%) are the top two journals for publications on MEMS by the Indian authors. The overall citations among the Indian authors were calculated and the average per article citations is 12.88. The maximum average citation is 53.12 in the year 1994.
REFERENCES
[1] V.H. Blackman, “The compound interest law and plant Growth”, Annals of Botany, 33, 1919, pp. 353-360.
[2] Samuel C. Bradford, “Sources of Information on Specific Subjects”,
Engineering: An Illustrated Weekly Journal (London), No. 137, 1934, pp. 85–86. [3] F.J. Cole, and N.B. Eales, “The history of
comparative anatomy”, Part-1: A Statistical analysis of literature. Science Progress, No. 11, 1917, pp. 578-596.
[4] R. Hunt, Plant growth analysis: London: Edward Arnold, 1978.
[5] Alfred J. Lotka, “The frequency distribution of scientific productivity”. Journal of the Washington Academy of Sciences, Vol. 16, No. 12, 1926, pp. 317–324.
[6] M. Mahapatra, “On the Validity of the theory of Exponential Growth of Scientific Literature”, Proceedings of the 15th IASLIC Conference on Bibliometric Studies : application of quantitative method to study the published literature, Bangalore University, Bangalore, 26th -29th Dec, 1985, pp. 61-70.
[7] Alan Pritchard, “Statistical Bibliography or Bibliometrics?”, Journal of Documentation, Vol. 25, No. 4, 1969, pp. 348-349.
[8] Stephen Jacobsen, “Proposal submitted to DARPA in 1986 first introducing the term "microelectromechanical systems", submitted to Defense Advanced Research Project Agency, 1986.
[9] AL. Bathrinarayanan, and M. Tamizhchelvan, “MEMS output in Scopus database: A Bibliometric Analysis”, Journal of Advances in Library and Information Science, Vol. 2, No. 2, 2013, pp. 100-104. [10] William L. Briggs, Lyle Cochran, Bernard
Gillett, “Calculus: Early Transcendental”. Pearson Education, Limited, 2011.
Annexure - I
Table 2 : Year wise Global and Indian contribution on MEMS
S.No. Year
Global India
No. of Records %
Cum.
% RoG
No. of Records %
Cum.
% RoG
1 1970 271 0.09 0.09 1.00 0 0.00 0.00 0.00 2 1971 202 0.07 0.16 0.75 0 0.00 0.00 0.00 3 1972 404 0.14 0.30 2.00 2 0.02 0.02 1.00 4 1973 1373 0.47 0.76 3.40 71 0.88 0.91 35.50 5 1974 1876 0.64 1.40 1.37 51 0.63 1.54 0.72 6 1975 2062 0.70 2.10 1.10 52 0.65 2.19 1.02 7 1976 2370 0.80 2.91 1.15 55 0.68 2.87 1.06 8 1977 2372 0.81 3.71 1.00 50 0.62 3.49 0.91 9 1978 2326 0.79 4.50 0.98 55 0.68 4.17 1.10 10 1979 2336 0.79 5.29 1.00 58 0.72 4.89 1.05 11 1980 2197 0.75 6.04 0.94 44 0.55 5.44 0.76 12 1981 2376 0.81 6.85 1.08 36 0.45 5.89 0.82 13 1982 1705 0.58 7.42 0.72 16 0.20 6.09 0.44 14 1983 909 0.31 7.73 0.53 4 0.05 6.14 0.25 15 1984 626 0.21 7.95 0.69 0 0.00 6.10 0.00 16 1985 793 0.27 8.21 1.27 1 0.01 6.15 0.00 17 1986 621 0.21 8.43 0.78 1 0.01 6.16 1.00 18 1987 665 0.23 8.65 1.07 1 0.01 6.17 1.00 19 1988 742 0.25 8.90 1.12 1 0.01 6.19 1.00 20 1989 799 0.27 9.17 1.08 5 0.06 6.25 5.00 21 1990 1083 0.37 9.54 1.36 6 0.07 6.32 1.20 22 1991 1160 0.39 9.94 1.07 5 0.06 6.39 0.83 23 1992 1199 0.41 10.34 1.03 0 0.00 6.40 0.00 24 1993 1048 0.36 10.70 0.87 4 0.05 6.43 0.00 25 1994 1232 0.42 11.12 1.18 8 0.10 6.53 2.00 26 1995 1120 0.38 11.50 0.91 8 0.10 6.63 1.00 27 1996 8388 2.85 14.34 7.49 279 3.47 10.10 34.88 28 1997 8554 2.90 17.25 1.02 232 2.88 12.98 0.83 29 1998 8950 3.04 20.29 1.05 225 2.80 15.78 0.97 30 1999 9596 3.26 23.54 1.07 229 2.84 18.62 1.02 31 2000 9346 3.17 26.72 0.97 228 2.83 21.45 1.00 32 2001 10488 3.56 30.28 1.12 246 3.06 24.51 1.08 33 2002 11194 3.80 34.08 1.07 263 3.27 27.78 1.07 34 2003 12331 4.19 38.26 1.10 276 3.43 31.20 1.05 35 2004 14312 4.86 43.12 1.16 377 4.68 35.89 1.37 36 2005 15649 5.31 48.43 1.09 357 4.43 40.32 0.95 37 2006 15731 5.34 53.77 1.01 400 4.97 45.29 1.12 38 2007 15615 5.30 59.08 0.99 388 4.82 50.11 0.97 39 2008 16955 5.76 64.83 1.09 388 4.82 54.93 1.00 40 2009 18579 6.31 71.14 1.10 573 7.12 62.05 1.48 41 2010 20028 6.80 77.94 1.08 595 7.39 69.44 1.04 42 2011 21712 7.37 85.31 1.08 722 8.97 78.41 1.21 43 2012 22062 7.49 92.80 1.02 920 11.43 89.84 1.27 44 2013 21216 7.20 100.00 0.96 818 10.16 100.00 0.89
Figure 1 : Cumulative contribution of publications by Global
Figure 2 : Cumulative contribution of publications by Indian Authors
Table 3 : RGR and DT by Indian Authors
S.No. Year No. of
Records Cum
Cum.
% W1 W2 RGR DT
1 1970 0 0 0 0 0 0.00
2 1971 0 0 0 0 0.693147 0.69 1.00
3 1972 2 2 0.02 0.693147 4.26268 3.57 0.19
4 1973 71 73 0.91 4.26268 3.931826 -0.33 -2.09 5 1974 51 124 1.54 3.931826 3.951244 0.02 35.69 6 1975 52 176 2.19 3.951244 4.007333 0.06 12.36 7 1976 55 231 2.87 4.007333 3.912023 -0.10 -7.27 8 1977 50 281 3.49 3.912023 4.007333 0.10 7.27 9 1978 55 336 4.17 4.007333 4.060443 0.05 13.05 10 1979 58 394 4.89 4.060443 3.78419 -0.28 -2.51 11 1980 44 438 5.44 3.78419 3.583519 -0.20 -3.45 12 1981 36 474 5.89 3.583519 2.772589 -0.81 -0.85 13 1982 16 490 6.09 2.772589 1.386294 -1.39 -0.50
14 1983 4 494 6.14 1.386294 0 -1.39 -0.50
15 1984 0 494 6.14 0 0 0.00 0.00
16 1985 1 495 6.15 0 0 0.00 0.00
17 1986 1 496 6.16 0 0 0.00 0.00
18 1987 1 497 6.17 0 0 0.00 0.00
19 1988 1 498 6.19 0 1.609438 1.61 0.43
20 1989 5 503 6.25 1.609438 1.791759 0.18 3.80 21 1990 6 509 6.32 1.791759 1.609438 -0.18 -3.80
22 1991 5 514 6.39 1.609438 0 -1.61 -0.43
23 1992 0 514 6.39 0 1.386294 1.39 0.50
24 1993 4 518 6.43 1.386294 2.079442 0.69 1.00 25 1994 8 526 6.53 2.079442 2.079442 0.00 0.00 26 1995 8 534 6.63 2.079442 5.631212 3.55 0.20 27 1996 279 813 10.10 5.631212 5.446737 -0.18 -3.76 28 1997 232 1045 12.98 5.446737 5.4161 -0.03 -22.62 29 1998 225 1270 15.78 5.4161 5.433722 0.02 39.33 30 1999 229 1499 18.62 5.433722 5.429346 0.00 -158.35 31 2000 228 1727 21.45 5.429346 5.505332 0.08 9.12 32 2001 246 1973 24.51 5.505332 5.572154 0.07 10.37 33 2002 263 2236 27.78 5.572154 5.620401 0.05 14.36 34 2003 276 2512 31.20 5.620401 5.932245 0.31 2.22 35 2004 377 2889 35.89 5.932245 5.877736 -0.05 -12.71 36 2005 357 3246 40.32 5.877736 5.991465 0.11 6.09 37 2006 400 3646 45.29 5.991465 5.961005 -0.03 -22.75 38 2007 388 4034 50.11 5.961005 5.961005 0.00 0.00 39 2008 388 4422 54.93 5.961005 6.350886 0.39 1.78 40 2009 573 4995 62.05 6.350886 6.388561 0.04 18.39 41 2010 595 5590 69.44 6.388561 6.582025 0.19 3.58 42 2011 722 6312 78.41 6.582025 6.824374 0.24 2.86 43 2012 920 7232 89.84 6.824374 6.706862 -0.12 -5.90 44 2013 818 8050 100.00 6.706862 8.993427 2.29 0.30
Figure 5 : RGR by Indian Authors Figure 6: Doubling Time of Indian Authors contribution
Table 4 : Block Year Output with RGR and DT
S. No Block Year Output % RoG CAGR ∑ W1 W2 RGR DT
1 1970-1980 438 5.4 1.00 157.55 438 4.3307 4.33 0.16 2 1981-1991 76 .9 0.17 -38.95 514 4.3307 7.4512 3.12 0.22 3 1992-2002 1722 21.4 22.66 184.76 2236 7.4512 8.6680 1.22 0.57 4 2003-2013 5814 72.2 3.38 31.21 8050 8.6680 8.9934 0.33 2.13
Table 6 : Indian Authorship Collaboration With DC, CI, CC And MCC
S.No. Year Single Double Three Four >Four Total DC CI CC MCC
1 1970 0 0 0 0 0 0 0 0 0 0
2 1971 0 0 0 0 0 0 0 0 0 0
3 1972 2 0 0 0 0 2 0.00 1.00 0.00 0.00
4 1973 14 25 18 7 7 71 0.80 2.55 0.50 0.52
5 1974 25 11 10 2 3 51 0.51 1.96 0.32 0.33
6 1975 13 13 10 12 4 52 0.75 2.63 0.49 0.51
7 1976 9 14 15 13 4 55 0.84 2.80 0.54 0.57
8 1977 13 16 12 7 2 50 0.74 2.38 0.46 0.48
9 1978 9 12 19 11 4 55 0.84 2.80 0.55 0.57
10 1979 8 18 14 11 7 58 0.86 2.84 0.55 0.58
11 1980 4 10 12 9 9 44 0.91 3.20 0.61 0.64
12 1981 1 10 16 4 5 36 0.97 3.06 0.63 0.66
13 1982 2 5 5 3 1 16 0.88 2.75 0.56 0.58
14 1983 0 0 2 0 2 4 1.00 4.00 0.73 0.76
15 1984 0 0 0 0 0 0 0.00 0.00 0.00 0.00
16 1985 0 0 1 0 0 1 1.00 3.00 0.67 0.69
17 1986 1 0 0 0 0 1 0.00 1.00 0.00 0.00
18 1987 1 0 0 0 0 1 0.00 1.00 0.00 0.00
19 1988 0 1 0 0 0 1 1.00 2.00 0.50 0.52
20 1989 0 2 2 0 1 5 1.00 3.00 0.63 0.65
21 1990 1 0 0 0 5 6 0.83 4.33 0.67 0.69
22 1991 0 2 0 0 3 5 1.00 3.80 0.68 0.71
23 1992 0 0 0 0 0 0.00 0.00 0.00 0.00
24 1993 0 1 1 0 2 4 1.00 3.75 0.69 0.72
25 1994 1 3 1 0 3 8 0.88 3.13 0.57 0.59
26 1995 1 4 2 1 0 8 0.88 2.38 0.51 0.53
27 1996 42 100 61 36 40 279 0.85 2.76 0.54 0.56
28 1997 31 76 52 29 44 232 0.87 2.91 0.56 0.58
29 1998 52 64 51 23 35 225 0.77 2.67 0.49 0.52
30 1999 45 64 54 32 34 229 0.80 2.76 0.52 0.54
31 2000 36 64 61 20 47 228 0.84 2.90 0.55 0.57
32 2001 43 66 51 43 43 246 0.83 2.91 0.54 0.57
33 2002 39 69 54 49 52 263 0.85 3.02 0.57 0.59
34 2003 28 81 62 46 59 276 0.90 3.10 0.59 0.62
Table 9: Top Journals Of Indian Contribution By Indian Authors
S.No. Source Title Frequ
ency (%)
Cumu. (%) 1 Journal of the Geological Society of India 692 8.6 8.6
2 Current Science 433 5.4 14.0
3 Advanced Materials Research 166 2.1 16.0
4 Indian Journal of Cancer 160 2.0 18.0
5 Proceedings of SPIE - The International Society for Optical Engineering
140 1.7 19.8
6 Indian Minerals 109 1.4 21.1
7 Gondwana Research 81 1.0 22.1
8 Proceedings of the Indian Academy of Sciences, Earth and Planetary Sciences
59 .7 22.9
9 Precambrian Research 55 .7 23.5
10 Monthly Notices of the Royal Astronomical Society 54 .7 24.2
11 Indian Journal of Marine Sciences 49 .6 24.8
12 Tectonophysics 48 .6 25.4
13 Indian Journal of Medical Research 46 .6 26.0
14 Indian Journal of Experimental Biology 43 .5 26.5
15 Exploration and Research for Atomic Minerals 41 .5 27.0 16 Journal of Micromechanics and Microengineering 41 .5 27.5
17 Memorias do Instituto Oswaldo Cruz 38 .5 28.0
18 Astronomy and Astrophysics 37 .5 28.5
19 Journal of Earth System Science 34 .4 28.9
20 Sedimentary Geology 33 .4 29.3
21 Microsystem Technologies 32 .4 29.7
22 Oriental Insects 30 .4 30.1
23 Applied Surface Science 28 .3 30.4
24 Journal of Asian Earth Sciences 27 .3 30.8
25 Pure and Applied Geophysics 27 .3 31.1
26 Phytomorphology: An International Journal of Plant Morphology 26 .3 31.4
27 Sensors and Transducers 26 .3 31.7
28 Earth and Planetary Science Letters 25 .3 32.0
29 Geophysical Journal International 25 .3 32.4
30 Geophysical Research Letters 25 .3 32.7
31 International Journal of Earth Sciences 25 .3 33.0
32 International Journal of Mathematical Analysis 25 .3 33.3
33 Journal of Applied Physics 25 .3 33.6
34 Others 5300 66.5 100.0
Table 11 : Year Wise Contribution Of Authors, Pages And Citations And Their Average
S.No. Year No. of Records
No. of Authors
NOA
Avg Pages
Pages
Avg Citations
Citations Avg
1 1970 0 0 0 0 0 0 0
2 1971 0 0 0 0 0 0 0
3 1972 2 2 1 17 8.5 4 4
4 1973 71 182 2.56 437 6.15 61 2.44
5 1974 51 100 1.96 298 5.84 111 7.92
6 1975 52 140 2.69 449 8.63 44 3.66
7 1976 55 154 2.8 312 5.67 110 7.33
8 1977 50 122 2.44 289 5.78 126 6.3
9 1978 55 159 2.89 297 5.4 52 3.05
10 1979 58 170 2.93 311 5.36 114 5.42
11 1980 44 152 3.45 199 4.52 47 3.35
12 1981 36 116 3.22 196 5.44 69 4.92
13 1982 16 46 2.87 106 6.62 40 6.66
14 1983 4 16 4 37 9.25 19 19
15 1984 0 0 0 0 0 0 0
16 1985 1 3 3 40 40 97 97
17 1986 1 1 1 18 18 0 0
18 1987 1 1 1 5 5 0 0
19 1988 1 2 2 15 15 36 36
20 1989 5 16 3.2 133 26.6 45 9
21 1990 6 37 6.16 32 5.33 91 15.16
22 1991 5 30 6 62 12.4 114 28.5
23 1992 0 0 0 0 0 0 0
24 1993 4 15 3.75 85 21.25 88 22
25 1994 8 26 3.25 71 8.87 425 53.12
26 1995 8 19 2.37 116 14.5 116 16.57
27 1996 279 837 3 2935 10.51 3322 14.83
28 1997 232 748 3.22 2342 10.09 2099 10.7
29 1998 225 662 2.94 2508 11.14 3171 16.34
30 1999 229 695 3.03 2667 11.64 3335 16.92
31 2000 228 712 3.12 2306 10.11 3846 20.34
32 2001 246 793 3.22 2841 11.54 3787 18.65
33 2002 263 846 3.21 3141 11.94 3429 16.02
34 2003 276 1057 3.82 2982 10.8 4045 17.36
35 2004 377 1214 3.22 3923 10.4 4020 13.35
36 2005 357 1100 3.08 3742 10.48 3223 11.46
37 2006 400 1268 3.17 4680 11.7 3000 9.67
38 2007 388 1244 3.2 3955 10.19 3112 10.69
39 2008 388 1329 3.42 3883 10 3262 11.99
40 2009 573 1945 3.29 5781 10.08 3238 8.23
41 2010 595 2224 3.73 6591 11.07 3247 8.07
42 2011 722 2705 3.74 7611 10.54 1957 4.94
43 2012 920 3344 3.63 8853 9.62 1348 3.5
44 2013 818 3140 3.83 8342 10.19 494 2.2