THE IMPLEMENTATION OF BINARY GENETIC
ALGORITHM (BGA) FOR OPTIMIZING THE TASK OF
INDONESIAN NAVY SHIP PATROLS RELATED TO THE
SECURITY OF INDONESIA SEAS
1PUDJI SANTOSO, 2KETUT BUDA A, 3MASROERI, 4M. ISA IRAWAN, 5AAB. DINARIYANA
1
Maritime Diploma Program, University of Hang Tuah, Surabaya
2
Realibility and Security of Ships Laboratory, Naval System Engineering Department, ITS
3
Computation Laboratory, Math Department, ITS Jl. Teknik Kimia, Kampus ITS Sukolio, Surabaya
E-mail: [email protected], [email protected], : [email protected],
4
[email protected] , :[email protected]
ABSTRACT
This paper discussed the concept of decision making on the model of sea security system to overcome the cases related to territorial trespasses by foreign countries in the east maritime region of Indonesia. The most common cases are illegal fishing, illegal logging, and borders trespasses. In order to find an apt strategy in minimazing the trespasses in this area, this study conducted a simulation on the task for ship patrol using optimized method called Binary Genetic Algorithm (BGA). This model was used to select the optimized ship patrol combination in each zone with 3 scenes that were 5, 7 and 9 zones.
The purpose of these divisions was to get the fleet mix, the best ship in each zone with minimum operational cost for the maximum coverage area. The parameter used in this study was crossover probability (Pc< 75%) and mutational probabilty (Pm=0,1) that was conducted to 10-100 population,
500-1000 generations. The results of the simulation of 3 zones were; for 5 zone, the fleet mix obtained was {Z1=8; Z2=8; Z3=4; Z4=5; Z5=2}, for 7 zone, the fleet mix obtained was {Z1=4; Z2=4; Z3=4; Z4=2; Z5=4;
Z6=3; Z7=3}, and for 9 zone, the fleet mix obtained was{Z1=2; Z2=3; Z3=2; Z4=7; Z5=4; Z6=2; Z7=2; Z8=3;
Z9=2}, and based on the comparison of the width of the coverage area and the operational cost between
those zones, the most ideal implementation was 9 zones because it had 1.686.803.53 Mile2 for its coverage area and its operational cost was IDR 4,164,270,892.
Keywords :BGA, Fleet Mix, Zone, Decision Making
1. INTRODUCTION
Indonesia as a country which has many islands, 2/3 of its area are seas, and has three water domains that are free for other countries’ transportation, trades or military needs has a consequence to control and secure its seas based on the decree based on the United Nations Convention On The Law Of The Sea (UNCLOS, 1982). Thus, by having a such wide area, the cases of illegal fishing, illegal logging, and area trespasses in Indonesia territory happen. It can be concluded that Indonesian Navy have not covered all the seas yet because of its limited number of ship patrols and finance provided by the government. Therefore, the task on optimizing the ship patrol in its operation for the security of east maritime region of Indonesia must be conducted.
The division of its zones is similar to the military base of Indonesia Navy that becomes the force improvement-area to the operational area or ”deployment forces position” that is crucial to support the operational task of Indonesian Navy. In this study, the zones alternatives were 5, 7, and 9 zones. In supporting the idea stated, the data of area trespasses happened in east part of Indonesia Jurisdiction territory was shown at picture 1. (SOPS Armatim 2013).
ISSN: 1992-8645 www.jatit.org E-ISSN: 1817-3195
[image:2.595.305.520.238.444.2]
of the ships, the efforts to maximize the number of the zones and the fleet mix ships in each area were conducted.
Figure 1. The Violation in 2007 – 2013 (Source: SOPS Armatim 2013)
Binary Genetic Algorithm (BGA) method is the algorithm of the heuristical search based on the human evolution mechanism using binary numbers. It was established by John H. Holland in his book entitled “Adaptation in Natural and Artificial System” in 1978 that presented genetical algorithm in the evolution theory in Biology, especially in Darwin theory. The principal of the evolution is ‘if a problem is determined by the candidate of the solution, each solution will be called as an individual.
The indivual has a cromosome, a group of genes. The genes are the component to solve the problem. A group of individual is called a population. Each individual is counted by its ‘interest’, known as ‘fitness value’. Based on those values, the individual will attract one to another which causes sexual intercourse. The genetical shifting happens in the process, and two major processes happen, called crossover and mutation. The offsprings get through a similar process, so they will be good individuals.
The result og BGA is not the global optimum, maximum for all areas, but it will not lead to the local optimum, maximum for a certain area. The result was an acceptable optimum, a condition which the optimization is in an average level and it was accepted. This technique was for a complicated matter and it had not had its optimal technique to solve it yet.
2. RESEARCH METHODS
The genetic algolrithm is a searching algorithm that based on the mechanism of nature selection and genes. The purpose was to determine the structures of qualified individual in the population to find a best solution of the problems happened. John H. Holland enhanced it by using an interactive procedures to manage the population that becomes the candidate of the solution.
The genetic algorithm is different from the conventional searching algorithm becasue it is started with a preliminary group called population. Each individual in the population, called cromosome, the string of the symbol, commonly one bit of binary string. The genetic algorithm uses two basic principles of biological system. They are:
a. The selection of the existing species (evolution)
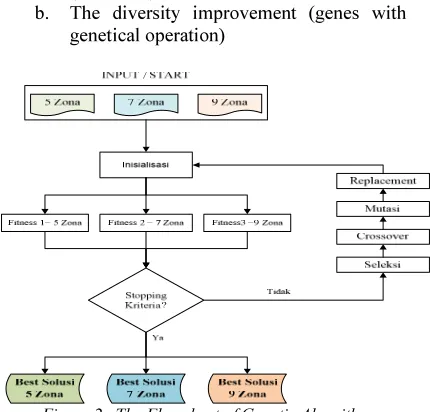
b. The diversity improvement (genes with genetical operation)
Figure 2. The Flowchart of Genetic Algorithm
The main elements of the genetic algorithm are individual and population. The individual is the solution candidate, and population is a group of individual or several solution candidates. The individual is a solution candidate, and each individual groups becomes two forms of solution, a cromosome. It forms a string as a symbol of a bit binary string that reveals information of genotype and phenotype as the model of a cromosome.
A population consists of a group of individual that are tested and determined by phenotype parameter that are added by other information in the process of searching. There are two important aspects used in the genetic algorithm; the generation of preliminary population and the size of the population that uses cromosome in the form of binary code, and each bit has a value of 1 or 0 randomly.
by the string of bit in the gene. A bit string has a length (n) and is represented with the value of 0 to (2n – 1). There are several things to do in Binary Genetic Algorithm as follows:
A. DEFINE AN INDIVIDUAL
[image:3.595.88.293.265.307.2]An individu states one of the solutions of the problem about the operational zone selection in the east maritime region of Indonesia, and the fleet mix ship patrol in each zone that is suitable with the characteristics of the ships and the zone condition.
Figure 3. Individual
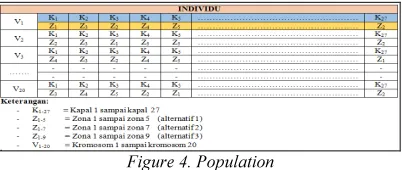
Because there were 27 ships, the number of the gene in each individual was 27 genes that formed 1 cromosome (Vi). The content of each gene was 4 bit that represented the ship position in the n zone. For example, in the column 1 (line 2 above) was Z5
(1001) that meant the ship number 1position was in the zone number 5, etc. If there was binary number that was more than 5 for the 5 zone alternative, it would be moduled by 6. For example, Z3 (1011),
the decimal value of 1011 is 13 and moduled by 6 = 1, so the ship number 1 is in the 3rd zone. As the picture 3, it could be concluded that each cromosome of the first of the fourth bit was the position of the first ship at the n Zone (Zn), the
second of the fourth bit (5,6,7,8) the position of the second ship in the n Zone (Zn), etc. that was up to
the 27th of the fourth bit (105,106,107,108) the position of the 27th ship at the Zn which n=
1,2,3,...5, for 5 zones. Each ship was only situated at one zone that meant it could not be moved to another zone.
Figure 4. Population
B. DEFINING THE VALUE OF FITNESS An individual is evaluated based on the certain function as the measurement of its performance. In a natural evolution, an individual that has high fitness value will survive. However, an individual that has low fitness value will die. In this research, to maximize the coverage area (known as the
problem of maximization), the fitness value used was:
Fitness = (1)
Where : CA = coverage area, LS = the width of the zone, n = 5,7 and 9 (zone alternatives)
However, in this study, the cost was also minimized, so the formula used was:
Fitness = (2)
Cost total = (3)
Where : 5m = 5 billion
Cost total: the operational cost
For the 5 zone alternative, the formula used was similar to the 7 and 9 zones.
C. GENERATE OF THE INITIAL POPULATION Generate of the initial population is the process of generating a number of individual randomly. The size of the population depends on the solved problem and the type of the operator used. After the size of the population is being determined, then the generation of the initial population is conducted. The prerequisites needed must be fulfilled to find a solution in generating each individual.
The techniques applied in generating the initial population was the random-walk that used several parameters below as followed:
• The number of the ships sent and the data of ships that are ready
• The number of zones used and the homebase in the zones
• The alternative zones tested were 5 zone, 7 zone, and 9 zone.
• The fund provided by the Government was 5 trillions for one operational activity • The deviation of the coverage area (D) was
0< D≤ 5%
The main application of the random-walk involves random numbers for the value of each gene that is suitable for the cromosome representation applied is as follows:
[image:3.595.89.290.559.644.2]ISSN: 1992-8645 www.jatit.org E-ISSN: 1817-3195
IPOP is a gene that consists of numbers without decimal of the random numbers that were generated as Nipop (the number of the population ) X Nbits (the
number of the genes in each cromosome)
D. THE PROCESS OF THE SELECTION The selection was used to choose individuals chosen for the crossed-mating process and mutation. It is for getting the best individual candidate with the basic perspective that good parents will have good offsprings. The higher fitness value, the bigger chance an individual chosen.
The selection processes applied in the system of duty of the ship patrol were;
• Roulette Wheel is for choosing an individual that based on the impact of fitness value. The individual that has high fitness value means that a good individual is easier to choose.
• Rank. This process is implemented to quarantee on disappearance of super-individual that will destruct the evolution process so that it will be trapped in the local-optima. This process used negative exponential function that ordered the fitness in the population.
• Elitism. This process is used to assure that the fitness of a generation will be always good, at least similar to the previous generation, by substituting worse individual with the best individual of the previous generation.
E. THE PROCESS OF CROSSOVER
The crossover is one of the crucial components in BAG because a cromosome that leads to a good solution can be obtained from the process of crossover of two cromosomes. The method of the crossover in this study was random-swap crossover, by switching a gene of a paired-parents that will be checked again if there is a twins that must be repaired.
This operation is not always done to all existed individuals. The individual is chosen randomly using crossing with crossover Probability ( Pc ),
with a conditional that a chosen cromosome must be the even ones (2,4,6,8,10,12,14,16,18,20). Those pairs will have the crossover, and the range is 1-108 randomly. The crossover in this study was One Point Crossover (OPC), a cromosome chosen and being crossovered is determined with a probability (Pc) < 75%, so that the cromosome that will have
a crossover probability ≥ 75% will not being crossovered. In this study, the highest crossover probability was 0,70465 or closer to 70%. Thus, all cromosomes that have crossover probability under 70% were being crossovered.
F. THE PROCESS OF MUTATION
The mutation is done after the process of crossover. It emerges new cromosomes that are not the result of the crossover. The mutation is based on the change of the orders or element switching from the solution vectors and the appearance of new value because of the optimalization of the function. Those elements were chosen randomly, too.
The crucial parameter in this process was mutational probability (Pm). This probability will
determine which cromosome that will have a gene change. The higher the mutational probility value, the merrier cromosomes in the population that have mutation. In this study, the mutational probability was 5%, so it will be 5% out of all genes in the cromosomes will have mutation. The maximum mutational point is 108.
The point chosen was Pm < 0.05.The genetic
mutation is for substituting the missing genes of the population because of the process of selection that emerges gene that disappears in the selection. The point chosen will be marked using ‘–‘ or 0: ‘-‘ means that this point will be mutated from 1 to 0, ‘0’ means that the point will be mutated from 0 to 1.
G. IMPLEMENTATION BGA
In this study, the software used to create BAG was Visual Basic 6.0 using Microsoft Access as its database. The purpose of the application was to maximize the location of ship patrol army of Indonesia Navy in the east maritime region of Indonesia by dividing the zones into three, namely 5 zone, 7 zone and 9 zone. The parameter used for the BAG simulation was as followed:
Population size (Pop_size) = 20; Crossover probability (Pc) < 0.75; Mutational Probability (Pm) = 0,1;
A. 5TH ZONE ALTERNATIVE
Table 1. The Result Of Optimazing BGA At 5 Zone
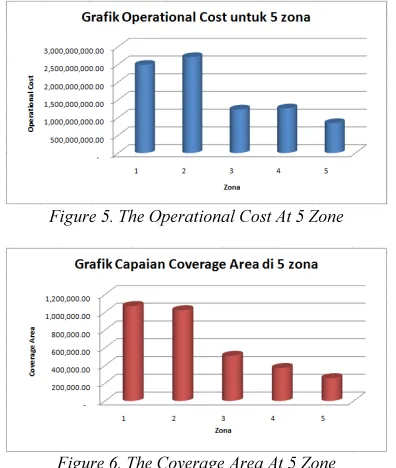
[image:5.595.185.498.68.354.2]Based on the table above, the graphic of the operational cost and coverage area in each zone for the simulation at 5 zones was shown as followed:
Figure 5. The Operational Cost At 5 Zone
Figure 6. The Coverage Area At 5 Zone
B. 7TH ZONE ALTERNATIVE
To maximize the location of the ship patrol of Indonesia Navy in the east maritime region of Indones using the 5th zone alternative of BAG, the result was shown as followed:
Table 2. The Result Of Optimazing BGA At7 Zone
Figure 7. The Operational Cost At 7 Zone
Figure 8. The Coverage Area At 7 Zone
C. 9TH ZONE ALTERNATIVE
To maximize the location of the ship patrol of Indonesia Navy in the east maritime region of Indones using the 5th zone alternative of BAG, the result was shown as followed:
[image:5.595.91.289.251.485.2]Table 3. The Result Of Optimazing BGA At 9 Zone
[image:5.595.237.501.438.650.2]ISSN: 1992-8645 www.jatit.org E-ISSN: 1817-3195
Figure 10. The Coverage Area At 9 Zone
3. ANALYSIS OF THREE ALTERNATIVE
ZONES
Based on the analysis conducted on the 3 alternative zones above, there were several results as followed:
• Alternatif I for the 5th zone, the result was:
- Coverage Area = 3.225.043.01 Mil2 ; - Operational Cost = IDR. 8.543.689.202 • Alternatif II for the 7th zone, the result
was:
- Coverage Area = 1.693.616.28 Mil2 ; - Operational Cost = IDR. 4.234.047.542 • Alternatif III for the 9th zone, the result
was:
[image:6.595.304.512.310.402.2]- Coverage Area = 1.726.803.53 Mil2; - Operational Cost = IDR. 4.164.270.892
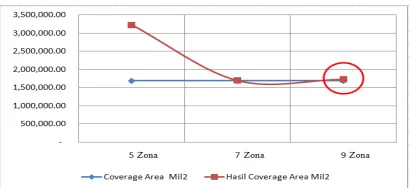
Table 4. The Comparison Of The Coverage Area Of 5, 7 And 9 Zones
[image:6.595.93.288.475.516.2]Based on the table 4 above, the coverage area in the 9th zone was more ideal than the 5th and 7th zones ideal because the width of the coverage area was equal to the needs of ship patrol operational cost.
Figure 11. The Coverage Area At 5, 7 And 9 Zones
Based on the management of the operational cost determined by the Government that was 5 billions, the table below showed the comparison of the operational cost of each coverage area with the
targetted budget of the operational cost as the table 5 below:
Table 5. The Comparison Of The Cost Of 5, 7 And 9 Zones
Based on table 5 above, the coverage area in the 9th zone was more ideal than the operational cost in the 5th zone and 7th zone. The 9th zone that had 20% operational cost showed that this zone was very ideal because the width of the coverage area was equal to the needs of ship patrol operational cost.
Figure 11. The Cost At 5, 7 And 9 Zones
The graphic showed that the highest operational cost was in the 4th zone with the 7 composition of the ship patrol, whereas the lowest was in the third zone with the 2 composition of ship patrol. It showed that the coverage area was equal to the operational cost to secure the east maritime region of Indonesia. The solution based on the BGA using 1000 itteration that was suited with the fitness value determined was influenced by the coverage area of each zone and the number of ship sent.
4. CONCLUSION
From the data analysis, there were several conclusions. They were;
a. The result of the optimazed BGA showed that the optimalization of ship patrol could be conducted in 5, 7, and 9 zones.
b. The optimized area ship patrol coverage are had to reach above 5% with its operational cost that was under 5% from its ideal condition.
c. In optimazing result where CA is Coverage Area, the research showed several data as followed;
1. 5 Zone: CA = 3.225.043.01 Mile2 and Cost = IDR. 8.543.689.202;
[image:6.595.89.294.580.674.2]3. 9 Zone: CA = 1.726.803.53 Mile2 and Cost = IDR. 4.164.270.892; d. Based on the data above, 9 zone is the best
solution observed from the spread of ship patrol, the efficacy of its cost, and the optimized fleet mix ships. Thus, the maximum security of the east maritime region of Indonesia will be achieved if the 9 zone solution is implemented.
REFERENCES
[1] . Budi Santoso, Paul Willy, 2011, Metoda Metaheuristik, Konsep dan Implementasi : Cetakan pertama April 2011,Guna Widya
[2] . Franz Rothlauf “Representations for Genetic and Evolutionary Algorithm” Second Edition Springer.
[3] . Golberg, D.E, 1989 “ Genetic Algorithms in Search, Optimization & Machine” Reading /Mass: Addison-Wesley.
[4] . Hozairi, M.A (2010) . Implementasi Algoritma Genetika Untuk Optimasi Penempatan Armada Kapal TNI AL di Kawasan Timur Indonesia dalam rangka mengamankan kedaulatan NKRI . Seminar Nasional Pascasarjana X - ITS (pp. 41-17). Surabaya : Teknik Informatika - ITS.
[5] . Jorg Biethahn – Volker Nissen (Eds.), “Evolutionary Algorithms In Management Applications” Springer S.N. Sivanandam, S.N. Deepa 2010, Introduction Genetic Algorithms, Springer.
[6] . Zbigniew Michalewicz,1995 “Genetic Algorithms Data Structures Evolution Programs” Third, Reviced and Extended Edition, Spring