Georgia State University Georgia State University
ScholarWorks @ Georgia State University
ScholarWorks @ Georgia State University
Kinesiology Theses Department of Kinesiology and Health
Summer 8-11-2011
Variability of vertical ground reaction forces in patients with
Variability of vertical ground reaction forces in patients with
chronic low back pain, before and after chiropractic care.
chronic low back pain, before and after chiropractic care.
Brent S. Russell Life University
Mark D. Geil
Georgia State University
Jianhua Wu
Georgia State University
Kathryn T. Hoiriis Life University
Follow this and additional works at: https://scholarworks.gsu.edu/kin_health_theses
Part of the Kinesiology Commons
Recommended Citation Recommended Citation
Russell, Brent S.; Geil, Mark D.; Wu, Jianhua; and Hoiriis, Kathryn T., "Variability of vertical ground reaction forces in patients with chronic low back pain, before and after chiropractic care.." Thesis, Georgia State University, 2011.
https://scholarworks.gsu.edu/kin_health_theses/3
Variability of vertical ground reaction forces in patients
with chronic low back pain, before and after chiropractic care
A thesis:
Submitted on July 11, 2011
(
revised version July 20, 2011
), to the
Department of Kinesiology & Health,
College of Education,
Georgia State University,
in partial fulfillment of the requirements for the degree of
Master of Science in Kinesiology & Health,
Biomechanics Concentration.
______________________________________________ Brent da Silva Russell
Approved:
______________________________________________ Mark D. Geil, PhD, advisor
______________________________________________ Jianhua (Jerry) Wu, PhD, thesis committee member
Abstract
Introduction
It seems clear that chiropractors have an interest in gait, the manner or style of walking.
Many chiropractic articles and textbooks discuss gait and it is not uncommon for patients to
report improved walking after receiving chiropractic care. But there actually has been very little
research into the effects of chiropractic adjustment on gait. The intent of this pilot study was to
recruit a group of people likely to have some abnormalities of gait, and use a quantitative
method of gait evaluation before and after a series of chiropractic visits. Choices were made to
evaluate variability of vertical ground reaction forces (VGRF) in patients with chronic low back
pain (CLBP). CLBP is fairly common, and people with CLBP may have gait patterns different
from asymptomatic people. Higher amounts of variability in performance of movements can be a
product of injury, disease, or aging, and can be a sign that the associated neuromuscular
system is less stable. It was hypothesized that (1) adults with CLBP would show increased
variability in VGRF while walking, as compared to healthy control subjects, and (2) that,
following chiropractic care, adults with CLBP will show decreased variability.
Methods
VGRF data were collected by using a Zebris FDM-T instrumented treadmill with force sensors
underneath the belt, a relatively low cost and convenient method, in which walking speed also
can be easily controlled. Data for 6 control participants were compared to 9 CLBP participants
(independent t-tests), who were also evaluated before and after the first visit of care (dependent
t-tests) and over the course of 7 visits (Repeated Measures ANOVA). Data were collected for
VGRF in stance phase for Mean Standard Deviation (MSD), Mean Coefficient of Variation
(MCV), and the Coefficient of Variation of the rate of loading to the first peak force of stance
phase (Load CV). Also, the magnitudes and CVs of selected gait parameters were collected -
double support percentage, stride length and time, step width, step cadence, and walking speed
– and participants completed pain and disability questionnaires: Quadruple Visual Analog Scale
(QVAS) and Quebec Back Pain Disability Scale (QBPDS). Chiropractic care mainly consisted of
“high velocity low amplitude” thrust (HVLA) type procedures performed using a treatment table
providing drop-section mechanical assistance; other methods included flexion-distraction, pelvic
Results
CLBP participants had somewhat greater variability in MSD, MCV, and gait parameters;
however, only step width CV was statistically higher. From baseline to immediately following the
first treatment session, CLBP participants became slightly less variable in the selected gait
parameters, except for a significant and unexpected increase in step width CV. CLBP
participants also became slightly less variable in MSD and MCV following the first treatment
session, and over the course of 7 visits of care; these were not significantly different, but had
small-to-medium effect sizes. Load CV showed the lowest level of measurement repeatability
for the 3 measures of GRF variability, and produced some confusing, mixed results that were
difficult to interpret. Limitations: Some participants appear to have had no impairment of walking
at baseline and therefore had little room for improvement – an extension of the present project
might require better participant screening and definition of subgroups; Mean Standard Deviation
is an uncommon measure of variability, and more research is needed in this area; again, this
was a pilot study – these results, from a small number of participants seen by a single doctor,
may not be generalizable.
Conclusions
Participants with chronic low back pain had slightly more variability in ground reaction forces
than control participants, and had slight decreases in variability following chiropractic care.
Differences for the main outcome measure of Mean Standard Deviation had small-to-medium
effect sizes but were not statistically significant. With the procedures of this small pilot study as
a guide, more research in this area should be done, with larger groups and improved participant
selection.
Variability of vertical ground reaction forces in patients with chronic low back pain, before and after chiropractic care
Introduction
Because walking is one of the most common and basic movements performed by humans,
interference with the ability to walk may have a significant impact on an individual‟s life. Gait –
the manner or style of walking - can be altered by insufficient passive mobility, muscle
weakness, impaired proprioception and motor control, and pain (Perry & Burnfield, 2010), and
such factors may lead to a higher energy cost for movement and the inability to perform certain
activities of work or daily living.
In the principal author‟s experience as a practicing chiropractor, it is not unusual for patients to complain of gait alterations as part of their decision to see a chiropractor, and many feel “back to normal” after care. It is clear that doctors of chiropractic (DCs) have an interest in gait and
seem to generally believe that their care has a beneficial effect on gait. Many chiropractic
practice web sites on the Internet mention gait; there are published articles available to DCs that
emphasize the importance of gait observation during patient examination (for example, Stude &
Gullickson, 2001; Larson & Bergmann, 2008; Kline, 2009); and many chiropractic textbooks
discuss visual observation of gait as a standard examination procedure (Gatterman, 1990;
Plaugher & Lopes,1993; DeFranca & Levine, 1996; Hammer, 1999; Cox, 1999; Gleberzon,
2001; Haldeman, 2005; Fuhr, 2009). Some textbooks emphasize the role of gait in screening for
neurological disease or the effects of aging, while others imply that some abnormalities will
improve with chiropractic care. However, while chiropractors may use a number of different
modes of patient care, there actually is very little evidence that the primary tool of the DC,
chiropractic “adjustment”, or spinal manipulation, has a beneficial effect on gait.
This pilot study, described below, set out to evaluate the effects of spinal manipulation, and, to a
lesser extent, extremity manipulation, on selected aspects of gait. Presented below, followed by
the study hypotheses, are sections providing background on gait changes associated with low
back pain (LBP), chiropractic and LBP, spinal manipulation and gait analysis, and some
rationale for the use of variability as an outcomes measure.
may be significantly different from procedures commonly referred to as spinal manipulation (or
spinal manipulative therapy, or SMT, or sometimes simply “manipulation”). “Manipulation” usually refers to some method of high-velocity low amplitude thrust (HVLA); “adjustment”
usually implies HVLA with a specific contact point and direction of thrust, but is also sometimes
used to describe non-thrust sustained contact procedures, or even the cumulative end result of
all procedures used in an office visit including mobilization, stretching, or massage-like
techniques. However, the use of the terms manipulation and adjustment is inconsistent in the
existing relevant research, and even among chiropractors themselves, and will therefore be
used interchangeably in this paper.
Gait changes associated with LBP: Design of a study gait evaluation might begin with
identification of a population likely to have gait abnormalities. Many investigators have shown
that patients with LBP may have different patterns of walking from asymptomatic individuals. For
example, individuals with LBP may walk more slowly and take shorter steps (Khodadadeh &
Eisenstein, 1993; Al-Obaidi, Al-Zoabi, Al-Shuwaie, Al-Zaabie, and Nelson, 2003; Lamoth,
Meijer, Daffertshofer, Wuisman, & Beek, 2006), although it isn‟t a universal effect: a recent
study by Newell (2010) found no significant difference in walking speed or step length. Patients
with low back pain may also have significant levels of lumbar erector spinae muscle activity
during the swing phase of the ipsilateral leg (Arendt-Nielsen, 1995; Lamoth, 2006); this is a time
when these muscles normally are mostly inactive, whereas the highest levels of activity usually
occur as body weight is transferred from one foot to the other. Similar patterns of increased
activity have been observed in asymptomatic subjects in whom low back pain has been
temporarily induced by injection with saline solution (Arendt-Nielsen, 1995).
Lamoth (2004; 2006) found changes in coordination between movements of the pelvis and
thorax in LBP patients. For asymptomatic individuals walking at higher velocities, the thoracic
region increasingly rotates out of phase with the pelvis and lumbar spine. For example, as one
exerts the effort to walk faster and faster, and the right leg strides forward, the pelvis and lumbar
spine rotate counterclockwise in the horizontal plane, while the thorax tends to rotate clockwise.
However, this may be different for individuals with low back pain for whom the thoracic region
remains in phase, rotating in the same direction as the pelvis and lumbar spine below, despite
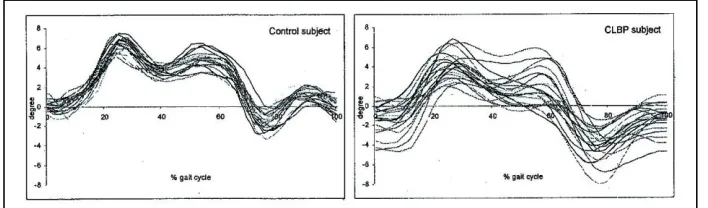
Of particular importance to the present study, Vogt (2001) found a substantial amount of
stride-to-stride variability in movements of the pelvis in patients with chronic LBP (Figure 1), and
commented that patients with low back pain appeared to be “unable to control the quality of the locomotor act normally” (Vogt, 2001). Among the investigators‟ suggested reasons for this was
that proprioception in the lower back might be affected by the low back problems, resulting in
imprecise control over the timing of events in the gait cycle, or that those afflicted by low back
pain might adapt by performing compensatory movements to minimize their efforts.
Chiropractic and LBP: Cherkin, et al, (2002) listed “back symptoms” as the most common
primary reason for visits to chiropractors, comprising between 40-45% of office visits, and there
has been a substantial amount of research showing effectiveness of spinal manipulation for low
back pain (Assendelft, Morton, Yu, Suttorp, & Shekelle, 2004; Licciardone, Brimhall, & King,
2005; Lawrence, et al (2008). However, most studies of SMT and LBP have mainly reached
their conclusions ─ pain relief, decreased disability, and/or patient satisfaction with care ─ on
the basis of questionnaires, without investigation of mechanisms involved. Some examples
include Giles and Mueller (1999), Nyiendo, Haas, and Goodwin (2000), Stig, Nilsson, and
Lebouf-Yde (2001), Hertzman-Miller, et al (2002), Haas, Goldberg, Aickin, Ganger, & Attwood
(2004), Hoiriis, et al (2004), Descarreaux, Blouin, Drolet, Papadimitriou, & Teasdale (2004), and
Hondras, Long, Cao, Rowell, & Meeker (2009). And a recent systematic review concluded that
spinal manipulation has not been shown to be more effective than other methods for treating
LBP (Rubenstein, van Middelkoop, Assendelft, de Boer, & van Tulde, 2011).
However, chiropractors have traditionally believed they are not simply treating pain but that their
care is addressing an articular dysfunction that, in theory, has biomechanical and neurological
components (Lantz, 1989; Lantz, 1990; Henderson, 1995; Vernon, 1997; Evans, 2002). In
[image:7.612.70.424.224.328.2]general, there is a need for additional study of the biomechanical and biological mechanisms
that are related to manipulation, as was outlined in the recent Conference on the Biology of
Manual Therapies, sponsored by the National Center for Complementary and Alternative
Medicine (NCCAM, 2005).
Attempts to learn more about SMT are prompted by common use. In the United States, most
spinal manipulation is provided by chiropractors. Chiropractic is the largest of the professions
classified as complementary and alternative medicine (CAM), and the third-largest health care
profession in the U.S., with more than 190 million estimated 1997 patient encounters
(Eisenberg, et al, 1998). In 2007, almost 4 out of 10 adults (38.3%) had used some type of CAM
in the past 12 months (Barnes, Bloom & Nahin, 2008), with 8.6% receiving manipulation by
either a chiropractor or osteopath (Barnes, 2008).Judging by a U.S. Census Bureau estimation
of the 2007 U.S. population aged 20 and over at 219,259,405, manipulation would have been
used by nearly 18.9 million U.S. adults that year (U.S. Census Bureau, 2009).
Spinal manipulation and gait analysis: There have been several case reports reporting
qualitative improvements in walking following chiropractic care, including those by Alcantara,
Plaugher, & Steiner (1999), Cox & Cox (2005), Legier (2005), Wisdo (2004), and Borcean
(2009). However, there have been few studies using formal recording and analysis of gait data.
Of those, 4 were conducted a couple of decades ago by Herzog and colleagues at the
University of Calgary. In the first 3 studies (Robinson, 1987; Herzog, 1987; Herzog, 1988), a
force platform was used to assess gait symmetry before and after spinal manipulation on
patients with LBP and chronic unilateral decreased interarticular mobility of a sacroiliac joint. In
the final Herzog study (Herzog, Conway, & Willcox, 1991), patients with low back pain and
sacroiliac joint dysfunction were randomized to receive either SMT or to attend back school
therapy sessions with a physical therapist.
In general, many patients in the Herzog studies had little asymmetry before treatment, but for
those patients who did have pre-treatment asymmetry there was a tendency towards improved
symmetry after SMT. The patient group receiving spinal manipulation in the 1991 study (Herzog,
1991) showed increased symmetry, while the back school group became more asymmetrical .
However, the gait patterns of some SMT patients were less symmetrical after treatment. Herzog
admitted this seemed “counterintuitive”, but noted that normal gait is not perfectly symmetrical,
and speculated that some patients may be prone to LBP because of asymmetry in their usual
1988). It may also have been unrealistic to assume that patients with sacroiliac dysfunction or
other causes of LBP will have gait asymmetry. Many of the patients in the above studies had no
more pre-treatment asymmetry than asymptomatic persons (Herzog, 1991). There was also a
later chiropractic study of gait symmetry (Osterbauer, 1993), in which patients received
sacroiliac joint manipulation with an Activator instrument; the patients reported less back pain,
and half reported functional improvement, but there was no significant gait asymmetry, either
before or after treatment.
Wells (1999), reported on a group of patients with Parkinson‟s disease who received a series of
osteopathic manipulative procedures, described more as stretching or mobilization methods,
apparently not very similar to chiropractic adjustment techniques, with most directed at the
extremities rather than the spine. The investigators reported significant increases in stride
length, cadence, and maximum velocities of upper and lower extremities immediately after one
treatment session, but did not conduct any follow-up assessment.
Shrier (2006) measured jump height and sprint times in 17 elite athletes before and after they
received spinal and lower extremity HVLA manipulation by a chiropractor. The researchers
found that “the direction and magnitude of the changes were consistent with a clinically relevant performance enhancement”, but that the differences were not statistically significant because of
the small size of the study and higher than expected inter-participant variability.
In a case report by Smith (2009), one session of chiropractic care by one of the authors resulted
in decreased forward trunk lean and increased running step length in a five year-old patient with
xeroderma pigmentosum (XP), a condition which may be accompanied by problems with motor
control and coordination (Iwakawa, 1990). The authors found the posture and gait changes on
digitized video from a single side-view camera, immediately following a chiropractic adjustment
but did not report any longer-term follow-up information.
Variability: As stated by Crowther, (2008), “A stable movement pattern is a behavioral state that
is reproducible and independent of others and equates to low variability.” We often celebrate
people who are capable of predictable reproduction of certain movements as skilled athletes or
musicians. When such consistency is achieved, the variability is low, and we think of the
performed can be a product of injury, disease, or aging, and when variability increases, the
associated neuromuscular system is considered to be less stable.
Papadakis, et al (2009a) found increased variability in the gait of patients with spinal stenosis,
and a reduction of variability after corrective surgery (Papadakis, et al, 2009b). Increased
variability in gait has also been reported in patients with peripheral arterial disease (Thies,
Richardson, Demott, & Ashton-Miller, 2005; Crowther, et al, 2008), diabetes, with or without
signs and symptoms of neuropathy (Allet, et al, 2009), and several neuromuscular diseases,
including Parkinson‟s Disease and Huntington‟s Disease (Hausdorff, 1998), and cerebellar
ataxia (Ebersbach, 1999), and has been linked to an increased risk of falls in such patients, as
well as elderly persons (Hausdorff, 1997). Detection of increased variability might be useful in
identifying women with early post-menopause and decreased bone mineral density (Palombaro,
et al, 2009). Gait variability in the elderly may be related to muscle weakness and loss of
flexibility (Kang & Dingwell, 2008).
However, there is no universal normal walking pattern for humans; the multiple joints, muscles,
and nerve innervations of the trunk and lower extremities allow for a variety of combinations of
stable movement patterns and for much potential flexibility, important in adapting to changing
conditions or reacting to unexpected events (Bernstein, 1967; Heiderscheit, 2000). There may
be situations for which reduced variability is a sign of pathology. Hamill, van Emmerik,
Heiderscheit & Li (1999) found decreased joint coordination variability in patients with
patellofemoral pain, who seemed to limit themselves to those movement patterns that
minimized pain (Heiderscheit, 2000). Brach, et al, (2005) studied the gait of older persons and
found a greater history of past falls in older persons with both very low and very high amounts of
step width variability, as compared to those with moderate amounts of variability.
So, some variability in human walking is normal (Dingwell, John, & Cusumano, 2009), and there
may be many ways to move one‟s body to take a step. But there are fewer options for how the
foot meets the walking surface if the person is to stay upright and successfully move forward,
and inconsistent movement patterns might not necessarily create inconsistency in forces at the
point of contact with the ground. And pain-related fears and beliefs may contribute to altered
walking mechanics (Al-Obaidi, 2003); efforts by LBP patients to control their walking could result
that laboratory measurements could find decreased variability in ground reaction forces with
LBP.
The focus of this present project is variability in vertical ground reaction forces – that is, a
measurement of consistency of vertical forces with which the feet contact the ground during
walking. The hypotheses are that (1) adults with chronic low back pain will show increased
variability in ground reaction forces while walking, as compared to healthy control subjects, and
(2) that, following spinal manipulation, adults with chronic low back pain will show decreased
variability. The null hypotheses are that patients with CLBP will not appear different from healthy
controls and that SMT will not have an effect on variability, or could even increase variability.
Definitions
Adjustment: Gatterman (1995) defines adjustment as "any chiropractic therapeutic procedure that utilizes controlled force, leverage, amplitude, direction, and velocity and
that is directed at specific joints or anatomic regions", and manipulation more broadly as
“a manual procedure that involves a directed thrust to move a joint past the physiologic
range of motion without exceeding the anatomic limit" (Gatterman, 1995). (See also
“HVLA”, “manipulable lesion”, and “spinal manipulation”, below.
Cadence: in walking, the number of steps per minute (sometimes expressed as the number of strides per minute; see also “stride length and time and step width”, below)
Double support: period in the gait cycle in which both feet are on the ground, one in loading response and the other in pre-swing.
Ground reaction force: In general, a force exerted by the ground in response to the forces a body exerts on it. Specifically for this project, at the same time that a
participant‟s foot contacts the treadmill‟s force platform, an equal and opposite ground reaction force is exerted by the force platform on the participant‟s foot.
HVLA, or “high velocity, low amplitude” spinal manipulation: Although chiropractors
may use a variety of therapeutic interventions, HVLA (or HVLA-SM) is perhaps the most
commonly used chiropractic treatment (Lisi, Holmes, & Ammendolia, 2005). HVLA
involves a quick thrust over a short distance, within a joint's normal range of motion, and
Kinematic analysis: for this proposed project refers to the use of video cameras to record walking and the analysis of the images to describe the extent, speed, and
direction of movement of joints or body segments.
Kinetic analysis: usually refers to the use of highly sensitive in-floor force platforms to record the forces and direction of movement of foot contact during walking. In this
project, we will use a force platform mounted under the walking belt of an otherwise
conventional treadmill.
Loading response: a “double support” phase of walking during which weight is loaded
onto a foot, it begins when that foot contacts the ground and ends when the opposite
foot leaves the ground. During loading response, the ground reaction force typically
rapidly increases in magnitude.
Spinal manipulation: the high velocity, low amplitude procedures employed by chiropractors and, somewhat less commonly, other practitioners of manipulation, such
as osteopaths, physical therapists, or medical doctors. Such procedures may potentially
be applied to any spinal or extremity diarthrodial joint that has been identified as having
a functional, manipulable lesion. (see also “adjustment”, and “HVLA”, above)
Stride length and time, and step width:Stride length is the distance between two successive placements of the same foot. Stride time is the amount time required to
complete one stride. Step width, or walking base, is the side-to-side distance between
the forward progression line of the two feet.
Methods
Participants: For recruitment, the PI first sent an announcement e-mail to friends and
colleagues, and posted flyers on the GSU campus. Potential participants were invited to contact
the PI by phone or e-mail, or to obtain additional information through a website. Subsequently, a
telephone screening was done to establish eligibility. For persons with chronic low back pain,
there were questions regarding location and duration of pain, severity of pain, factors that cause
aggravation of pain, and whether the potential participant had previously had x-rays or other
diagnostic imaging. Potential participants for the control group were required to have no current
low back pain, no known impairment to their ability to walk, and to have never had any
substantial spinal injury. Eligibility for CLBP participants required that they be 21 years of age or
older (2 18-year-olds were accepted into the control group) and have had pain for at least 7
example, Nyiendo, 2000; Al-Obaidi, 2003; Haas, 2004). Participants in both groups must have
not received any chiropractic care or other manipulative therapy in the previous 6 months. CLBP
participants, all of whom had previously seen a doctor or therapist, also were required to either
have already had or be willing to have diagnostic imaging performed. Plans for recruitment and
all other study procedures were approved by the Institutional Review Boards of Georgia State
University and Life University.
This project intended to involve only participants with “mechanical” CLBP, with or without
associated thigh or leg pain. Potential participants were excluded from both groups if they had
referred pain from malignancy or other organic disease; uncontrolled diabetes; osteoporosis or
inflammatory arthritides at more than “mild-to-moderate” levels; arthritis or other painful
conditions of a hip, knee, or ankle joint, such that walking aggravates the condition or elicits
pain; confounding conditions such as extreme obesity, severe scoliosis, significant anatomical
leg length inequality, spinal surgery within the previous 6 months, or spinal manipulation for the
current episode of CLBP; use of pacemakers or other implantable electronic devices;
coagulation disorders or use anticoagulant medications; substantive change in any other
treatment during the course of this study; symptoms or signs of myelopathy, cauda equina
syndrome, or paraparesis; or non-medical reasons such as plans to move out of the area, lack
of a telephone, inability to read English, lack of transportation or inability to walk to the lab, and
third-party liability or worker‟s compensation payments related to the low back pain.
Initial examination and consent: Potential CLBP participants were directed to the private office
of the 4th investigator (KTH). The interactions were mostly done in a manner usual and
customary to a new chiropractic patient in the office, including the completion of new patient
forms, a Quadruple Visual Analog Scale (QVAS), and an initial examination. Specific to the
present study, participants were screened for potential exclusion, and also completed the
Quebec Back Pain Disability Scale (QBPDS) questionnaire and an Informed Consent process.
Control participants went only to the GSU biomechanics lab, where they completed the QVAS
and QBPDS questionnaires and the Informed Consent process. There were 4 CLBP
participants without previous diagnostic imaging who received radiographic examination at no
cost at Life University‟s outpatient clinic (Center for Health and Optimal Performance.)
Gait assessment: Gait evaluation took place in the GSU biomechanics lab by means of a Zebris
Pennsylvania, USA) with a platform of force sensors mounted underneath (Zebris Medical
GmbH, Isny im Allgäu, Germany). On the first visit to the lab, 2 pre-treatment evaluations were
done and the data were later averaged together for a baseline measure; control participants
received only these evaluations. CLBP participants received a post-treatment evaluation on the
first visit to assess short term effects of the first chiropractic adjustment; for each visit to the lab
thereafter, gait evaluations were done pre-treatment only.
Each evaluation was performed with the participant walking at his or her preferred walking
speed (PWS), an average of the upper and lower limits of comfortable speeds, for 30 seconds.
To determine the participant‟s PWS, the treadmill was started at 0.5 miles per hour (0.8 km/h)
and slowly increased until the participant identified a comfortable speed; then, in a similar
manner to that of Kang & Dingwell (2008), the speed was slightly increased and decreased 2 or
3 times, as the participant reported whether the speed was too fast or too slow. This process
also served as a warm-up and acclimation procedure. Once the participant had settled on a
speed that was most comfortable, they were told to walk as “consistently and symmetrically as possible”. Evaluations made at PWS, rather than a single prescribed speed, accommodate
individual differences (e.g., height and leg length, age, physical conditioning). Walking at speeds
above or below PWS may increase the variability of many aspects of gait (Jordan, 2007;
Dingwell 2006). PWS also lends itself to an additional outcome measure, as the chosen walking
speed can be monitored during the course of treatment.
Chiropractic care: All chiropractic care was provided in a room adjacent to the GSU
biomechanics lab. On all visits, the principal investigator conducted a brief exam specific to
chiropractic adjustment and of other areas of particular concern. While a visit to a chiropractor‟s
office might include several different treatment procedures, the main interest in this project was
the effect of “high velocity low amplitude” thrust (HVLA) “manipulative” type adjustment
procedures. Decisions concerning whether to provide manipulative techniques and related
procedures, to what areas, and by what specific methods, are made through assessment of
structural and functional alterations of the neuromusculoskeletal system, and included standing
observation for gross asymmetry of bony alignment and muscle balance, seated motion
palpation for joint glide during movement and restriction of intersegmental “end play” of joints,
and prone static palpation for tenderness, misalignment, and muscle hypertonicity. Adjustment
procedures were directed toward joints perceived to lack normal intersegmental mobility and
hip procedures were usually performed prone, but in some cases supine. All manipulative
procedures were performed using a treatment table providing drop-section mechanical
assistance (Triano, 2000; Peterson & Bergman, 2002).
In some cases, sacroiliac adjustments were supplemented by the use of pelvic wedges, or
“blocks”. These procedures rely on the patient‟s body weight to assist in correcting sacroiliac
joint misalignment, and involve padded wedges placed under the pelvis while the patient lies
passively on the treatment table. Prone procedures have been described by Getzoff, 2003;
supine blocking has been described by Hochman (2005). Some patients also received
flexion-distraction procedures, in which mild traction is applied to an affected level of the lumbar spine
while that region of the spine is simultaneously brought into flexion (Triano, 2000). In some
instances, mildly restricted or aberrant motion in the lumbar spine was treated only with
mobilization at the time of the seated motion palpation. Similarly, restricted motion in the hip
joints was sometimes treated only with mobilization or a sustained stretch at the endpoint of hip
flexion (in the manner of a light stretch of the hamstring muscles) or extension (light stretch of
the psoas or rectus femoris muscles), and sometimes while the participant was positioned over
pelvic wedges. Mild distraction in the lumbosacral region was performed in some instances only
by applying sustained superior-to-inferior pressure to the sacrum while the participant was
positioned over pelvic wedges.
Each CLBP participant was to complete 8 sessions of chiropractic adjustment, to be scheduled
over a 4-6 week period, followed by two additional visits of recommendations for spinal
exercises and future care as individually appropriate. Pain and disability questionnaires were
completed again at the 5th and 9th visits.
Participant compensation: Control group participants received a Wal-Mart gift card worth $25 for
their single visit to the biomechanics lab, as did a CLBP participant who did not continue beyond
the first visit. CLBP participants who completed the recommended series of visits received $75
in Wal-Mart gift cards. And, although most participants walked to the lab from other parts of the
GSU campus, 2 participants received compensation for parking fees.
Data and analysis: The force sensor array of the Zebris treadmill records vertical components,
but not the horizontal components, of each step‟s ground reaction force (GRF) every 2
interval of recording (default 30 seconds.) Several gait parameters were analyzed: double
support percentage, stride length, stride time, step width, cadence (strides per minute), and
walking speed. Double support is a period when body weight is transferred from one limb to the
other, and the time spent in double support may increase if the individual feels unstable in
standing or walking. An individual who feels uncertain in their walking may tend to take shorter
steps (1 stride = 2 steps) and may tend to walk with their feet wider apart (increased step width),
and may tend to walk more slowly. Stride time is the amount of time required to complete one
stride; cadence is a count of the number of strides or steps per minute. Walking speed was not
recorded directly from the treadmill at the time of assessment but was calculated retrospectively
from the formula (Whittle, 2007):
walking speed (m/sec) = stride length (m) / (120 / cadence (steps/min) )
Measurements can vary from one person to another according to height, weight, age, strength,
or other factors. For actual magnitudes of gait parameters, in order to correct for possible effects
of height differences, corrections were made to mean values for stride length, stride time, step
width, and walking speed (Table 3), using formulae summarized by Hof (1996). Variability of gait
parameters was assessed by using Coefficients of Variation (CV), the standard deviation (SD)
divided by the mean, calculated for each gait parameter of each participant on each
assessment. The CV scales the SD to the mean, and results in a percentage that is useful in
[image:16.612.73.541.453.623.2]comparing data sets with large differences in means.
Figure 2: Graphic depiction of stance phase vertical ground reaction forces (GRFs) for 2 CLBP participants, both for the right foot during the 2nd baseline recording. The tracings for approximately 26 steps by participant #4, on the left, appear to be among the more consistent for the CLBP group; the tracings for approximately 31 steps by participant #9 show less consistency (more step-to-step variability) and appear more typical for this group. Stance phase begins with heel strike at the 0% point and GRFs increase during loading phase to the first peak force at A; on average, this was at about the 24th interval (24%) for #4, and about 32% for #9. GRFs decrease slightly to mid stance at B (#4: 51%, #9: 58%), and increase again to the 2nd peak force of “push-off”, at C (#4: 75%, #9: 78%).
A B C
An ASCII export of force data were analyzed by MATLAB programs written by the 3rd
investigator. First, the force data for the stance phase of gait was distributed into 100 intervals
(percentile units, Figure 2). From there, calculations were done for the mean force and SD for
each interval, and then averaged to find the Mean Standard Deviation (MSD) over all of stance
phase. Kang and Dingwell (2008) used the MSD in a recent kinematic variability study; their
method has been adapted here for vertical GRFs, which does not appear to have been done in
any previous study. The Coefficient of Variation for the force in each subinterval also was
calculated, and then averaged over all of stance phase to find the Mean Coefficient of Variation
(MCV).
MSD is the main outcome measure of this study but MCV for stance phase was a secondary
measure. MCV is a more common measure of variability in gait than the MSD, having been
used in previous investigations (for example, Winter, 1984; Vogt, Pfeifer, Portscher, & Banzer,
2001; O‟Dwyer, Smith, Halaki, & Rattanaprasert, 2009). However, Jon Dingwell (personal
communication) argued against the use of MCV over the span of a curve because CVs can be
spuriously high at times when the mean is low. Relative to vertical GRFs, this could happen in
the intervals just after initial contact or just before toe off (Figure 2).
The MATLAB program also was used to calculate loading rates to the first peak force (the
magnitude of the first peak force for each step‟s stance phase divided by the amount of time
required to achieve that force), then to determine the Coefficient of Variation for the mean
loading rate (Load CV) during the 30 seconds of recording.
Data were analyzed for gait parameters, MSD, MCV, and Load CV as follows:
Comparisons between the control and CLBP participants. Data comparisons between
groups were made with 2-tailed independent t-tests.
CLBP individuals immediately pre- and poscare on the first visit, using dependent
t-tests.
CLBP individuals over the course of 7 sessions of chiropractic care (with an 8th
assessment following the final treatment visit.) Comparisons were made using repeated
measures ANOVA.
For all analyses, the alpha level was set at .05. Additionally, for the repeated measures ANOVA
require an F ratio of 3.79 or above; 7 participants completing outcomes questionnaires on 3
visits would require an F ratio of 5.14 (or 4.74 if all 8 had completed the questionnaires).
Participants‟ repeated measures data were examined using Mauchly‟s test of sphericity; for
Mauchly significance values below .05, sphericity was assumed to be violated and a
Greenhouse-Geisser correction was used to determine F-ratios and levels of significance for
tests of within subjects effects.
Effect sizes: Statistical significance has commonly been judged by whether p-values are below
.05 (i.e., there is at least a 95% likelihood that the results are not simply due to chance.) As
stated by Valentine and Cooper (2003), “Outcomes receiving a statistically significant result are
treated as being big, important effects, while outcomes that turn out not to be statistically
significant are treated as being unimportant… [However] statistical significance tells us very little
(if anything) about the practical significance or relative impact of the effect size, and should not
be used as a stand-alone measure of how much the intervention „matters.‟ ” (Valentine & Cooper, 2003) For t-tests, a common measure of effect size is to use Cohen‟s d, by calculating
the difference between the means of two groups and divide by the standard deviation of the
control group (or pre-measurement) or, as was done in the present study, by the pooled
standard deviation of the control and treatment groups. Cohen (1988) suggested general
guidelines of: d = 0.2 indicated a “small effect”, d = 0.5 a “medium effect”, and d = 0.8 a “large
effect”.
For measuring effect size from ANOVA, Levine & Hullett (2002), along with an uncountable
number of non-peer-reviewed online sources, recommend eta-squared (η2) as an appropriate
statistic, and generally recommend against the use of partialη2 (which is reported in SPSS);
they provide the following formulas for calculation of η2:
η2 = Sum of Squares
Between/ Sum of Squares Total
η2
= Sum of Squares Between/ Sum of Squares Between + Sum of SquaresError
Calculation of η2 was performed by hand from values provided by SPSS Repeated measures
ANOVA output. Calculation of η2 was done only for Mean Standard Deviation [because MnCV
and loading CV were calculated using decimal equivalents of percentages, the SPSS outputs
Reliability of measures for variability: As noted above, baseline measurements for each
participant were averages of the 1st and 2nd treadmill assessments. However, a large difference
between the 1st and 2nd values might cast some doubt on the reliability of subsequent
measurements. Therefore, correlations between the 1st and 2nd baseline values for MSD, MCV,
and Load CV were calculated using Intraclass Correlation Coefficients.
Results
Participant inclusion/exclusion, and baseline characteristics (Tables 1 & 2): Of 11 adults with
chronic back pain screened by telephone, 1 had middle back pain only and 1 could not travel to
the lab. Nine participants completed the initial paperwork and examination, but 1 did not
continue beyond the first assessment and treatment session. The remaining 8 CLBP
participants each completed at least 7 of the 8 planned treatment sessions. Some of their
individual characteristics can be seen in Table 1. Overall they present some variety in causative
factors and manifestation of pain effects, as might be seen in a typical chiropractic practice or
back pain clinic. However, some were relatively young and “fit” with low levels of disability and
little impairment of their walking ability at the beginning of the study.
All 8 adults screened for the control group completed treadmill assessments. However, 2 were
excluded from analysis because it was felt their data would not be representative of the gait of
normal individuals, because of external sources of variability: 1 exhibited repeated accessory
movements (turning head to talk, clothing readjustments, once reaching to change treadmill
speed mid-assessment); the other was a “toe-walker”, without a typical pattern of heel strike,
Comparison of CLBP participants to Control group (Tables 2, 3, 4, & 5): At baseline, the CLBP
participants were slightly older and heavier than the control group, though not significantly so,
and they had significantly greater scores for pain and disability (Table 2). No attempt was made
to age-match or gender-match the groups.
Table 1: Characteristics of individual CLBP participants, including pain and disability scores at baseline and follow-up, for the Quadruple Visual Analog Scale (QVAS) and the Quebec Back Pain Disability Scale (QBPDS). Baseline scores are presented for each CLBP participant as an examination of a need for subgrouping in future research; only 8 participants completed the 2nd set of questionnaires, 7 completed the 3rd set.
Participant #,
gender, age Comments on clinical history and gait
QVAS QBPDS
1 2 3 1 2 3
1 M 26 Several episodes of back pain related to military
service; accustomed to working through pain. 6.5 34
2 F 63
Back pain and effect on walking complicated by spinal fractures from auto accident 30 years earlier.
5.5 3.75 4.5 57 28 29
3 M 46
Long-standing disc protrusion and lumbar instability; slow, cautious movements; exercise-related reinjury late in study, with severe pain.
4.75 3 25 21
4 M 35
Athletic injury; mild lumbar disc degeneration; nerve-related muscle weakness produced mild foot “slap” following heel strike.
2.9 1.5 1.75 23 10 4
5 F 31
Back pain since childbirth; approximate 5mm anatomical leg length inequality diagnosed by principal investigator, untreated till later.
4.9 4.75 4 25 18 16
6 F 28
Pain aggravated by prolonged standing had minimal effect on walking; fastest speed of all participants, including controls.
3.75 2.75 3.25 6 4 6
7 F 23
Chronic back pain from multiple falls but minimal effect on gait; uses 1/8” heel lift for anatomical leg length inequality.
3.4 3.75 2.75 34 32 24
8 F 30
Slow walking speed; complicated by moderate rheumatoid arthritis in hip; gait possibly affected late in study by ankle pain.
3.75 2.75 2.25 28 21 20
9 F 42
Chronic sciatic pain and sacroiliac discomfort affect walking; hit by car as a pedestrian 25 years earlier.
Table 3: Baseline gait parameters for control (n=6) and chronic low back pain (n=9) groups. There were no significant differences. Comparisons between groups were made with 2-tailed, independent t-tests.
A: Actual magnitudes of selected parameters.
% double support
Stride length, m
Stride
time, sec Step width, m
Cadence, steps/min
Walking speed, m/sec
CON 25.2 (1.9) 1.23 (0.09) 1.08 (0.07) 0.13 (0.02) 111.9 (7.4) 1.14 (0.1) CLBP 27.1 (3.9) 1.25 (0.19) 1.10 (0.16) 0.11 (0.05) 111.4 (15.8) 1.18 (0.3)
p = .29 -1.8 – 5.6
p = .73 -.15 – .21
p = .78 -.13 – .17
p = .26 -.06 – .02
p = .95 -15.5 – 14.6
p = .78 -.23 – .31
B: Stride length (l), stride time (t), step width (w), and walking speed (s) scaled to participant height. Conversion formulae, per Hof are stated next to each parameter value, which are dimensionless ratios.
Scaled stride length Scaled stride time Scaled step width Scaled walking speed
CON
ls = l / l0
.69 (.05) t s = t /
SQRT(l0/g)
2.53 (.13)
ws = w / l0
.07 (.01) ss = s /
SQRT(l0*g)
.27 (.02)
CLBP .74 (.10) 2.63 (.40) .07 (.03) .29 (.07)
p = .35 -.05 – .14
p = .56 -.26 – .47
p = .39 -.02 – .12
p = .66 -.05 – .08
CLBP participants spent a slightly higher percentage of their gait cycle in double support (Table
3A); however, the difference was not significant. And, contrary to expectations, the CLBP
participants had a longer stride length, a narrower step width, and a faster walking speed than
the control group; neither these nor differences in stride time or cadence were significantly
different. But because individual body height and leg length play roles in some measurements,
stride length, stride time, step width and walking speed values were scaled to account for each
individual‟s body height (Table 3B); with those corrections made, there still were no significant
differences between the groups.
Table 4 displays the Coefficients of Variation (CV) that were calculated for each individual‟s
baseline values for the gait parameters discussed above except walking speed. Walking speed
was assumed to have been held constant by the treadmill and therefore to not vary. CLBP
Table 2: Baseline characteristics of participants for the control group (CON, n=6) and CLBP group (n=9). Comparisons between groups were made with dependent t-tests. The 95% Confidence Intervals for differences between means are listed below p values.
gender age height (m) weight (kg) BMI QVAS QBPDS
CON 4M, 2F 28.3 (13.3) 1.77 (0.1) 70.45 (13.6) 22.1 (2.4) 0.4 (0.5) 1.0 (1.1) CLBP 3M, 6F 36.0 (12.5) 1.70 (0.1) 76.16 (18.7) 25.9 (5.0) 4.3 (1.2) 26.8 (14.9)
p = .28
-6.97 – 22.30 p = 0.17 p = 0.53
p = .11 -0.94 – 8.60
p < .001 2.95 – 4.90
participants exhibited more variability in all parameters but were significantly different only in
[image:22.612.70.550.172.256.2]step width.
Table 4: Baseline coefficients of variation for selected gait parameters. The CVs for step width were significantly different (*) between groups. Comparisons of groups were made with 2-tailed, independent t-tests. The 95% Confidence Intervals for differences between means are listed below p values.
% double support Stride length Stride time Step width Cadence
CON 4.05% (0.95) 1.27% (0.26) 1.15% (0.15) 9.89% (2.66) 1.15% (0.15) CLBP 4.13% (1.20) 1.63% (0.78) 1.55% (0.59) 19.45% (6.36) 1.55% (0.59)
p= .90 -1.2 – 1.3
p= .30 -.36 – 1.1
p= .13 -.06 – .87
* p= .004 3.6 – 15.5
p= .09 -.07 – .86
Values may be seen in Table 5 for Mean Standard Deviations (MSD) and mean Coefficients of
Variation (MCV) and Coefficients of Variation for loading rate (Load CV). MSDs and MCVs for
both the left and right limbs were higher for the low back pain participants, though not
significantly so. Results of Load CV were mixed, with the CON participants higher for the left
[image:22.612.71.558.431.513.2]side and the CLBP participants higher for the right side.
Table 5: Comparison of baseline MSD, MCV, and Load CV values for CLBP and control participants. The 95% Confidence Intervals for differences between means are listed below p values. Differences between groups were calculated with 2-tailed, independent t-tests. There were no significant differences.
MSD left, N MSD right, N MCV left, % MCV right, % Load CV left, % Load CV right %
CON 23.5 (5.7) 24.2 (6.1) 4.9 (0.6) 5.0 (0.6) 11.5 (6.1) 8.6 (1.8) CLBP 28.9 (8.3) 27.7 (7.0) 6.1 (1.7) 5.8 (1.3) 8.3 (2.5) 9.2 (2.8)
p= .19 -3.0 – 13.8
p= .33 -4.1 – 11.1
p= .09 -0.2 – 2.6
p= .16 -0.4 – 1.9
p= .19 -9.5 – 3.2
p= .69 -2.3 – 3.4
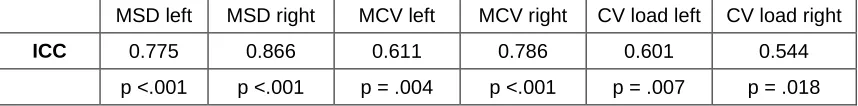
Consistency of 1st and 2nd treadmill assessments: For the 3 measures of variability, MSD values
had the highest level of agreement, with “almost perfect” agreement between the 1st and 2nd
right side assessments. The 1st and 2nd Load CV values agreed only moderately.
Table 6: Agreement between 1st and 2nd treadmill assessment baseline measures. Intraclass Correlation Coefficients are for 2-way mixed, absolute agreement, single measures. ICC values between 0.5 – 0.6 indicate moderate agreement, 0.7 – 0.8 strong agreement, > 0.8 almost perfect agreement.
MSD left MSD right MCV left MCV right CV load left CV load right
ICC 0.775 0.866 0.611 0.786 0.601 0.544
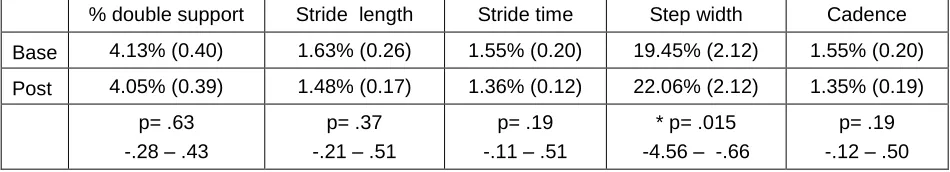
[image:22.612.67.496.663.716.2]Pre-post first treatment session for CLBP group(Tables 7, 8, 9):Of the gait parameters
analyzed, CLBP participants showed a statistically significant decrease in step width, from a
mean of .11 meters to .10 meters (Table 7). There were slight, non-significant decreases in
double support and stride time, and non-significant increases in stride length, cadence, and
walking speed.
Table 7:Comparison of baseline measures ofselected gait parameters post- assessment immediately after the first treatment session for the chronic low back pain group (n=9). Differences were calculated with 2-tailed, dependent t-tests. The 95% Confidence Intervals for differences between means are listed below p values. Step width was significantly different from base to post (*).
% double support
Stride length, m
Stride time,
sec Step width, m
Cadence, steps/min
Walking speed, m/sec
Base 27.1 (3.9) 1.25 (0.2) 1.10 (0.2) 0.11 (0.05) 111.4 (15.8) 1.18 (0.3) Post 26.8 (3.8) 1.26 (0.2) 1.09 (0.2) 0.10 (0.04) 112.5 (17.0) 1.20 (0.3)
p = .54 -.86 – 1.5
p = .85 -.07 – .06
p = .46 -.02 – .04
* p = .02 .002 – .02
p = .43 -4.2 – 2.0
[image:23.612.66.541.453.539.2]p = .63 -.11 – .07
Table 8: Comparison of baseline measures of Coefficients of Variation for selected gait parameters post- assessment immediately after the first treatment session for the chronic low back pain group (n=9). Differences were calculated with 2-tailed, dependent t-tests. The 95% Confidence Intervals for
differences between means are listed below p values. CVs for step width were significantly different (*), showing increased variability immediately post-treatment.
% double support Stride length Stride time Step width Cadence
Base 4.13% (0.40) 1.63% (0.26) 1.55% (0.20) 19.45% (2.12) 1.55% (0.20)
Post 4.05% (0.39) 1.48% (0.17) 1.36% (0.12) 22.06% (2.12) 1.35% (0.19)
p= .63 -.28 – .43
p= .37 -.21 – .51
p= .19 -.11 – .51
* p= .015 -4.56 – -.66
p= .19 -.12 – .50
When gait parameters were examined according to Coefficient of Variation (Table 8), variability
was decreased by a statistically non-significant amount for double support, stride length, stride
time, and cadence, following the first chiropractic session. However, the CV for step width was
significantly increased.
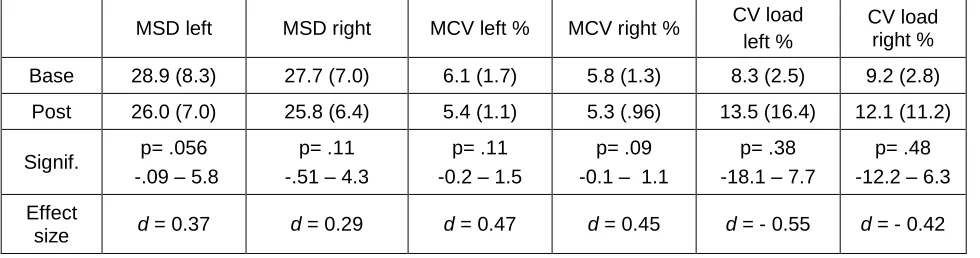
An analysis of the variability of vertical ground reaction forces for the CLBP participants from
baseline to immediately after the first chiropractic adjustment (Table 9) showed a slight
the Mean Coefficient of Variation; these were statistically non-significant, with a small effect size
for MSD, and a small-to-medium effect size for MCV. However, the CV of loading rate
[image:24.612.66.556.211.340.2]increased, though by a statistically insignificant amount, with small-to-medium effect size.
Table 9: Comparison of baseline measures to post- assessment immediately after the first treatment session for Mean Standard Deviations (MSD) and Mean Coefficients of Variation (MCV) for the force curves of stance phase and Coefficients of Variation for loading rate (CV load) to the first peak force. The 95% Confidence Intervals for differences between means are listed below p values. Differences were calculated with 2-tailed, dependent t-tests; there were no significant differences.
MSD left MSD right MCV left % MCV right % CV load left %
CV load right %
Base 28.9 (8.3) 27.7 (7.0) 6.1 (1.7) 5.8 (1.3) 8.3 (2.5) 9.2 (2.8)
Post 26.0 (7.0) 25.8 (6.4) 5.4 (1.1) 5.3 (.96) 13.5 (16.4) 12.1 (11.2)
Signif. p= .056 -.09 – 5.8
p= .11 -.51 – 4.3
p= .11 -0.2 – 1.5
p= .09 -0.1 – 1.1
p= .38 -18.1 – 7.7
p= .48 -12.2 – 6.3
Effect
size d = 0.37 d = 0.29 d = 0.47 d = 0.45 d = - 0.55 d = - 0.42
Measures for CLBP participants over a course of care (Tables 10, 11, 12, & 13; Figures 3 & 4):
The original plan for the study was for participants to complete 8 treatment sessions and for a
final treadmill assessment to be done on the 9th visit to the lab; however, some only completed 7
treatment sessions and 8 treadmill assessments.
Outcomes measures questionnaires: As a group, the 7 participants who completed all 3
questionnaires showed a significant improvement in pain and disability (Table 10). There was
some inconsistency noted with a participant (#9) who scored a 31 when completing the QBPDS
verbally in a telephone screening but only a 9 upon completing a written version of the
questionnaire; another (#6) scored the final set of questionnaires at a higher level than was
expected, compared to verbal reports given to the PI, and at a higher level than the same
participant‟s 2nd set of questionnaires. And as stated above, one participant (#3) completed a
final treatment session but did not return for the final set of questionnaires; in Table 10, below, 2
versions of mean scores for the questionnaires are presented: the first as they actually were
collected, the second with an estimation for the missing final set (8 QVAS; 80 QBPDS), based
Table 10: Follow-up means, standard deviations, and ANOVA results for QVAS and QBPDS scores for CLBP participants. The top set of scores includes only those 7 participants who actually completed the 3rd set of questionnaires. The bottom set uses estimated scores for the 3rd set for participant #3 (see text.)
CLBP (n=7) QVAS 1 3.9 (0.9) QBPDS 1 26.0 (17.0)
QVAS 2 3.1 (1.0) QBPDS 2 16.6 (11.4)
QVAS 3 2.9 (1.0) QBPDS 3 14.3 (10.8)
ANOVA: sphericity assumed
F(2, 12) = 10.83, p= .002 F(2, 12) = 8.83, p= .004
CLBP (n=8) QVAS 1 4.0 (0.9) QBPDS 1 26.9 (15.7)
QVAS 2 3.1 (1.0) QBPDS 2 17.1 (10.6)
QVAS 3 3.6 (2.2) QBPDS 3 22.5 (25.3)
ANOVA: sphericity violated, Greenhouse-Geisser correction used
F(1.18, 14) = 1.57, p= .25 F(1.19, 14) = 0.79, p= .42
Regarding aggravation of pain and adverse events: Recurrence is a feature of CLBP. Some
participants reported recurrences during the study, during events such as an uncomfortable
airplane trip, an awkward step while running, a sense of something “going out” during an
unfamiliar exercise, increased aching with changes in the weather - instances in which the
causes were clearly unrelated to research procedures. There also were 2 participants for whom
exercise unrelated to the study caused recurrences; and they each experienced further increase
in pain later, with timing such that possible aggravation by spinal manipulation cannot be
completely ruled out. One of these instances was intense but temporary, involving an individual
performing weightlifting nearly equal to her body weight. The other was the participant
mentioned above as not completing the final set of questionnaires. He had pre-existing spinal
degeneration and reported increased back pain shortly after beginning an exercise program
outside the study, sometime around the 6th treatment visit. He later reported by e-mail that he
had experienced increased back pain and muscle spasm, and had seen an orthopedist, had an
MRI, and was seeing a physical therapist.
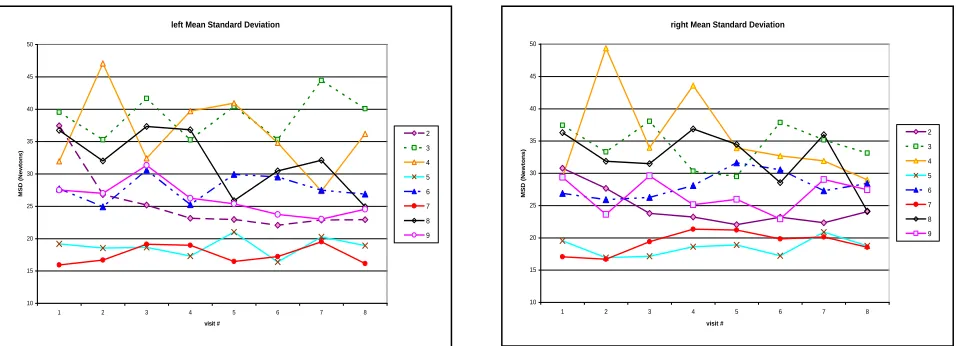
Variability of vertical ground reaction forces: Three measures of variability over the force curve
of stance phase may be seen for the CLBP group in Table 11, and include group means for
each of 8 treadmill assessments. According to the values for Mean Standard Deviation,
lower limbs, from the first assessment to the last, with some ups and downs in between (Table
11 and Figure 3). There is an overall downward trend; the differences were not statistically
significant (Table 12) but had a small effect size (Table 13). MSD scores for individual
participants can be seen in Figure 4. Variability as measured by Mean Coefficient of Variation
and by Load CV also decreased slightly (Table 11), by non-significant amounts (Table 12). The
effect sizes were not calculated for MCV and Load CV; because these were calculated in
[image:26.612.63.553.250.572.2]percentages, the Sum of Squares for each was reported by SPSS as “.000”.
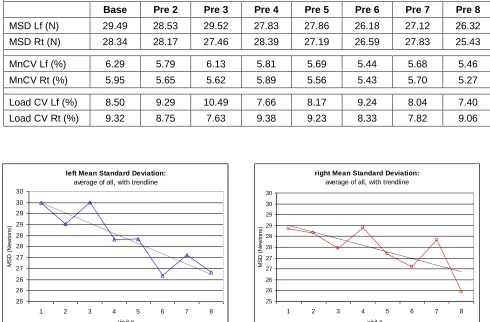
Table 11: MSD), MCV, and Load CV mean values for 8 participants over the course of 7 visits of chiropractic care (assessments done pre-care each visit).
Base Pre 2 Pre 3 Pre 4 Pre 5 Pre 6 Pre 7 Pre 8
MSD Lf (N) 29.49 28.53 29.52 27.83 27.86 26.18 27.12 26.32 MSD Rt (N) 28.34 28.17 27.46 28.39 27.19 26.59 27.83 25.43
MnCV Lf (%) 6.29 5.79 6.13 5.81 5.69 5.44 5.68 5.46
MnCV Rt (%) 5.95 5.65 5.62 5.89 5.56 5.43 5.70 5.27
Load CV Lf (%) 8.50 9.29 10.49 7.66 8.17 9.24 8.04 7.40 Load CV Rt (%) 9.32 8.75 7.63 9.38 9.23 8.33 7.82 9.06
left Mean Standard Deviation:
average of all, with trendline
25 26 26 27 27 28 28 29 29 30 30
1 2 3 4 5 6 7 8
visit # M S D ( N e w to n s )
right Mean Standard Deviation:
average of all, with trendline
25 26 26 27 27 28 28 29 29 30 30
1 2 3 4 5 6 7 8
[image:26.612.73.558.251.378.2]visit # M S D ( N e w to n s )
Table 13: Effect sizes (η2 values) for Repeated Measures ANOVA for the main outcome measure, Mean Standard Deviation. “SS” is “Sum of Squares”.
variability measure Treatment SS Error SS (w/n subjs) Error SS
(b/t subjs) SS Total η 2
Left MSD 92.78 709.08 3289.83 4091.69 0.023
[image:27.612.63.541.88.261.2]Right MSD 57.73 695.55 2346.01 3099.29 0.019
Table 12: Results of Repeated Measures ANOVA for MSD, MCV, and load CV for 8 participants over the course of 7 visits of chiropractic care (8 assessments.) Significant differences
between means would require an F ratio of 3.79 or above. None of the analyses showed a
significant difference.
Mauchly F-ratio Significance
MSD Lf * .012 .916 .448 F(2.9, 20.3) = .92, p= .45
MSD Rt .239 .581 .768 F(7, 49) = .58, p= .77
MCV Lf * .020 1.72 .309 F(3.1, 21.3) = 1.72, p= .31
MCV Rt .299 .903 .469 F(7, 49) = .90, p= .47
Load CV Lf * .023 .831 .484 F(2.78, 19.2) = .83, p= .48 Load CV Rt .444 1.05 .412 F(7, 49) = 1.05, p= .41
“Mauchly” is the p-value for Mauchly‟s test of sphericity; for Mauchly significance values below .05 (*) sphericity was assumed to be violated and a Greenhouse-Geisser correction was used to determine F-ratios and levels of significance for tests of within subjects effects.
left Mean Standard Deviation
10 15 20 25 30 35 40 45 50
1 2 3 4 5 6 7 8
visit # MSD (Newton s) 2 3 4 5 6 7 8 9
right Mean Standard Deviation
10 15 20 25 30 35 40 45 50
1 2 3 4 5 6 7 8
visit # M S D ( N e w to n s ) 2 3 4 5 6 7 8 9
[image:27.612.67.511.369.495.2]Discussion
The hypotheses of this study, that (1) adults with chronic low back pain will show increased
variability in ground reaction forces, and (2) adults with chronic low back pain will show
decreased variability following spinal manipulation, presume that patients with chronic low back
pain will have impairment of gait, and that increased variability is “bad” and decreased variability is “good”. Some findings of this study support the hypotheses; many do not.
In comparison to baseline measures of the control group, CLBP participants had somewhat
greater variability in the selected gait parameters; however, only step width was significantly
different. CLBP participants had higher MSD and MCV values, but neither was significantly
different. On the other hand, it might be expected that people with an impaired ability to walk
might walk more slowly and take shorter, wider steps, and this was not the case for these CLBP
patients, compared to the control group. From baseline to immediately following the first
treatment session, CLBP participants became slightly less variable in the selected gait
parameters, except for a significant increase in step width CV. CLBP participants also became
slightly less variable in MSD and MCV following the first treatment session; these were not
significantly different, but had small-to-medium effect sizes. And there was a downward trend for
MSD and CV over a short course of care; these were not significantly different from baseline to
the final assessment but, again, had small-to-medium effect sizes.
The other measure of variability in this study, the CV of loading rate to the first peak force,
produced some confusing, mixed results that are difficult to interpret. To complicate matters,
Load CV also showed the lowest level of measurement repeatability for the 3 measures of GRF
variability. These issues may deserve more research in the future.
It is simplistic to equate variability with impaired performance. As discussed above, some
degree of gait variability is normal; upper and lower limits have not been established for GRF.
However, there are individual cases in this study that suggest decreased variability is
associated with treatment improvements. Figure 5 shows some of the left side GRF tracings for
the oldest participant of the CLBP group (#2), who had longstanding back pain that affected her
walking. She reported subjective functional improvement from her first session of care, and
there is a qualitative change in consistency of the force patterns immediately afterward. In the
impressions of the graphs match the MSD data graph for participant #2 in Figure 3. It‟s
important to emphasize that the 1st visit pre-post graphs in Figure 5 represent the greatest
contrast of all 1st visit pre-post comparisons for the study, and is not typical. Figure 6 illustrates a
pre-post-final set of force curve graphs for a participant (#7) who reported no subjective
improvement and had very little change in MSD over the course of care (Figure 3). Despite low
back pain and a history of injury, this participant was, at baseline, able to function at a high level
of physical performance and had no apparent impairment of walking at the beginning of the
study.
Limitations: LBP is not a homogenous problem and individuals differ in their causative factors
and response to care. Some individuals in this project appeared to have had no impairment of
[image:29.612.84.546.239.366.2]walking ability at baseline and therefore had little room for improvement. For this pilot study,
Figure 5: Participant #2, who had a very high level of left side GRF variability at baseline (image on left), appeared to be much more consistent immediately after the initial treatment session (middle), with slight additional consistency through the 7th assessment (right).
[image:29.612.74.540.437.563.2]some limitations of time and personnel resulted in acceptance of all potential CLBP participants
who contacted the PI. An extension of the present project might require better participant
screening and definition of subgroups; perhaps limited to participants with sciatic nerve
involvement or signs of impaired walking, with use of a screening questionnaire for lower
extremity dysfunction or an appropriate minimum score of the QBPDS. If there is an effect of
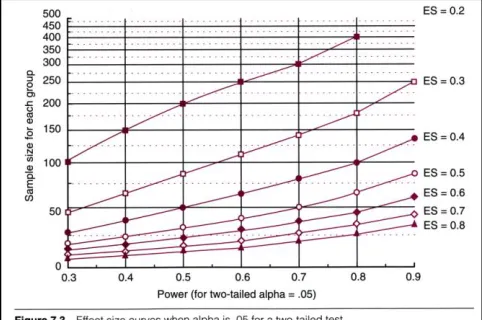
manipulation to be documented, the choice of population matters: according to the pre-post
effect sizes in Table 9, and at a power of 0.8, the slight improvement seen in the participants of
the present small pilot project would require extension of the study to 100-200 participants to
show statistical significance (Figure 7).
In restricting participants to receiving only manipulation or associated light mobilization and
stretching of the lumbar spine, sacroiliac joints, and hips, the principal investigator modified
some aspects of his usual methods of practice. While this may have limited some confounding
issues of multiple treatment procedures, in the opinion of the PI most of the participants would
have benefited from beginning therapeutic exercises earlier than the study design called for.
Additionally, some had mild foot, ankle, or knee problems that could have affected their gait and
could have been addressed by manual methods; one participant would have benefited from an
in-shoe heel lift to compensate for an anatomical leg length inequality. These participants could
have been excluded – such problems are listed in the exclusion criteria – but the symptoms
were not severe and the CLBP group is small even with these participants included. Future
research in this area needs to better address such confounding factors either through treatment
[image:30.612.72.313.263.423.2]or exclusion.