Does Adding Manpower Also Affect Quality? An Empirical,
Longitudinal Analysis
Andrew Meneely
North Carolina State University 890 Oval Drive, EB2 Box 8206 Raleigh, North Carolina, USA 27695[email protected]
Pete Rotella
Cisco Systems, Inc. 7025 Kit Creek Rd. Bldg. 10 Research Triangle Park, NC 27709[email protected]
Laurie Williams
North Carolina State University 890 Oval Drive, EB2 Box 8206 Raleigh, North Carolina, USA 27695[email protected]
ABSTRACT
With each new developer to a software development team comes a greater challenge to manage the communication, coordination, and knowledge transfer amongst teammates. Fred Brooks discusses this challenge in The Mythical Man-Month by arguing that rapid team expansion can lead to a complex team organization structure. While Brooks focuses on productivity loss as the negative outcome, poor product quality is also a substantial concern. But if team expansion is unavoidable, can any quality impacts be mitigated? Our objective is to guide software engineering managers by empirically analyzing the effects of team size, expansion, and structure on product quality. We performed an empirical, longitudinal case study of a large Cisco networking product over a five year history. Over that time, the team underwent periods of no expansion, steady expansion, and accelerated expansion. Using team-level metrics, we quantified characteristics of team expansion, including team size, expansion rate, expansion acceleration, and modularity with respect to department designations. We examined statistical correlations between our monthly team-level metrics and monthly product-level metrics. Our results indicate that increased team size and linear growth are correlated with later periods of better product quality. However, periods of accelerated team expansion are correlated with later periods of reduced software quality. Furthermore, our linear regression prediction model based on team metrics was able to predict the product’s post-release failure rate within a 95% prediction interval for 38 out of 40 months. Our analysis provides insight for project managers into how the expansion of development teams can impact product quality.
Categories and Subject Descriptors
D.2.8 [Software Engineering]: Metrics – process metrics, product metrics.
General Terms
Measurement, Human Factors
Keywords
Longitudinal analysis, team expansion metric, modularity, Brooks’ Law, developer, linear regression,
1.
INTRODUCTION
With each new developer to a software development team comes a greater challenge to manage the communication, coordination, and knowledge transfer amongst teammates. Lack of team cohesion, miscommunications, and misguided effort can all lead to problems in the software product.
Following a similar line of reasoning, Fred Brooks discusses the challenge of team expansion directly in his widely-known book, The Mythical Man-Month [4]:
“…training cannot be partitioned, so this part of the added effort varies linearly with the number of workers. […] The added effort of communicating may fully counteract the division of the original [development] task.”
“Adding manpower to a late project makes it later.”
The latter quote is known as “Brooks’ Law.” While Brooks was specifically discussing effort estimation and productivity, one could apply a similar argument to software quality. Too many new developers in a short period of time can potentially lead to problems, such as inconsistent implementation or poor system integration.
But is team expansion an unavoidably high risk? Or can successful development teams undergo healthy growth as the product progresses? Risk management practices often account for new teammates [18], so teams can plan ahead for some developer turnover and handle it gracefully.
Furthermore, the structure of the team as it expands can also affect software quality. Brooks describes software development as “an exercise in complex interrelationships” [4], and describes the development team as a socio-technical network of communication and coordination (a structure since defined as a developer network [2], [7], [9], [10], [13], [19]). When the team organization becomes too complex, collaboration suffers. For instance, developers may choose to only collaborate on code within their own department and avoid developing across departments, despite the advantage of having the added perspective from other departments.
Therefore, if team expansion is a high risk, what are the elements of team expansion that can be mitigated? An analysis of software quality inspired by Brooks’ Law must take into account team size, how fast the team expands, and team structure over time. Our research objective is to guide software engineering managers during periods of team expansion by empirically analyzing the effects of team size, expansion, and structure on product quality. We examined statistical correlations between periods of team expansion and the observed effects on product quality in a large Cisco networking product over a five year period. We measured
Permission to make digital or hard copies of all or part of this work for personal or classroom use is granted without fee provided that copies are not made or distributed for profit or commercial advantage and that copies bear this notice and the full citation on the first page. To copy otherwise, or republish, to post on servers or to redistribute to lists, requires prior specific permission and/or a fee.
team size, expansion rate, expansion acceleration, and modularity of the team with respect to departments. Our data came from the version control logs, the defect tracking system, historical records from the Human Resources department, and the failure tracking database.
The contributions of this paper are:
• Statistically significant associations that help researchers and practitioners better understand the risks of expanding a team; and
• A predictive model that can help the practitioners of our case study to accurately predict upcoming product quality measurements.
The rest of this paper is organized as follows. Sections 2 and 3 cover background and related work on analyzing large software development teams and software quality. Section 4 describes our study design and the metrics we used to analyze team expansion and structure. Sections 5, 6, and 7 present the case study and the results of the empirical analysis and its limitations. Section 8 discusses how our study applies to Brooks’ Law and product quality. Lastly, sections 9 and 10 discuss future work and a summary of the study.
2.
BACKGROUND
In this section, we define various terms relating to software quality and network analysis.
2.1
Quality and Metric Terminology
In software reliability, a failure is “the inability of a software system or component to perform its required functions within specified performance requirements” [6]. A fault is “an incorrect step, process, or data definition in a computer program. Note: a fault, if encountered, may cause a failure” [6].
We use the term team-level metric to indicate that the metric is collected as one measurement for the entire team for a given period of time. Also, we use the term product-level metric to indicate that the metric is collected as one measurement of the product’s overall quality for a given period of time.
2.2
Network Analysis
Our analysis involves quantifying measures of networks. In this section, we provide background with regard to network analysis. Network analysis is the study of characterizing and quantifying network structures, represented by graphs [3]. In network analysis, vertices of a graph are called nodes, and edges are the names for connections between exactly two nodes. The degree of a node is defined as the number of neighboring nodes that a node has.
To analyze the structure of a team in terms of company organization, we use the modularity metric [3]. Modularity is a measure of how the network is spread with respect to organization. Modularity requires a method of logically grouping nodes together, called “partitioning”. By definition, each node is placed in exactly one partition. The modularity value is computed based on edges where both nodes are in the same partition and the number of edges that cross partitions. Modularity is computed using the following pseudo code in Figure 1.
Figure 1. Pseudo code for computing modularity.
The terms involving the nodes’ degrees are designed to account for a random re-wiring of network as a way to mitigate potentially missing or mistaken edges in the network [3]. The output of the modularity measure is a decimal value between -1.0 and 1.0. A value near 1.0 (highly modular) indicates that most of the edges are within the partitions; a value near -1.0 (anti-modular) indicates that most of the edges cross boundaries and are not within partitions; a value near zero (not modular) indicates that edges are crossing partitions as often as staying within partitions.
3.
RELATED WORK
The topic of measuring the structure of development teams have been examined in several recent empirical studies. All of the studies, however, examine file-level metrics that reflect the overall team. None of the studies use team-level metrics nor examined the relationship between team-level metrics and product-level metrics. Many of the studies make use of the developer network, which we formally define in Section 4.3. The closest study to ours was a file-level analysis on an AT&T product performed by Weyuker, et al. [17]. The researchers began their project with a predictive model that could identify 75% of the system’s faults in 20% of the source code files. Using the version control logs, the researchers counted the number of committers to a source code file. In their case study, adding the “number of developers” metric to their predictive model only provided a modest improvement over previous predictive results, finding 81, 94, and 76% of the faults on average. However, they found that files changed by additional developers were more likely to have faults. They concluded that “too many cooks can spoil the broth”, although, which is consistent with the argument Brooks presents.
Meneely et al. [12] examined the relationship between developer activity metrics and reliability. The empirical case study examined three major releases of a large, proprietary networking product. The authors used developer centrality metrics from a developer network to examine whether source code files are more likely to have failures if they were changed by developers who are peripheral to the network. The authors formed a model that included metrics of developer centrality, recent code churn (the degree to which a file was changed recently), and lines of code to predict failures from one release to the next. Their model’s
Input
Graph G with nodes in set V and with e edges Partitions P1, P2,…,PN contain nodes in V Algorithm
modularity = 0.0 for each partition Pi
for each node v1, v2 in Pi where v1!=v2
if an edge between v1 and v2 exists
modularity += 1 – degree(v1)*degree(v2)/(2*e)
else
modularity -= degree(v1)*degree(v2)/(2*e)
endif endfor endfor
prioritization found 58% of the system’s test failures in 20% of the files, where a perfect prioritization would have found 61%. Since their analysis used only file-level metrics, they did not examine team expansion or organization.
Bird et al. [1] examined social structures in open source projects. Discussing connections and contradictions between some of Brooks’ ideas [4] and the bazaar-like development of open source projects, the authors empirically examine how open source developers self-organize. The authors use similar network structures as our developer network to find the presence of sub-communities within open source projects. In addition to examining version control change logs, the authors mined email logs and other artifacts of several open source projects to find a community structure. The authors conclude that sub-communities do exist in open source projects, as evidenced by the project artifacts exhibiting a social network structure that resembles collaboration networks in other disciplines. The authors did not examine team expansion or structure in terms of modularity. Shin et al. [14] evaluated the statistical connection between vulnerabilities and metrics of complexity, code churn, and developer activity. The study denotes two case studies of large, open source projects: multiple releases of Mozilla Firefox and the RHEL4 kernel. Among the findings include a statistically significant correlation between metrics of all three categories and security vulnerabilities. Also, in the Mozilla project, a model containing all three types of metrics was able to find 70.8% of the known vulnerabilities by selecting only 10.9% of the project’s files.
Pinzger et al. [17] proposed a variation on the developer network, called a contribution network. The contribution network is designed to use version control data to quantify the direct and indirect contribution of developers on specific resources of the project. The researchers were able to predict reliability failures in binaries of Microsoft Windows Vista by applying centrality metrics to the contribution network. Files that were contributed to by many developers, especially by developers who were making many different contributions themselves, were found to be more failure-prone than files developed in relative isolation. The authors did not examine team expansion or organization.
Nagappan et al. [14] created a logistic regression model for failures in the Windows Vista operating system. The model was based on what they called “Overall Organizational Ownership” (OOW). The metrics for OOW included concepts like organizational cohesiveness and diverse contributions. Among the findings is that more edits made by many, non-cohesive developers leads to more problems post-release. The OOW model was able to predict with 87% average precision and 84% average recall. The OOW model bears a resemblance to the contribution network in that both models attempt to differentiate healthy changes in software from the problematic changes.
In addition to the prediction and validity studies, other studies have provided additional insight into team development using social network analysis in general. Sarma et al. have developed a tool that visualizes many different aspects of development artifacts, including the developer network [13]. Also, Begel et al. have developed a tool at Microsoft that utilizes development artifacts to aid in finding people with specific expertise in a project [1].
Treude and Storey [15] approached the problem of awareness in large development teams by examining current tools. They
performed a qualitative and quantitative case study of IBM’s Jazz development platform to examine how developers use highly configurable features like dashboards and feeds. According to the researchers, some developers reported that dashboards provide an increased peripheral awareness and overview of the project’s status. Feeds were reported to help developers track the lower level tasks of the project, such as updates to fault reports or upcoming deadlines. The results indicate that an integrated development platform like Jazz can provide valuable team-level and task-level awareness to software developers.
4.
METHODOLOGY
In this section, we describe how we conducted our longitudinal case study, including the metrics we used.
4.1
Study Design
Our empirical analysis is a statistical correlation study between team metrics and product quality. We set up this study as a longitudinal analysis of a single development team at Cisco that underwent expansion over time. To incorporate time into our analysis, we used a shifting time window for the team metrics. The time window is the period of time in which we collected the team metrics, representing a data point in our analysis.
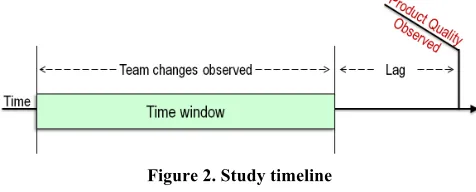
The quality of the product as experienced by the customer, however, does not change at the same time as the team changes. A lag exists between changes in the team and changes in the experienced product quality. During this lag period, developers can be stabilizing the product, testers are performing their final system tests, and the product is delivered to customers’ production environments. Thus, in our study, we take this delay into account between the team changing in the time window under study and a snapshot of the product’s overall quality. Figure 2 depicts how the time window fits on the production/development timeline.
Figure 2. Study timeline
In regard to how to set up the time lag, we must answer the following question:
Time Lag: What is the time lag between changes in the team and corresponding changes in product quality?
The results of the time lag analysis can be found in Section 6.1. Next, we focus our analysis on three main research questions. The first question is related to association, which answers for us specific questions about the relationship between our team metrics and product quality on the individual level.
Association: Are team expansion and organization metrics statistically associated with software quality? Specifically with respect to Qsize, Qrate, Qacceleration, andQmodularity.
• Qsize. Does an expanded team result in reduced product quality?
• Qacceleration. Does a team with an accelerated expansion rate result in reduced product quality?
• Qmodularity. Does a team that does not collaborate across departments result in reduced product quality?
For each of the four sub-questions, we formulate a metric in this study. The metrics for the first three questions are defined in Section 4.2, the metric for the fourth question is defined in Section 4.3, and the metric for product quality is defined in Section 4.4. The results of this analysis can be found in Section 6.2.
Next, we use predictability to estimate the strength of the correlation between all of the team metrics and the product quality metric. Practically speaking, prediction also has a direct use to the managers in our case study project because each month team leads set an expected quality goal (i.e., an expected failures-per-hour goal) for the product. Cisco upper management uses the failures-per-hour metric and its goal as a guide for process improvement. Managers at Cisco can use the predictive model we used in this analysis to better inform the goal-setting process.
Predictability: Can we use team metrics to predict months where product quality will be reduced?
The results of the predictability analysis can be found in Section 6.3.
Lastly, our prediction results could be sensitive to slight variations in the time lag parameters. Thus, we examine what our prediction results would have been if with differing time lag parameters.
Sensitivity: Would using different time lag parameters yield different prediction results?
The results of the sensitivity analysis can be found in Section 6.4.
4.2
Team Size and Expansion Metrics
To estimate the size of the development team for a given time period, we counted the number of distinct developers who made version control changes to source code files on the product. We call this metric NumCommitters. Since the NumCommitters metric is based on version control logs, it only includes teammates who made changes to the code and does not include counts of management and other non-coding employees.
To measure how quickly the team expands, we use two measures: NumNewCommitters and ExpansionAcceleration. We define NumNewCommitters as the number of committers who had never previously made a commit to the product in its history. We define ExpansionAcceleration as the slope of the change in the number of monthly new committers over a given period of time. The two metrics represent velocity of the team size and acceleration of the team size, respectively.
For example, suppose we examine the version control logs for a three-month period of time, and we find that 300 committers made changes to the code. During that three-month period, suppose that the team had ten new developers for the first month, then 15 developers the next month, then 20 developers in the third month. In total, the team had 45 new developers in this three-month period. Furthermore, the team’s growth increased by five developers per month. Thus, in this example, NumCommitters is 300, NumNewCommitters is 45, and ExpansionAcceleration is 5.
4.3
Team Structure Metric
To measure the overall structure of the team, we first need to define how we quantify “structure”. We used a developer network
to examine the structure of our development team. Developer networks have been used for analyzing teams [2], predicting failures [11], [12], [19], and predicting vulnerabilities [7], [8], [14]. The purpose of a developer network is to represent the complex system of socio-technical1 relationships between developers in a software development project.
We define our developer network as a graph where the nodes represent a developer on the team. Edges exist where two developers made a version control commit to the same source code file on the same version control branch within the time window under study. Edges represent places where two developers were likely working on the same code, which in most cases means the developers are collaborating with each other [9]. Following results in a previous study, we do not apply numeric weights to the edges [9].
While the version control logs provide records of which developers are working on the different parts of the code, the logs and resulting developer network do not provide any information on the formal organization of the team. Teammates could be collaborating on code only within departments, or not working with other developers within the same department.
To measure how much code is being changed by developers of the same department, we used a modularity metric called DepartmentModularity. Using historical data from the Human Resources Department at Cisco, we obtained the department identifiers for all the developers. We then applied the modularity metric (defined in Section 2) to the developer network using departments as partitions.
We chose departments as our partitioning boundary in this case study because each department has its own budget. As a result, developers in a given department are focused on producing departmental components while simultaneously focusing on integrating departmental components with other departments’ components.
A highly modular team (modularity near 1.0) indicates that the code changed by two developers on the same version control branch was mostly within departments. Likewise, a team can also be highly anti-modular (modularity near -1.0) or not modular at all (modularity near 0.0).
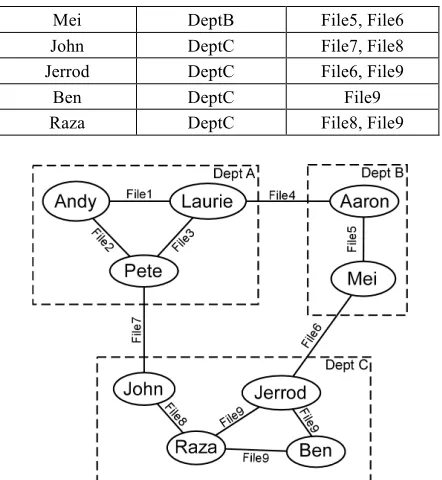
For example, suppose the version control logs and human resources data contained the following records in Table 1. The resulting developer network, with department partitions, can be found in Figure 2. From a visual inspection of the network, most of the edges are within department boundaries, making the team modular. For this example, the modularity metric value is 0.47, indicating that the team is highly modular with respect to departments.
Table 1. DepartmentModularity example data Developer Department Files Changed
Andy DeptA File1, File2
Laurie DeptA File2, File3, File4
Pete DeptA File1, File3, File7
Aaron DeptB File4, File5
1 We use “socio-technical” to describe the connection between
Mei DeptB File5, File6
John DeptC File7, File8
Jerrod DeptC File6, File9
Ben DeptC File9
Raza DeptC File8, File9
Figure 2. Example developer network with department partitions
4.4
Product Quality Metric
We used failures-per-hour as our product quality metric. We define failures-per-hour as the number of customer-reported software failures that were eventually traced to a software fault per hour of usage of the product.
The failures-per-hour metric is intended to evaluate product quality from the point of view of the customer. Since failures-per-hour is based on failures, not faults, the metric is sensitive to situations when multiple customers encountered the same fault, making the failure-per-hour metric more representative of the customer experience. However, using failures as a quality metric alone would also be dependent on the number of customers and the amount of product usage in addition to the quality of the product. If the product’s usage remained constant, then failures would be an adequate product quality metric alone. However, to be safe, we use an “hours of usage” term to normalize failures against the possibility of expanding or contracting market for the product.
5.
CASE STUDY
We performed our analysis on a large Cisco networking product that uses this goal-setting process. The product has over 54,000 source code files and is being changed by hundreds of developers at any given time.
At Cisco, managers track the progress of a project using a goal-setting practice. Managers dialog with team leads and decide on goals for various metrics, including software quality metrics like failures-per-hour. Thus, the failures-per-hour metric is a standard, vetted quality metric used on hundreds of Cisco products and is followed closely by the managers of our case study.
As a part of the goal-setting dialog, managers and team leads discuss upcoming quality concerns based on the team’s progress. From collective experience at Cisco, using the time window (as shown in Figure 1 of Section 4) to guide scoping of the goal-setting discussions has shown to be an accurate way of viewing
the team’s status. Specifically, Cisco managers have found that using a time window for goal-setting is more advantageous than tracking failures by individual features and branches because a time window accounts for the entire team’s activity (e.g. feature enhancement, maintenance) and is more accurate in practice. To observe the activity of the development team, we analyzed the version control logs and the failure tracking system. Nearly every change to the source code required a defect or feature recorded. In this project, both developers and testers commit changes to the code, so the NumCommitters metric includes some testers in addition to developers.
For modularity, we also investigated several ways of partitioning developers other than departments, but did not find the measures to be truly representative of logical partitions in this particular case study (i.e. they are not internally valid). We examined “same supervisor” as a way to partition developers, but some departments were more formally hierarchical than others, confounding the partitions. We also examined “same business unit,” but found that the partition boundaries were too coarse to truly represent how the team is organized.
Figure 3 is a graph of the failures-per-hour metric over time, with the y-axis units hidden to protect proprietary information. Generally speaking, the failures-per-hour for this project has decreased over time, indicating that the overall quality of the product has generally improved. The largest spikes in reduced quality correspond to new major feature releases of the product.
Figure 3. Failures per hour over time
Lastly, we only considered changes to source code files, which for this project are files who names have the following extensions: .java, .jsp, .jspf, .tld, .js, .script, .sql, .c, .h, .cpp, .hpp, .py, .sh, .bat, .pl, .bas, .asp, .xsl, and .wsdl.
6.
ANALYSIS RESULTS
In this section, we examine the answers to our research questions in Section 4.1. We used the R statistics package2 v2.11.1 for our statistical analysis.
6.1
Time Lag
Research Question: What is the time lag between changes in the team and corresponding changes in product quality?
In our case study, when the team introduced problems to the code, the customer did not experience the drop in quality immediately. Our team would release a new version of the product every three
to six months, often maintaining multiple releases at a time and porting fixes across different releases. All changes to the system underwent system testing prior to release, as well. If a customer were experiencing poor product quality today, then the development that caused or missed the problem would have happened several months ago, which we will refer to as the time lag.
We are looking to find appropriate values of two time lag parameters: minimum time lag and maximum time lag to define the time window. The minimum time lag represents the minimum amount of time between changing code and the customer being exposed to that change. The maximum time lag represents the furthest amount of time prior to release such that changes are still in the same release that the customer experiences. For example, the minimum and maximum time lags for an average one-year release cycle with a stabilization period of two months would be 2 and 14 months, respectively.
To determine an appropriate time lag, we used the average window of time between introducing new, later-to-be-found faulty files and the customer finding a bug. In those specific cases, the new source code would have gone through the normal testing and stabilization as part of the team’s development process, and was (wrongly) deemed to be correct before release. Any faults found in these source code files after release had to be injected into that new source code file during our time window. Note that we are not assuming that the faults in the new code were caused by team expansion, rather, we are using the injection-to-customer time as an indicator of the typical time lag between development and customer experience.
We performed a manual investigation of the defect tracking system and version control logs to find new, later-to-be-found faulty source code files. We looked for examples of source code files that were both introduced as part of new development and later had to be fixed for a fault found by a customer after the product’s release. To ensure that the example files were representative, we directed our search to find source code files in various components of the system, committed and tested by different groups of developers, and introduced at different times over the project history.
In the course of manual investigation, we were specifically identifying source code that represented new development. For example, code was considered new development if its initial introduction was explicitly recorded as a new feature. Sometimes new code would be introduced as a result of a defect report that required major re-implementation (and thus, new source code files). We discarded any examples where the new source code was reported to be imported from another system, a refactoring, or the result of any other minor improvement activity that did not represent new development.
Such source code files were rare, yet highly informative. Our search surfaced 23 source code files in 17 different components. No two source code files were involved in the same external defect.
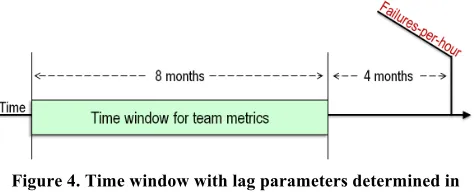
The minimum amount of time between the new code being introduced and the first customer-found defect was 4 months. We used 4 months for our minimum time lag. To determine the maximum time lag, we had some large outliers that could be the result of the customer not finding the defects. We used the upper bound of the 95% confidence interval of the time lag, which was 12.0 months (mean was 9.2 months). Thus, for a given
failure-per-hour measurement, we examine what happened in the team in the prior 4-12 months.
To examine the sensitivity of these parameters on our prediction results, we report our prediction results based on varying time lag parameters in Section 6.4.
Figure 4 depicts the timeline with our time lag parameters. Since the failures-per-hour metric is captured monthly, we shift our time window monthly. Therefore, each team metric data point in our analysis comes from a different time window.
Figure 4. Time window with lag parameters determined in Section 6.1
A summary of the team metrics based on our time lag parameters for this project can be found in Table 2.
Table 2. Summary of the case study project
Metric Minimum Maximum
NumCommitters 244 390
NumNewCommitters 49 118
ExpansionAcceleration -3.6 committers per (month)2 6.3 committers per (month)2
DepartmentModularity 0.26 0.44
As Table 2 shows, the size of the team in committers changed from 244 to 390 (over 60%) from its smallest size to its largest size during that five-year period. Every 8-month window had at least 49 new committers to the project, meaning that the team was consistently under some form of expansion over a long period of time. Some windows had as much as 118 new committers, which was 34% of all the committers at that time. While the team was consistently under growth, the acceleration of growth sometimes increased and decreased per month. Lastly, the team’s modularity was always positive, meaning that the team was always modular with respect to departments.
6.2
Association: Are Team Metrics Associated
With Product Quality Metrics?
To test for association, we used simple linear regression. Simple linear regression measures the linear relationship between an independent variable and a dependent variable. Our independent variables were our team metrics and our dependent variable was the failures-per-hour metric.
Table 3. Team metrics association with reduced quality
Metric p-value<0.05? R2 Correlation w/ Reduced
Quality
NumCommitters Yes 0.38 Inverse
NumNewCommitters Yes 0.26 Inverse
ExpansionAcceleration Yes 0.19 Positive
DepartmentModularity Yes 0.23 Positive
With regard to NumCommitters, the inverse correlation indicates that when the team was large, the product quality was better. This result does not surprise us given that we already knew that the team generally expanded over time and the product generally improved over time, as shown in Figure 3. With NumNewCommitters, times of having many new developers were also inversely correlated with reduced quality. That is, when new developers were on the team, the team later had better product quality. However, ExpansionAcceleration was positively correlated with a reduced failures-per-hour. This positive correlation indicates that periods of accelerating expansion are correlated with periods of relatively poor software quality. Therefore, periods of large team size and linear team growth are correlated with better quality, but periods of accelerated growth are correlated with periods of relatively poor quality.
For modularity, we see that periods of high team modularity are correlated with periods of relatively poor product quality. However, we do not conclude that having a modular team is universally a bad characteristic. As shown in Table 2 of Section 6.1, the team’s modularity was never negative, so the potential “sweet spot” of modularity may still be a positive number, but should not be exceedingly high (i.e. close to 1.0).
We examined potential correlations (i.e. collinearity) amongst our team metrics to see if the team metrics are similar to each other. We tested our metrics again by performing multiple regression analysis against the failure-per-hour metric with combinations of two and three variables at a time, and tested if all of the variables were still statistically significant. We found that all of the variables were still statistically significant in this analysis, with one exception. When we combined NumCommitters, NumNewCommitters, and ExpansionAcceleration into one model, the NumCommitters metric became statistically insignificant at a p<0.05 level. That is, the variation in the failures-per-hour metric can be explained by the team’s rate of growth without the need for accounting for its actual size. This evidence suggests that the velocity and acceleration of growth of a development team has more to do with quality than its overall size.
We also provide the Pearson correlation coefficients between each of the variables in Table 4. The one metric that was strongly correlated with the other variables was NumCommitters. That is, when the team was large, the team also had many new developers and was more modular. Interestingly, times of having many new developers were not found to be statistically correlated with having high expansion acceleration, most likely stemming from the fact that, in many of the time periods, the team underwent a linear, non-accelerated growth.
Therefore, with respect to Qsize, we conclude that an expanded team does not necessarily result in reduced quality because the rate and acceleration of expansion statistically explain the large team size and its observed effects on reduced quality. For Qrate, our results indicate that that linear growth in the team was not associated with reduced product quality. However, for Qacceleration, we conclude that accelerated team expansion is associated with reduced product quality. Lastly, for Qmodularity, we conclude that when collaboration between departments is low, the product quality also reduces.
6.3
Predictability: How Often Are We Right?
Our first step in predictability was to create a model. We selected our variables based upon our association results (described in Section 6.2) and internal correlation analysis (Table 4) where we found that combining our metrics together rendered the NumCommitters variable statistically insignificant. Therefore, the multiple linear regression model uses the following three metrics:
NumNewCommitters, ExpansionAcceleration, and
DepartmentModularity.
A key element of prediction is the supervised model. A supervised model is a method of combining multiple metrics into a regression equation that predicts values of the failures-per-hour metric. In our study, we use multiple linear regression analysis as our predictive model. Supervised models require a training set and a validation set of data, which are taken from the method validation. We used a time-based validation technique to provide a simulation of how the model could have performed at specific times in history. Instead of randomly partitioning the data points into folds (as is widely used in cross-validation), we iterated over each month in history and trained our model on only data available prior to the month in question, then tested against the current month.
For the prediction analysis, we analyzed a 58 month history, with a 12 month delay from the beginning of the time window to the failures-per-hour metric. For training a multiple regression model, we required at least 6 months of training data to properly train the model. Therefore, our time validation prediction results are from 40 months in total.
Table 4. Pearson correlation coefficients between the team metrics.
NumCommitters NumNewCommitters ExpansionAcceleration DepartmentModularity
NumCommittters 1.00 0.49 0.0* 0.51
NumNewCommitters 1.00 0.0* 0.53
ExpansionAcceleration 1.00 0.0*
DeptartmentModularity 1.00
To evaluate our model, we report the adjusted Pearson R2 value for the model on the training set and examine how often the model was able to predict within a 95% prediction interval in our validation phase. Our prediction model on its own training set had an R2 of 0.66 and was able to predict 38 out of 40 time periods over time. Figure 5 show the 95% prediction intervals and the actual failures-per-hour rate (the y-axis have no unit labels are hidden to protect proprietary information).
Our predictions results indicate that three metrics, based solely upon team growth and structure, have a linear relationship that explains 66% of the variation in the product’s quality.
6.4
Prediction Sensitivity
While we performed our analysis with a time lag of 4 to 12 months, we also are interested in how sensitive our results are to adjusting those time lag parameters. We present our prediction results with several different time lag parameters in Table 5, with highlighted top row being our best estimation for time lag according to the analysis in Section 6.1. We did not choose our time lag parameters based on this analysis; we performed this investigation after choosing our 4-12 month time lag parameters.
Table 5. Prediction sensitivity to varying time lag parameters
Min. Time
Lag Time Lag Max. Prediction interval Months in 95% Adj. R2
4 months 12 months 38/40 (95%) 0.66
1 month 9 months 31/38 (82%) 0.53
6 months 14 months 32/40 (80%) 0.34
1 month 15 months 33/37 (89%) 0.21
The sensitivity analysis shows that the predictions are, in fact, somewhat sensitive to varying time windows. The prediction intervals, however, do still provide strong prediction results, meaning that even if our choice of time lag parameters is slightly off, the prediction results would have been strong. Interestingly, the parameters we chose based on our own manual investigations
of source code yielded the strongest prediction results.
7.
LIMITATIONS
The results of this study are in the form of statistical correlations, which means that our study does not unequivocally prove that accelerated team expansion affects quality. Furthermore, our study has only been applied to one case study, and further studies can reveal if these results are consistent across teams.
The longitudinal structure of the analysis assumes that the time lag from changes in the team to changes in the product quality is a constant factor over time. In reality, the actual lag may vary as a result of many different factors. Sometimes a product is rushed to customers, or possibly delayed for more testing. Our sensitivity analysis in Section 6.4 mitigates this limitation by showing that our predictions are somewhat sensitive to the time lag, but not sensitive to the point that strong prediction is not possible with parameters that are off by a few months. As we apply our models to Cisco’s goal-setting process, we will examine the validity of our 4-12 month time lag parameters according our case study and adjust them as necessary.
8.
BROOKS’ LAW & PRODUCT QUALITY
The results of this study show that expanding a team does not have a high risk of reduced quality, but that accelerating the expansion of a team can be high risk to product quality. We do not believe that this result contradicts the spirit of Brooks’ Law at all. Rather, we submit that these results serve as a clarification of what Brooks was discussing regarding his law.
Adding developers to a team requires significant overhead, such as training, increased communication, and increased coordination. Even in situations where the new teammates are veteran developers, software projects are filled with project-specific and domain-specific knowledge that new teammates would need to be briefed on [4]. Teams can plan for new developer overhead, but when the project is already late, as Brooks’ Law states, the team may not have the time to adequately plan ahead.
Like project lateness, accelerating the expansion of a team can also undermine the development team’s planning. For example, if a team is used to adding three new developers per month, they
will have likely have experience in allocating time with coworkers to train in the new developers. As time passes, planning for the training effort required of three developers per month becomes easier with experience as long as that rate remains constant. Planning for accelerated expansion, however, means the team will have to plan for more new developers each month. The acceleration introduces an increase in the time and the number of coworkers allocated to train people in. Each month would have worse and worse training overhead than the month before, which is difficult to plan for and introduces the risk of negative outcomes like lateness or poor quality.
Fortunately, expansion acceleration can be mitigated. For example, suppose a manager decides to expand the team by 12 new developers over the course of three months. An option involving acceleration would be to add two new developers in the first month, then four the second month, then six in the third month. Instead, the same expansion of adding 12 developers in three months can be accomplished without acceleration with a steady rate of four new developers per month. Based upon the findings of this case study, we would recommend the steady growth option over the accelerated option.
9.
FUTURE WORK
We will be applying our metrics and study methodology to other case studies within Cisco. The data sources we used for this case study are available for many other different projects with different domains and varying team sizes. We plan to investigate if our results replicate across teams, particularly in situations where teams remained a constant size or reduced in size. One additional case study has a team size of over a thousand committers, which could provide added insight for teams that are an order of magnitude larger than the case study of this paper.
Beyond cross-project analysis, we will be continuing to investigate other ways of using metrics to aid the goal-setting practice at Cisco. One metric to examine is turnover, or losing developers while also gaining new developers. The case study in this paper had minimal turnover, so we did not include it in this study. Additionally, we are considering ways of quantifying developer expertise and experience so that we can separate out situations where the new committers are inexperienced or not. Lastly, we are also examining other team-level network analysis measures that quantify the structure of a team in different ways. Developer centrality is one file-level measure used in other studies that could be aggregated on a team level.
10.
SUMMARY
Our research objective is to guide software engineering managers during periods of team expansion by empirically analyzing the effects of team size, growth, and structure on product quality. We performed an empirical, longitudinal case study on a large networking product that grew from 249 to 390 committers. We presented several team-level metrics that can be used to assess and track the growth and modularity of software development teams. In our case study, we found that the team expanded in size over time and was also able to improve quality over time. However, periods of accelerated expansion and highly modular team organization were correlated with relatively poor software quality from the point of view of the customer. In fact, rate and acceleration of team expansion together are enough to explain the team size association with product quality. Our results (a) help researchers and practitioners better understand how team expansion can be a high risk; and (b) help practitioners, including
the subjects of our case study, predict upcoming failures-per-hour measurements by monitoring team expansion and organization metrics. We believe that the results of this case study warrant further investigation into the specific ways that adding manpower to a team can help or hurt the products quality.
11.
ACKNOWLEDGMENTS
We thank the Realsearch group at North Carolina State University for their valuable feedback. This work was supported by Cisco Systems, Inc. and by the Army Research Office managed by the NCSU Secure Open Systems Initiative.
12.
REFERENCES
[1] A. Begel, Y. P. Khoo, and T. Zimmermann, “Codebook: discovering and exploiting relationships in software repositories,” in Proceedings of the 32nd ACM/IEEE International Conference on Software Engineering - Volume 1, pp. 125-134, 2010.
[2] C. Bird, D. Pattison, R. D'Souza, V. Filkov, and P. Devanbu, “Latent social structure in open source projects,” in Proceedings of the 16th ACM SIGSOFT International Symposium on Foundations of software engineering, pp. 24-35, 2008.
[3] U. Brandes and T. Erlebach, Network Analysis: Methodological Foundations, 1st ed. Springer, 2005. [4] F. P. Brooks, The Mythical Man-Month: Essays on
Software Engineering, Anniversary Edition, Anniversary. Addison-Wesley Professional, 1995.
[5] T. G. Cummings, “Self-Regulating Work Groups: A Socio-Technical Synthesis,” The Academy of Management Review, vol. 3, no. 3, pp. 625-634, Jul. 1978.
[6] ISO/IEC 24765, “Software and Systems Engineering Vocabulary,” 2006.
[7] A. Meneely and L. Williams, “Secure Open Source Collaboration: an Empirical Study of Linus' Law,” in Computer and Communications Security, pp. 453-462, 2009.
[8] A. Meneely and L. Williams, “Strengthening the empirical analysis of the relationship between Linus' Law and software security,” in Proceedings of the 2010 ACM-IEEE International Symposium on Empirical Software Engineering and Measurement, pp. 1-10, 2010.
[9] A. Meneely and L. Williams, “Socio-Technical Developer Networks: Should We Trust Our Measurements?,” presented at the International Conference on Software Engineering, Waikiki, Hawaii, USA, p. to appear, 2011. [10] A. Meneely, L. Williams, W. Snipes, and J. Osborne,
“Predicting failures with developer networks and social network analysis,” in Proceedings of the 16th ACM SIGSOFT International Symposium on Foundations of software engineering, pp. 13-23, 2008.
[11] A. Meneely, L. Williams, W. Snipes, and J. Osborne, “Predicting failures with developer networks and social network analysis,” in Proceedings of the 16th ACM SIGSOFT International Symposium on Foundations of software engineering, pp. 13-23, 2008.
[12] M. Pinzger, N. Nagappan, and B. Murphy, “Can developer-module networks predict failures?,” in Proceedings of the 16th ACM SIGSOFT International Symposium on Foundations of software engineering, pp. 2-12, 2008.
“Tesseract: Interactive visual exploration of socio-technical relationships in software development,” in Proceedings of the 31st International Conference on Software Engineering, pp. 23-33, 2009.
[14] Y. Shin, A. Meneely, L. Williams, and J. Osborne, “Evaluating Complexity, Code Churn, and Developer Activity Metrics as Indicators of Software Vulnerabilities,” IEEE Trans. Softw. Eng., 2011.
[15] C. Treude and M. Storey, “Awareness 2.0: staying aware of projects, developers and tasks using dashboards and feeds,” in Proceedings of the 32nd ACM/IEEE International Conference on Software Engineering - Volume 1, pp. 365–374, 2010.
[16] E. L. Trist and K. W. Bamforth, “Some social and psychological consequences of the longwall method of
coal-getting,” Technology, Organizations and Innovation: The early debates, p. 79, 2000.
[17] E. J. Weyuker, T. J. Ostrand, and R. M. Bell, “Do too many cooks spoil the broth? Using the number of developers to enhance defect prediction models,” Empirical Softw. Engg., vol. 13, no. 5, pp. 539-559, 2008. [18] R. Williams, J. Walker, and A. Dorofee, “Putting risk
management into practice,” Software, IEEE, vol. 14, no. 3, pp. 75-82, 1997.