SIPPLE, LAUREN. Evaluation of Children’s Perceptions of Fluid Milk Properties for School Meal Programs. (Under the direction of Dr. MaryAnne Drake).
Evidence suggests that adequate consumption of milk and dairy products, especially during childhood, contributes to growth and development in addition to prevention effects against numerous diseases. Unfortunately, fluid milk consumption has declined for decades and most children do not meet their daily recommended intake of dairy products. School meal programs make fluid milk accessible to millions of children each day, and therefore this context is of primary interest for increasing children’s milk intake and creating lifelong milk
consumption habits. It is important to understand children’s perceptions of the different properties of fluid milk so that appealing products targeted toward this demographic may be developed. One area that has received little attention in this regard is fluid milk packaging.
by Lauren Sipple
A thesis submitted to the Graduate Faculty of North Carolina State University
in partial fulfillment of the requirements for the degree of
Master of Science
Food Science
Raleigh, North Carolina 2020
APPROVED BY:
_______________________________ _______________________________ Dr. MaryAnne Drake Dr. April Fogleman
Committee Chair
ii BIOGRAPHY
iii ACKNOWLEDGMENTS
It’s hard to put into words how grateful I am for everyone that has helped me over the past few years. I would especially like to thank Will Harwood and Angelina Schiano for letting me constantly pester you with questions about surveys, Dylan Cadwallader for laying the
groundwork for this project, and Brandon Carter for supporting me in my pursuit of a processing project. Thanks to all the other MAD lab members who trained me and helped along the way – I couldn’t have done this without you. To everyone at the NC State Dairy, especially Randy, Carl, and Gary, thanks for your help and for accommodating my constant requests. I would also like to thank Dr. April Fogleman and Dr. Kevin Gross for serving on my committee.
Dr. Drake, I can’t begin to thank you enough for the opportunities you have given me. Thank you for being supportive of my academic ambitions by allowing me to pursue research beyond my thesis in my short time here. Your example of hard work, passion, and determination has been so valuable. Dr. Barbano, what an absolute honor and privilege it has been to work with you. I’m so grateful to have had the opportunity to learn from your wealth of knowledge.
To Clara, Olive, Angelina, Michael, and my Trinity church family – you made Raleigh feel like home, and I’m going to miss you. To Grandma Pat, thank you for supporting me and for rescuing me from my first hurricane. To my best friend Leo, thank you for anchoring me and for always being so patient and encouraging. Finally, thank you to my parents for your unconditional love and support. Dad, thank you for inspiring me to pursue a career in dairy and for your
iv TABLE OF CONTENTS
LIST OF TABLES ... v
LIST OF FIGURES ... vi
Chapter 1: Literature Review. Evaluating Child Preferences, Attitudes, and Perceptions of Fluid Milk for School Milk Programs ... 1
Introduction ... 1
Sensory Testing with Children ... 2
Cognitive Abilities ... 2
Physiological and Psychological Development of Olfaction and Gustation ... 4
Children’s Development of Food Preferences ... 6
Quantitative Testing Methods ... 7
Evaluating Children’s Values, Emotions, and Product Perceptions ... 13
Testing Conditions ... 16
Legal and Safety Considerations ... 17
Milk Consumption Trends of Children ... 18
Milk Consumption and Children’s Health ... 20
Regulations of Milk in School Meal Programs ... 24
Factors Affecting Children’s Perception and Consumption of Milk ... 25
Composition and Processing Factors ... 25
Extrinsic Factors ... 37
Packaging Factors ... 39
Children’s Perception of Current Milk Packaging ... 46
Conclusion and Objectives ... 47
References ... 48
Chapter 2: Children’s Perceptions of Extrinsic and Intrinsic Attributes of Fluid Milk for School Meal Programs ... 80
Abstract ... 81
Introduction ... 83
Materials and Methods ... 87
Experimental Overview ... 87
Participants ... 87
Extrinsic Milk Properties ... 88
Intrinsic Milk Properties ... 90
Statistical Analysis ... 94
Results and Discussion ... 95
Extrinsic Milk Properties ... 95
Intrinsic Milk Properties ... 101
Conclusion ... 108
v LIST OF TABLES
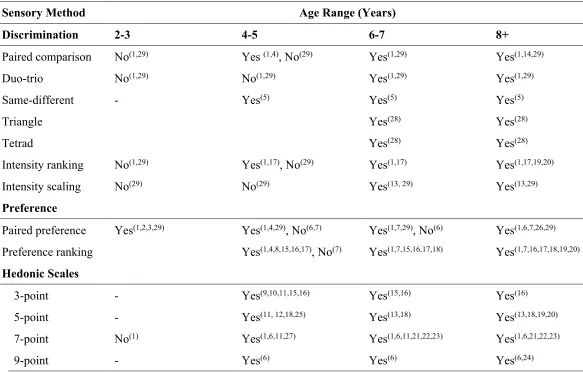
Table 1.1 Cognitive abilities, behaviors, and appropriate sensory tests for children and
adolescents ... 73
Table 1.2 Appropriateness of sensory testing methods for children ages 2+ ... 74 Table 2.1 Milks evaluated in child consumer acceptance testing and by descriptive
analysis ... 116 Table 2.2 Milk packaging attributes and levels for choice-based conjoint survey ... 117 Table 2.3 Thickness and oxygen transmission rates for packaging types for fluid milks
evaluated by consumer acceptance testing and descriptive analysis ... 118 Table 2.4 Comparison of zero-centered utility scores from consumer clusters for milk
packaging attribute levels based on conjoint analysis ... 119 Table 2.5 Focus group activity ranking results for children ages 8-13 y (n=31) ... 120 Table 2.6 Descriptive analysis results for milk packaged in HDPE bottles, PET bottles,
and paperboard cartons at 10 d post-production ... 121 Table 2.7 Child acceptance scores for fat free unflavored milk packaged in HDPE
bottles, PET bottles, and paperboard cartons at 12-13 d post-production
(ages 8 to 13 y, n=126) ... 122 Table 2.8 Child acceptance scores for low-fat (1%) unflavored milk packaged in
HDPE bottles, PET bottles, and paperboard cartons at 12-13 d post-production (ages 8 to 13 y, n=122) ... 123 Table 2.9 Child acceptance scores for fat free chocolate milk packaged in HDPE
bottles, PET bottles, and paperboard cartons at 12-13 d post-production
vi LIST OF FIGURES
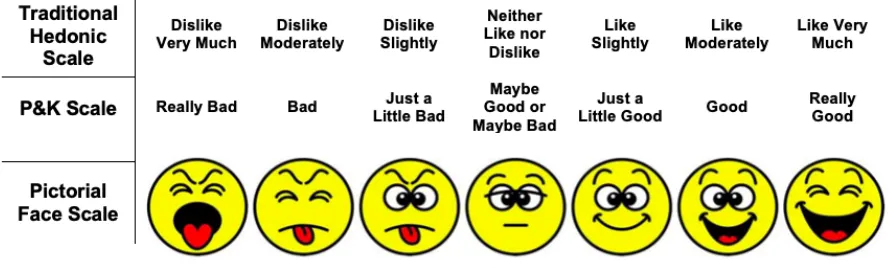
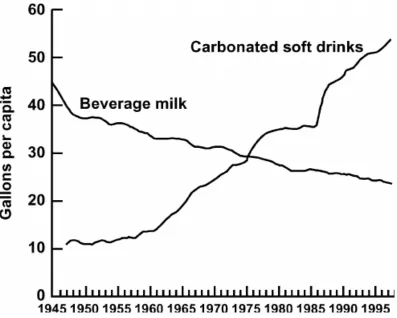
Figure 1.1 Traditional and child-oriented hedonic scales used in affective testing ... 75 Figure 1.2 Percentage of children consuming stand-alone milk (milk in a glass) over time
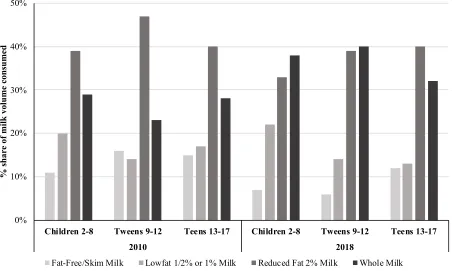
as a function of age ... 76 Figure 1.3 Milk consumption compared against soft drink consumption since 1945 ... 77 Figure 1.4 Share of milk consumption by milkfat content during 2010 and 2018 for
children of different age groups ... 78 Figure 1.5 Calcium, (as well as Vitamin D, genetics, and physical activity,) influence
peak bone mass achieved and therefore fracture risk later in life ... 79 Figure 2.1 Layout of composite attributes used to generate milk packaging mockups ... 125 Figure 2.2 Moderator guide for focus groups with children (ages 8-13 y) regarding milk
packaging perceptions ... 126 Figure 2.3 Average zero-centered utility scores for attribute levels from choice-based
conjoint survey (n=189 child consumers) ... 127 Figure 2.4 Importance scores of fluid milk packaging attributes from choice-based
conjoint survey (n=189 child consumers) segmented by clustering ... 128 Figure 2.5 Child (ages 8 to 13 y) mean overall liking scores for milk packaged in HDPE
bottles, PET bottles, and paperboard cartons at 12-13 d post-production ... 129 Figure 2.6 Child (ages 8 to 13 y) flavor just-about-right (JAR) responses for milk
packaged in HDPE bottles, PET bottles, and paperboard cartons at 12-13 d
1 CHAPTER 1: LITERATURE REVIEW. EVALUATING CHILD PREFERENCES,
ATTITUDES, AND PERCEPTIONS OF FLUID MILK FOR SCHOOL MILK PROGRAMS.
INTRODUCTION
Overall fluid milk consumption in children has declined steadily since the 1970s (Dror & Allen, 2014). In a study on 448 children ages 5 to 18 y participating in the 2007-2012 National Health and Nutrition Examination Survey, school meals accounted for 77.1% of daily milk intake (Cullen & Chen, 2016). As dairy consumption during childhood and adolescence has lasting impacts on lifelong health status (Huth, DiRienzo, & Miller, 2006) and a primary predictor of lifetime milk consumption is habit developed during childhood (McCarthy, Parker, Ameerally, Drake, & Drake, 2017b), ensuring adequate consumption during primary and secondary education years is of the utmost importance. Regulatory changes regarding the availability of low-fat flavored milk are currently being made to increase overall flavor acceptance and intake of fluid milk, but there is evidence that packaging modifications could also increase milk consumption in school milk programs (USDA FNS, 2017a; Rafferty, Zipay, Patey, & Meyer, 2009).
2 SENSORY TESTING WITH CHILDREN
Sensory testing with children is necessary as their needs and wants differ from that of adults. For instance, their preferences and/or sensory acuity for sweetness, saltiness, and texture may be different from that of adults (ATSM, 2013). The primary application of sensory
evaluation with children is measuring the acceptability of foods, beverages, and other products designed to be marketed to, or used by, children. Other applications include identifying unique characteristics or functions of products for use in advertising or identification of unfilled needs or wants as part of the product development process. Evaluation of the effectiveness of different scaling methods or sensory testing methodologies with children of different ages is a more theoretical application (ATSM, 2013). The following section will discuss the development of psychological and physiological sensory capabilities in children and elaborate on objective and subjective sensory testing methods and challenges.
Cognitive Abilities
3 of a food, such as appearance, in making their judgements rather than considering all product sensory attributes (Guinard, 2000; Popper & Kroll, 2005).
Other challenges with younger children (ages 2-7 y) include limited verbal skills, short attention spans, and difficulty comprehending various sensory methods (Guinard, 2000). With regard to designing questionnaires, wording that is suitable for children is crucial (Kroll, 1990). For instance, “bitter” and “sour” are terms that are commonly confused by children as well as adults (Guinard, 2000; Moskowitz, 2002). To mitigate this effect, Liem and Mennella (2003) trained children to distinguish between three basic tastes (sweet, salty, and sour) before asking them to perform an intensity ranking activity. Younger children also have more limited
vocabularies with regards to food attributes, perhaps due to lack of experience (Oram, 1998). This may lead to confusion across flavor and texture attributes (Guinard, 2000).
4 Physiological and Psychological Development of Olfaction and Gustation
Understanding psychological and physiological development is important as these factors may drive differences in children’s food preferences and evaluation of foods. Olfactory function is well developed by the time of birth, with primary olfactory receptor formation occurring by the 8th week of gestation (Schaal, 1988). Normal infants at 28 to 32 weeks gestation regularly respond to olfactory stimuli, such as peppermint odor (Sarnat, 1978). It has been proposed that newborns may be able to differentiate between familiar and unfamiliar odors, and that they may already have developed odor preferences at birth (Soussignan, Schall, Marlier, & Jiang, 1997; Romantshik, Porter, Tillmann, & Varendi, 2007). Children’s sense of smell seems to further develop with age. Additional research is needed to determine whether physiological changes play a role in this, but since developed olfactory ability is observed from a young age, measured increase in sensitivity with age is likely related to cognitive growth and experiences
5 addition to development of cognitive abilities (verbal fluency) as previously described (Engen & Engen, 1997).
The development of gustatory papillae on the tongue begins at around 6 weeks of
gestation. By 17 weeks, taste cells are considered functionally mature, although they may not be fully differentiated (Witt & Reutter, 1997). Additionally, fetal human fungiform papillae only contain up to two taste buds, whereas adults may have up to 15 (Arvidson, 1979). Therefore, while infants are born with the ability to taste, the function is not at the adult level. In fact, the tongue does not reach adult size until age 15-16 y (Temple, Hutchinson, Laing, & Jinks, 2002). During mid-childhood (approximately ages 8-9 y), children have significantly higher densities of taste buds on the anterior tongue than adults, which may give children higher localized
sensitivity to certain tastants (Stein, Laing, & Hutchinson, 1994; Segovia, Hutchinson, Laing, & Jinks, 2002). A study by Zhang et al. (2008) found an inverse correlation between fungiform papillae density and detection threshold of sucrose. However, whole mouth thresholds for children are generally higher than or comparable to adult thresholds (James, Laing, & Oram, 1997; De Graff & Zandstra, 1999). The lack of consensus in these studies is likely due to challenges in eliminating cognitive variables that impact child performance during threshold evaluations (Guinard, 2000).
6 Children’s Development of Food Preferences
Preference testing with children is not only critical since children’s taste preferences differ from that of adults, but also because correlations have been established between food preferences in early childhood and preferences in later childhood (Skinner, Carruth, Bounds, & Ziegler, 2002), adolescence (Nu, MacLeod, & Barthelemy, 1996), and young adulthood
(Nicklaus, Boggio, Chabanet, & Issanchou, 2004). Preference development can be broken into two categories: innate and learned. There is extensive evidence that taste preferences are innate (Guinard, 2000). Many studies have demonstrated children’s increased food preference as sweet taste in a product increases, which is likely related to the fact that sweetness often predicts energy value in nature (Kroll, 1990; Zandstra & de Graaf, 1998; Liem, Mars, & de Graff, 2004; Cordelle, Piper, & Schlich, 2005; Laureati & Pagliarini, 2013; Mennella & Bobowski, 2015). Preference for salty tastes also appears to be innate. By contrast, children typically have an inborn aversion to sour and bitter tastes, which is likely related to innate impulse to avoid poisonous substances (Desor, Maller, & Andrews, 1975; Wardle & Cooke, 2008; Mennella & Bobowski, 2015). Kildegaard, Tonning, & Thybo (2011b) demonstrated an inverse relationship between preference of fruit beverages and perceived sour taste in children ages 9 to 14 y. Similar findings were reported by Liem and Mennella (2003) for children ages 5 to 9 y and others
(Zandstra & de Graaf, 1998). While aversion to bitter taste can be observed in the neonatal stage, degree of aversion to bitter is related to the polymorphism or PROP status of bitter receptors (Menella & Bobowski, 2015).
7 and foods not previously tasted. Repeated exposure to particular foods is also a key driver of preference as has been demonstrated in a variety of studies (Fisher & Birch, 1995; Liem & Mennella, 2003; Wardle, Herrera, Cooke, & Gibson, 2003; Anzman-Frasca, Savage, Marini, Fisher, & Birch, 2012; Ventura & Worobey, 2013). Additionally, consequences associated with eating a particular food, such as a parent rewarding a child with a sticker for eating a vegetable, may also modify preferences (Rozin & Zellner, 1985; Birch, McPhee, Steinberg, & Sullivan, 1990; Wardle et al., 2003; Anzman-Frasca et al., 2012; Ventura & Worobey, 2013).
Quantitative Testing Methods
Due to the differences in the cognitive abilities of children, selection of age-appropriate sensory methods is paramount. There have been a number of recent studies that have
successfully used a variety of traditional quantitative methods to study discrimination abilities and food preferences in children. The appropriateness of these methods for respective age groups of school aged children is summarized in Table 1.2. The subsequent section provides a summary of quantitative sensory as it relates to the capability and reliability of sensory testing with
children of different ages.
8 age of 4 y are able to perform paired-comparison and intensity ranking tasks, while children 4 y and younger are unable to successfully complete these tasks, likely due to their less developed cognitive abilities (Guinard, 2000). Liem et al. (2004) compared the results of paired comparison and rank-order tests on children ages 4 to 5 y in discriminating differences in sweetness of orange-flavored beverages containing varying concentrations of sucrose. Five-year-old children could use both methods to successfully discriminate between all products and demonstrated a high level of consistency between the tests. Children 4 y of age, however, were not able to identify differences in sweetness, and their paired comparison and rank-order results were not significantly correlated with each other.
9 Very little research is available regarding children’s ability to perform tetrad tests. The potential advantage to using the tetrad test is that it is typically more powerful than triangle test; however, concerns with using this test with child subjects include fatigue (as a single tetrad test requires evaluation of four samples), adaption, and memory effects (Ennis & Jesionka, 2011; Garcia, Ennis, & Prinyawiwatkul, 2012). Garcia et al. (2012) compared children’s (grades 1-6) performance and ability to complete triangle and tetrad discrimination tests using diluted and undiluted apple juice. The study found that children were able to differentiate between apple juice samples with both methods, and that tetrad testing was actually more powerful than the triangle test, even with a reduced effect size. Overall, these studies demonstrate that children age 6 y and older can successfully perform paired comparison, duo trio, triangle, tetrad, and ranking discrimination tests. Results for children 4 to 5 y, however, are conflicting (Kimmel et al., 1994). This may be a key developmental stage for cognitive ability to perform these tests, and therefore should be approached with great caution.
Affective Methods. Affective testing methods, which are the most common type of sensory methods employed with children, can be used to determine the degree of liking or disliking for a product (Lawless & Heymann, 2010). These methods, in which the child is tested as a consumer, include paired-preference tests, ranking, and hedonic scaling tests (Guinard, 2000). Léon et al. (1999) compared these 3 non-verbal hedonic methods in measuring food liking in children 4 to 10 y. For each method, biscuits with 5 different flavors of fruit jam were used as stimuli.
10 correlated with one another, but the hedonic categorization method performed better in
discrimination and repeatability (Léon et al., 1999).
In recent years, 5- and 7- point rating scales were the most commonly used hedonic scales to evaluate children’s food preferences (Laureati, Pagliarini, Toschi, & Monteleone, 2015). It has been demonstrated in various studies that children age 4 y can successfully perform hedonic scaling tasks (Guinard, 2000). In hedonic categorical scaling, modifications may be necessary to accommodate their limited cognitive skills. A study by Kroll (1990) assessed the utilization of different rating scales with children ages 5 to 10 y, including a standard hedonic scale, a facial scale expressing degrees of like/dislike, and the Peryam and Kroll (P&K) scale, which is a child-oriented verbal scale (Figure 1.1). Kroll (1990) reported that the P&K scale performed significantly better in terms of discrimination than the other two scales. This may be due to limitations in comprehending the standard hedonic scale, as well as misinterpretation due to ambiguity of facial expressions using a pictorial scale (Popper & Kroll, 2005). Other issues with the pictorial face scale include the more abstract thinking required to interpret the emotion expressed by a face, as well as the fact that facial expressions are not universal across different cultures (ATSM, 2013). Other studies have been successful in using the P&K scale and facial expression scale simultaneously (Kimmel et al., 1994; Pagliarini, Ratti, Balzaretti, & Dragoni, 2003).
11 reliable for their respective cognitive developmental levels. In order to compare results using scales of different lengths, transformations to standardize results are necessary (Chen et al., 1996). Kimmel et al. (1994) reported that children as young as 4 y can use 7-point hedonic scales. Caporale, Policastro, Tuorila, & Monteleone (2009) also used a 7-point hedonic scale to determine liking of school lunch menu items in 4- to 5-year-old children. Liking in this case was significantly correlated with consumption, therefore giving validity to the measurements.
Differences in the findings of these studies may be related to cognitive ability as a function of the developmental rates and formal schooling status of the children participating in each study (Chen et al., 1996).
Hedonic scales that use 5-, 7-, or 9- points are typically preferred to the 3-point scale as they have proven to be reliable and more sensitive (Laureati et al., 2015). Lakkakula, Geaghan, Zanovec, Pierce, & Tuuri (2010) offered that the utilization of a 3-point scale potentially limited their ability to obtain accurate representation of children’s liking of vegetables in school lunch programs. Kroll (1990) reported that using a scale less than 9-points does not appear to offer any advantage in terms of discrimination. Regardless, the 7-point hedonic scale is often used as it addresses the concerns that longer scales may be confusing to children as there are more choices (Kroll, 1990). The 7-point hedonic scale has not only proven to yield repeatable results across multiple sessions (Pagliarini, Gabbiadini, & Ratti, 2005), but it can be used both in
12 Another consideration related to scaling is the degree of use of the scale at different ages. Kimmel et al. (1994) reported that younger children tended to use the ends of a 7-point hedonic scale, while older children used the entire scale in assessing liking of food products. Pagliarini et al. (2005) found that younger children (age 7 y) tended to report higher acceptability scores than older children (age 10 y) when evaluating liking of different lunch combinations on a 7-point hedonic scale. The older children in this study also had more varied scores. Scales that are longer may be more susceptible to this phenomenon, as demonstrated by Moskowitz (2002), who found that younger children (ages 8 to 9 y) tended to use the two highest points on a 9-point hedonic scale more than teenagers in the evaluation of candy liking. This may be indicative that children may become more critical about food with age (Pagliarini et al., 2005).
Other commonly utilized methods in affective sensory testing with children include paired comparisons, ranking, and rating. Liem et al. (2004) found that 4- and 5-year-olds could consistently identify differences in preference of orange flavored beverages with different sugar concentrations using rank order testing and paired preference testing. Both methods
13 fruit drinks in children 9 to 14 y and found agreement between the results of these scores. This consistency was also demonstrated by Liem and Zandstra (2010) who found consistency between multiple ranking and hedonic liking scores for children 6 to 9 y when they were presented with different margarine treatments. The abundance of literature regarding the use of children in affective sensory testing demonstrates that children ages 4 y and older can indicate product preferences, and children ages 6 and older can effectively provide hedonic quantitative measures of product liking.
Evaluating Children’s Values, Emotions, and Product Perceptions
14 A study by Ares et al. (2016) with children ages 6 to 12 y found that utilization of rating-based conjoint (also known as full-profile conjoint, conjoint value analysis, or CVA), in which the child must do an individual liking evaluation for each concept on a 7-pt hedonic scale, may not be sensitive enough to determine significant effects. This may be due to their limited
cognitive abilities and attention span (Guinard, 2000). By contrast, choice-based conjoint (CBC) increased the children’s ability to discriminate between concepts, and therefore can be used to identify package design variables that influence children preferences for food products (Ares et al., 2016). These results, combined with the fact that CBC took less time, suggest that CBC is easier for children than CVA. Adaptive choice-based conjoint (ACBC) has also been
successfully utilized with children ages 8-17 y (Jervis et al., 2014). In ACBC, the respondent first specifies their preferred product attributes in a build-your-own exercise, and the ACBC design displays product concepts relevant to the respondent based on this design. The advantage to ACBC is that it only carries relevant product attributes and levels into the conjoint exercise, making them more engaging, realistic, and relevant to participants in addition to generating more accurate predictions than CBC (Orme, 2014). Kim, Lopetcharat, & Drake (2013) demonstrated that conjoint can be used with adults to determine what packaging information attributes are drivers of liking in a fluid milk product. While fat content, sugar content, and brand were drivers of liking for chocolate milk in adults, children likely have different drivers of liking as they are less likely to act on nutritional knowledge (Story & Resnick, 1986; Kim et al., 2013; Li et al., 2015a).
15 their functional characteristics. Focus groups are the most common type of qualitative research technique (Lawless & Heymann, 2010). Special considerations must be made when running focus groups with children with regard to the group composition and environment, as standards that have been established for adults do not translate well to children due to cognitive, linguistic, social, and psychological differences (Gibson, 2007, 2012). For children under the age of 10 y, small groups of approximately 3 to 6 children are recommended to encourage conversation as this replicates the form of communication in which children naturally talk to one another in small groups and creates a safe peer environment (Mauthner, 1997; Gibson, 2007). Focus groups with older children can be successful with as many as 8 participants (Horner, 2000). Care must also be taken to appropriately present the topic and introduce the researcher to build rapport and trust (Gibson, 2012). With regards to age, it may be best to conduct interviews with children age 7 y or older due to cognitive competencies reached at this point. It is also important to keep the age of participants in a group close to minimize social and cognitive differences. Keeping the group homogenous in terms of gender is also a frequent recommendation (Mauthner, 1997; Gibson, 2007).
16 participants to work together (Mauthner, 1997; Gibson, 2007). This may help the focus group to last 45 to 90 minutes, depending on the children’s age range (Gibson, 2007).
In the context of food research, focus groups with children may be used to generate base knowledge for development of child-appropriate methods. For instance, Jervis et al. (2014) demonstrated that focus groups with children were effective in helping to develop appropriate lexicons for use in surveys. Focus groups have also been used to assess the role of food habits, likes and dislikes, health and nutrition beliefs, meal patterns, view about home food
environment, and the roll of peers and school in food choice of children and adolescents
(Neumark-Sztainer, Story, Perry, & Casey, 1999; O’Dea, 2003; Burgess-Champoux, Marquart, Vickers, & Reicks, 2006, Thompson, Gerard, & Drake, 2007; Fitzgerald, Heary, Nixon, & Kelly, 2010). Focus groups have been conducted with adults to determine attitudes toward milk
packaging as a precursor to quantitative approaches (Hollywood, Wells, Armstrong, & Farley, 2013). In the context of this research, Thompson et al. (2007) utilized focus groups with both children and adults to evaluate their perceptions regarding preferences, brand awareness, healthfulness, and usage of chocolate milk.
.
Testing Conditions
The facility design in which testing with children is conducted should minimize distractions. For example, colorful decorations may act as distractions (Guinard, 2000).
17 directly by an adult (Kroll, 1990). In the interview format, the relationship of the interviewer with the child should be considered. Popper and Kroll (2005) suggested that children less than 4 y may benefit from having their parent as the interviewer as children gave a larger span of average ratings for an orange drink when this was the case, suggesting that children may feel more comfortable with this approach. This method may be adopted as long as there is little risk of bias (e.g. all products look the same), but in samples that appear to differ in quality or
nutritional content, the risk of bias by the parent increases. After the age of 5 y, the child can be interviewed by an unfamiliar researcher with little effect on average ratings. In most cases, the presence of the parent or primary caregiver should be discouraged or interaction with the child limited. The interviewer should use language that is appropriate for the age group and provide emotional support and clarification for the child as necessary. They should also be trained to avoid any unconscious feedback to the child that may bias their results (ATSM, 2013).
Legal and Safety Considerations
18 MILK CONSUMPTION TRENDS OF CHILDREN
The overall consumption of milk by children and adolescents ages 2-18 y has decreased significantly since the 1970s in terms of the proportion of children consuming milk, the number of servings consumed per day, and the proportion of each serving size (Sebastian, Goldman, Ens, & LaComb, 2010; Dror & Allen, 2014). This trend has also been observed in children
participating in school lunch programs, with only 66 percent of NSLP participants consuming milk in the 2014-2015 school year compared to 75 percent during the 2004-2005 school year (USDA FNS, 2018,2019).
Milk consumption is associated with age, with a smaller proportion of children
consuming milk as they get older (Maillot, Rehm, Vieux, Rose, & Drewnowski, 2018) (Figure 1.2). However, the overall trend of decline in consumption within the last decade remains consistent across age groups (MilkPEP Consumption Database). One of the possible
19 beverages (USDA FNS, 2019). Additional evidence of milk being displaced by other beverages in school meal programs was provided in a 2019 study by the USDA. The study found that when schools sold competitive foods other than milk on an a la carte basis, one-third of students who consumed these competitive foods reported beverages other than milk or 100 percent fruit juice. Bottled water was the most commonly reported, followed by sports/energy drinks and juice (not 100% juice) drinks (USDA FNS, 2019). Additionally, schools that offered competitive foods (other than milk) on an a la carte basis also experienced significantly higher waste of dairy; that is, dairy foods and beverages that children took but did not consume (USDA FNS, 2019).
In both children and adolescents, plain milk consumed as a beverage is the largest contributor to dairy and milk consumption (Sebastian et al., 2010; Green, Turner, Stevenson, & Rumbold, 2015). In children ages 2 to 11 y, flavored milk is the second largest contributor followed by plain milk added to cereal (Sebastian et al., 2010). This trend is reversed in adolescents ages 12 to 19 y; plain milk added to cereal is the second largest contributor to milk consumption followed by flavored milk as a beverage (Sebastian et al., 2010). Overall
consumption of plain milk with at least 1% fat has decreased significantly while consumption of flavored milk with added sugar (regardless of milkfat content) has increased significantly since the National Health and Nutrition Examination Surveys (NHANES) in 1989-1991 (Dror & Allen, 2014). Regarding milkfat content, only 20% of children were found to regularly consume lowfat and skim milk (Kit, Carroll, & Odgen, 2011). Recently, a shift in the type of milk
20 MILK CONSUMPTION AND CHILDREN’S HEALTH
The importance of milk in the diets of children cannot be overstated, which makes the recent decline of milk consumption a concern. The Dietary Guidelines for Americans 2015-2020 recommends that children 4 to 8 y consume 2.5 cup-equivalents of fat-free and low-fat dairy, while adolescents ages 9 to 18 y are recommended to consume 3-cup equivalents (USDHHS & USDA, 2015). Unfortunately, the consumption of dairy products falls short of these
recommendations for children 4 years of age and older (Quann & Adams, 2013). Key nutrients that dairy products provide include calcium, phosphorus, vitamin A, vitamin D (in products fortified with vitamin D), riboflavin, vitamin B12, protein, potassium, zinc, choline, magnesium, and selenium (USDHHS & USDA, 2015). Fluid milk is the number one single-food contributor to the intake of calcium, potassium, phosphorus, and vitamin D in children older than 2 y of age (Rafferty & Heaney, 2008).
In the United States, an estimated 72% of dietary calcium comes from dairy products such as milk, yogurt, and cheese, as well as other foods containing dairy products (Institute of Medicine, 2011). The bioavailability of calcium in dairy products is high, aided by the content of Vitamin D, casein, and milk casein phosphopeptides, which have positive effects on calcium absorption, and lactose and phosphorus content, which have a positive effect on calcium utilization. Still, the absorption of calcium from dairy products rarely exceeds 40% of total ingested calcium (Guéguen & Pointillart, 2000).
Vitamin D, another essential nutrient in milk, also plays a vital role in skeletal
21 fortification of milk with Vitamin D has mostly eradicated rickets in the US (Holick, 2006; Yeh, Barbano, & Drake, 2017). Milk, in addition to having naturally high levels of calcium, is a good vehicle for fortification with these nutrients (Kaushik et al., 2014; Yeh et al., 2017).
Due to calcium and vitamin D content, milk and dairy product consumption is influential on peak bone mass achieved, and therefore skeletal integrity and susceptibility to bone loss (Sandler et al., 1985). This makes milk consumption during childhood and adolescents crucial to bone health (Weaver, 2010). Black, Williams, Jones, and Goulding (2002) found that children who avoided drinking milk long-term were more likely to have inadequate calcium intake and poor bone health, including lower bone area and bone mineral density, compared to children that consumed milk. Children who consume ≥2 servings of dairy per day had higher bone mass, area, and density than children who consumed less (Kalkwarf, Khoury, & Lanphear, 2003; Moore, Bradlee, Gao, & Singer, 2008). About 85 to 90% of final adult bone mass is acquired by age 18 y in females and around age 20 y in males (Huth et al., 2006). Attaining a high peak bone mass is important for bone health, as decreased bone mineral density (BMD) is associated with increased risk of bone fracture (Figure 1.5) and osteoporosis (loss of bone mass due to a higher rate of bone resorption than deposition) in later life stages (Marshall, Johnell, & Wedel, 1996; Huth et al; 2006). While dairy consumption throughout all life stages is also necessary for maintenance of BMD and BMC, formation of dairy consumption habits in early childhood is important as this likely influences consumption later in life (Kelder, Perry, Klepp, & Lytle, 1994; Eysteinsdottir et al., 2014; McCarthy et al., 2017b).
22 role in weight control, though further research is warranted due to inconsistent findings regarding dairy intake and weight, particularly for children and adolescents (Huth et al., 2006; Spence, Cifelli, & Miller, 2011; Abargouei, Janghorbani, Salehi-Marzijarani, & Esmaillzadeh, 2012; Rautiainen et al., 2016; Dougkas, Barr, Reddy, & Summerbell, 2019). Since approximately 60-80% of total dairy servings consumed by children comes from fluid milk, fluid milk
consumption plays an important nutritional role in children (Nicklas, O’Neil, & Fulgoni, 2013; Quann, Fulgoni, & Auestad, 2015).
Due to the growth of the plant-based milk alternative (PBMA) beverages segment over the past decade (Sethi, Tyagi, & Anurag, 2016), it is worth addressing nutritional differences between dairy milk and PBMAs. Common PBMAs include almond, soy, rice, and coconut beverages. In addition to providing an alternative to consumers who cannot consume regular milk due to lactose intolerance or dairy protein allergies (Mäkinen, Wanhalinna, Zannini, & Arendt, 2016; Sethi et al., 2016), drivers of consumption for PBMAs include health
factors/concerns, beliefs about animal mistreatment, and environmental reasons (McCarthy et al., 2017b). Palacios et al. (2010) found that younger children (ages 8-12 y) were more likely to accept soy milk beverages than older children (ages 13 – 16 y), consistent with the observation that food preferences are formed in younger children and emphasizing the role of milk
consumption in early childhood to cement milk habits in adult life. Health implications of substituting PBMAs for dairy milk in this group of children should also be considered. The composition of PBMAs can vary greatly as these products are not subject to the same compositional standardization regulations as dairy milk. Most PBMAs, besides soy-based products, are lacking in protein content relative to dairy milk (Mäkinen et al., 2016).
23 essential amino acids (amino acids the body cannot synthesize; in the case of PBMAs, typically methionine and cystine) and also have a lower protein digestibility-corrected amino acid score (PDCASS) relative to dairy milk (Friedman, 1996; Jeske, Zannini, & Arendt, 2017; Chalupa-Krebzdak, Long, & Bohrer, 2018). PDCASS is an indicator of protein quality and value to general human health. Since dairy products are the primary source of calcium in the human diet, another concern of substituting dairy for PBMAs is adequate calcium consumption. PBMAs are typically supplemented with calcium, either in the form of tricalcium phosphate or calcium carbonate. Zhao, Martin, and Weaver (2005) compared the bioavailability of calcium in these two forms in fortified soymilk relative to dairy cow’s milk and found that only calcium
carbonate exhibited similar calcium bioavailability to dairy milk. The absorption of calcium in tricalcium phosphate was only ~75% that of dairy milk (Zhao et al., 2005). However, the amount of bioavailable calcium in these plant-based milk alternatives is highly variable, a problem that is exacerbated due to issues with settling due to poor solubility of calcium (Sethi et al., 2016). Other vitamins and minerals fortified in PBMAs may also be lost or destroyed during processing of these beverages, such as during decanting or thermal processing steps (Mäkinen et al., 2016).
24 vitamin A, vitamin D, riboflavin, vitamin B-12, magnesium, phosphorus, and potassium to the levels present in dairy milk (USDA FNS, 2008).
REGULATIONS FOR MILK IN SCHOOL MEAL PROGRAMS
Federal assistance programs that provide milk to children in schools have been in place since the 1940s (USDA FNS, 2017). Over the years, these programs became a part of the National School Lunch Program (NSLP) and the School Breakfast Program (SBP). These
25 milk. The rule has been fully implemented as of the 2019-2020 school year. Based on flavored low-fat milk offering and purchase data prior to 2012, it is expected to encourage child
consumption of fluid milk. The ruling is meant to address concerns of Child Nutrition Program operators and industry partners regarding declining milk consumption in NSLP participants in elementary, middle, and high school (USDA FNS, 2018). The decision is also based on recent studies that have found that removing flavored milk from schools resulted in significant declines in milk consumption (Quann & Adams, 2013).
The NSLP, SBP, and SMP provide billions of half pints of milk to school children every year, and participants in the NSLP are two to three times more likely to consume milk than their non-participant peers (USDA FNS, 2019). It is worth noting that while these programs give children access to milk, over one quarter of the milk served in the NSLP and almost half of the milk served in the SBP is wasted – that is, it is discarded and not consumed – which has undesirable nutrition, economic, and environmental implications (Blondin, Cash, Goldberg, Griffin, & Economos, 2017; USDA FNS, 2019).
FACTORS AFFECTING CHILDREN’S PERCEPTION AND CONSUMPTION OF MILK
Composition and Processing Factors
Chojnicka-26 Paszun, de Jongh, & de Kruif, 2012; McCarthy, Lopetcharat, & Drake, 2017a). Kling, Roe, Sanchez, and Rolls (2016) evaluated children’s (ages 3-6 y) liking and intake of low-fat (1% fat) versus whole (3.25% fat) milk. To evaluate liking, the two milk types were presented to children one at a time and children were asked to rate the milks on a 5-point cartoon face scale, then indicate their preferred milk. The study reported that children’s (n=107) liking and preference scores were similar for both low-fat and whole milk. To determine whether fat content
influenced children’s milk intake when served as part of a school meal, Kling et al. (2016) served the different milk types to children in a clear plastic container with their lunch. The meal was constant in composition and portion size for all children and treatments. The study also found that fat content did not significantly impact the amount of milk that children (n=125) consumed with a meal. This is interesting as other studies have found that children prefer foods that are higher in fat content (Johnson, McPhee, & Birch, 1991; Kern, McPhee, Fisher, Johnson, & Birch, 1993; Kildegaard, Løkke, & Thybo, 2011a).
27 they have consumed for a long period of time (McCarthy et al., 2017a). The effect of milkfat percent typically consumed might not be as great in children, especially those who are younger, as such habits and preferences may not be well established yet (Ventura & Worobey, 2013). Regarding milk consumption, Robb, Reynolds, and Abdel-Ghany (2007) found that consumption of low-fat milk was positively associated with age, likely due to greater emphasis on low fat consumption.
Flavored Milk and Sweeteners. The majority of children prefer flavored milk over plain milk as it is perceived as more palatable than plain milk (De Pelsmaeker, Schouteten, & Gellynck, 2013; Fayet-Moore, 2016), and as such, flavored milk is positively associated with a higher overall milk intake (Johnson, Frary, & Wang, 2002; Nicklas, O’Neil, & Fulgoni, 2017). Thompson et al. (2007) found that chocolate milk was the most popular flavored milk among children, while other commonly consumed flavored milks included strawberry and vanilla. The primary
28 chocolate milk removal than children in grades 1 through 4. Similarly, Davis et al. (2017) found that the mean amount of milk consumed among kindergarten to second grade students was only 0.3 oz less overall, and 0.4 oz less for chocolate milk drinkers when children chocolate milk was removed as a beverage option from school lunch. The results of these two studies may suggest that younger students are more apt to switch to plain milk when flavored milk is no longer offered, but that this effect does not occur with older children whose nutritional needs continue to benefit from fluid milk consumption.
Children who consume flavored milk tend to have lower intakes of soft drinks and fruit juice compared to non-consumers of milk (Johnson et al., 2002). This makes flavored milk a very important component of dairy intake in children and adolescents. Besides having higher amounts of added sugar, flavored milk has essentially the same nutritional profile as plain milk. Due to its impact on increased overall consumption, however, flavored milk has the potential to increase the intake of several essential nutrients, including calcium, phosphorus, potassium, Vitamin D, and Vitamin A (Johnson et al., 2002; Murphy, Douglass, Johnson, & Spence, 2008; Nicklas et al., 2013; Henry et al., 2015). As previously discussed, consumption of these nutrients during childhood and adolescents are crucial to the lifelong health.
29 dental caries when compared to plain milk. Conflicting data exists on the impact of drinking flavored milk instead of plain milk on adiposity and energy intake. Although some studies say that drinking flavored milk over plain milk is not related to energy intake in children over the age of 5 y or the weight status of children (Murphy et al., 2008; Nicklas et al., 2013), other studies suggest that energy intake may be increased by flavored milk consumption (Noel, Ness,
Northstone, Emmett, & Newby, 2013; Patel et al., 2018). Therefore, further research is needed to investigate the relationship between flavored milk consumption and body composition.
Regardless, overall available research suggests that the nutritional benefits of the nutrients provided by milk outweigh the health concerns of flavored milk (Institute of Medicine, 2010; Li & Drake, 2015; Nicklas et al., 2017). Additionally, due to its carbohydrate, protein, water, and electrolyte content, chocolate milk may aid in recovery from endurance exercise. Several studies have demonstrated enhanced muscle protein synthesis, glycogen restoration, rehydration,
reduced muscle soreness, and even enhanced performance (e.g. increased time to exhaustion) when chocolate milk is consumed post-exercise compared to a placebo or other recovery beverages containing carbohydrate, protein, and fat (Pritchett & Pritchett, 2013; Amiri,
Ghiasvand, Kaviani, Forbes, & Salehi-Abargouei, 2019; James, Stevenson, Rumbold, & Hulston, 2019; Russo et al., 2019). An additional advantage to chocolate milk for exercise recovery is that it is often less costly than other over-the-counter recovery beverages (James et al., 2019).
The USDA does not have limits on added sugar or total carbohydrates for flavored milk served in school meal programs. This decision was made to prevent restrictions in menu
30 USDA FNS, 2012a). Instead, the maximum calorie levels allowed in school meals is thought to limit foods and beverages with high levels of added sugar and forces schools to opt for
unflavored milk or flavored milks containing less sugar (USDA FNS, 2012a). Due to the health concerns associated with added sugar and calorie restrictions in school lunch programs, sugar reduction in milk for these school lunch programs is of great interest. There are three general approaches to sugar reduction in milk: 1) direct sucrose reduction; 2) the use of sugar substitutes to preserve sweet taste; and 3) removal/hydrolysis of the natural milk sugar lactose (McCain, Kaliappan, & Drake, 2018).
The threshold of detection of difference for sucrose reduction in chocolate flavored milk has been determined to be approximately 6.7%, meaning that direct sucrose reduction without changes in sensory perception is feasible within this percent reduction (Oliviera et al., 2016). Additionally, parents prefer flavored milk with reduced sugar for their children over milk with no sugar added or regular sugar content (Kim et al., 2013; Li, Lopetcharat, & Drake, 2014). A study by Li et al. (2015b) investigated the impact of direct sucrose reduction on child (ages 5-13 y) acceptance of chocolate skim milk. While the study confirmed that all ages of children
31 Henry et al. (2015) studied the impact of replacing 1% fat chocolate milk containing 25 g of sugar with a 25% reduced sugar formulation containing no artificial sweeteners on student (grades 1 through 8) milk consumption during lunch. By contrast, this study found that the percentage of students that purchased milk was lower and more milk was wasted when the reduced sugar chocolate milk was offered in the place of the standard milk. However, the reduced sugar chocolate milk was still chosen more frequently than plain milk (Henry et al., 2015). Gradual reduction of sugar from flavored milk has been recommended as to not decrease child acceptance or consumption of milk (Olivera et al., 2016).
The use of non-nutritive sweeteners is an option that has the potential to reduce the sugar content of flavored milk while maintaining sweetness and acceptance of sugar-reduced products. The use of these alternative sweeteners to reduce sugar content of flavored milk would not only lower caloric content of milk without compromising milk consumption, but also could reduce the risk of dental caries as these non-nutritive sweeteners cannot be metabolized by oral microflora (Miele et al., 2017; Gupta et al., 2013). Li et al. (2015a) reported that parents placed the most importance on sweetener type when purchasing chocolate milk for their children. Parents were more likely to be accepting of natural non-nutritive/non-caloric sweeteners for sugar reduction as these are preferred over milk sweetened with sucrose, or with artificial sweeteners (i.e.
32 aspartame, acesulfame potassium (Ace-K), sucralose, neotame, and advantame), only natural high intensity sweeteners (stevia and monk fruit extract) have received “Generally Recognized as Safe” (GRAS) notice (FDA, 2014). The FDA has also granted GRAS notice to D-psicose, more commonly known as allulose, which is a naturally occurring monosaccharide. Although allulose is only 70% as sweet as sucrose, there is growing interest in the use of this sugar as it is virtually indigestible and unfermentable, and therefore the FDA has made it exempt from being included in the “Total Sugars” and “Added Sugars” declarations when it is used as an ingredient (FDA, 2019).
33 Canada be adopted, including the declaration of non-nutritive sweeteners on the front of
packaging, as well as the amount of non-nutritive sweetener per serving and the amount of sugar that would be necessary for sweetness equivalency (Sylvetsky & Dietz, 2014). Finally, the price of non-nutritive sweeteners is significantly higher than that of sucrose, which in 2019 cost ~$0.45/lb. This is particularly a concern for natural offerings such as monk fruit extract, which can cost in excess of $200/lb, whereas artificial sweeteners may range in cost from ~$1.50/lb for sugar alcohols (erythritol) to ~$30/lb for sucralose (T. Grady, personal communication, October 31, 2019). However, since the non-nutritive sweeteners used in flavored milk are typically high in sweet taste intensity relative to sucrose (McCain et al., 2018), their usage rates in flavored milk are much lower than sucrose, making a direct cost comparison of challenging. In the case of the school lunch system where every penny counts, even an increase of one cent per carton could mean the difference of a school system choosing a flavored milk or not.
34 and sorbitol to sweeten plain (unflavored) milk. In this study, children preferred milk sweetened with xylitol over milk sweetened with sorbitol. Both sweetened milks were preferred over plain milk due to the sweet taste. Finally, a study with children ages 1.5 to 5 y comparing consumption of aspartame-sweetened and sucrose sweetened chocolate milk found that intake of these milks was not significantly different, and found that overall energy (calories) consumed when the milks were served at lunch was less when children consumed the aspartame-sweetened milk versus the sucrose sweetened milk (Wilson, 2000). The results of these studies suggest that the use of non-nutritive sweeteners in sucrose-reduced milk provides products that are still acceptable to children.
35 discussed, is another option for lactose reduction although unlike lactose hydrolysis this method does not increase sweetness of the milk (McCain et al., 2018).
Heat Treatment. Milk is heat treated at a variety of different temperatures to maintain product quality and safety, and the processing time and temperature can have significant impacts on milk sensory characteristics. These differences in sensory properties have been shown to impact child acceptance of fluid milk products (Chen et al., 1996; Chapman & Boor, 2001; Lee, Barbano, & Drake, 2017). In conventional pasteurization, fluid milk must be heated to 72°C for 15 s (FDA, 2017). Higher-heat shorter time (HHST) pasteurization, is processed at 89-100°C for 1 to 0.01 s (FDA, 2017), and ultra-pasteurization (UP) is defined as heating to at least 138°C for 2 s. If UP is applied with aseptic filling, that produces a product that does not have to be refrigerated and is deemed aseptic, shelf stable or ultra-high temperature (UHT) processed milk (FDA, 2017). Utilizing UHT and UP approaches significantly extends the shelf life of the milk beyond that of conventionally pasteurized milk (Chapman, Lawless, & Boor, 2001). The use of an extended shelf life or shelf-stable milk could have the potential to reduce milk waste in school meal programs (Beckerman, Blondin, Richardson, & Rimm, 2019). This proposed option will only work provided that children liked the aseptic milk, which has not been demonstrated in peer reviewed research to our knowledge.
36 steam injection or indirect heating. UHT and UP milk are significantly higher in cooked flavor than HTST milk due to the release of volatile sulfur compounds from denaturation of whey proteins during heat treatment (Colahan-Sederstrom & Peterson, 2005; Al-Attabi, D’Arcy, & Deeth, 2009, 2014; Lee et al., 2017; Jo, Carter, Barbano, & Drake, 2019). Cooked flavor, as well as increased astringency, also identified in UP milk, are perceived as off-flavors that are disliked by most consumers and commonly limit consumer acceptance of UHT and UP milk (Perkins & Deeth, 2001; Liem, Bolhuis, Hu, & Keast, 2016; Lee et al., 2017; Jo et al., 2019). The preference for HTST milk in children may also be due to familiarity as HTST milk is commonly served in the home, daycare, or school. Children prefer foods that are familiar. Young children, especially those 2 to 5 y, tend to exhibit food neophobia, an unwillingness to eat and dislike of novel foods (Ventura & Worobey, 2013). However, child preferences for novel foods or flavors increases with repeated exposure, with 8 to 15 exposures necessary to observe such an effect (Birch & Marlin, 1982; Sullivan & Birch, 1990).
37 cardboard/doughy flavor in beverages containing more serum protein as a percentage of the total protein (Cheng et al., 2019b). Serum protein removal can be achieved through microfitration. It is worth noting that the UF milk brand Fairlife®, which has 50% more protein, 30% more calcium, and 50% less sugar than regular milk, experienced a 79% growth in dollar sales in 2016, suggesting high consumer acceptance for UF milk products (Watson, 2017). This observation is also likely due to continually growing consumer interest in added value and functional dairy beverages as well as increased protein (Özer & Kirmaci, 2010; Harwood & Drake, 2018, 2019). More research is necessary to determine consumer acceptance of UF milk products for both adults and children.
Extrinsic Factors
Social Influence. Social interactions with parents, caregivers, school teachers and staff, and peers can all influence milk consumption and choice in children. The food choices and practices of parents and caregivers can have a powerful influence on the development of eating patterns in children by acting as a provider and model (Savage, Fisher, & Birch, 2007). For instance, the types and amount of milk consumed by children is highly related to what is provided by parents at home, although this doesn’t necessarily translate to milk preference (De Pelsmaeker et al., 2013). In one study, students 10 to 16 y indicated that they believed that their parents would prefer them to drink the same type of milk that they usually consumed at home (Gummeson, Jonsson, Conner, & Svensson, 1996). Several other studies demonstrated that children
38 Mitchell, Smiciklas-Wright, Mannino, & Birch, 2004) and type (Dennison, Erb, & Jenkins, 2001) consumed as their mothers, suggesting that parents serve as models of milk consumption.
In school and childcare settings, peer-modeling can also have a large impact on child food and beverage choices. Birch (1980) demonstrated that child food choices, preferences, and consumption patterns were greatly influenced by their peers, particularly in young children whose preferences were more malleable. These effects were shown to endure beyond the immediate context in which the peer modeling occurred. Peer modeling has also been demonstrated with regards to milk consumption in cafeteria settings (Connors, Bednar, & Klammer, 2001; Institute of Child Nutrition, 2016). Encouragement of milk consumption and information regarding milk nutrition by teachers and other school staff has also been proposed as a potential social influence for milk consumption (Connors et al., 2001). These studies
collectively confirm the findings of McCarthy et al. (2017b) that a unique feature of milk consumption is habit.
39 behavior (Story & Resnick, 1986; Trexler & Sargent, 1993; Gummeson et al., 1996; Woodward et al., 1996), as food preferences are mainly driven by taste, texture, and appearance (Stevenson, Doherty, Barnett, Muldoon, & Trew, 2007; Fitzgerald, Heary, Nixon, & Kelley, 2010; Jones, Kervin, Reis, & Gregory, 2012). For instance, while children perceive plain milk to be healthier than flavored milk, there is still a clear preference for flavored milk (De Pelsmaeker et al., 2013). One explanation that has been proposed for such observations is that children believe that
making food choices based on health is only for adults, while children can make food choices based mainly on taste (Michela & Contento, 1986; Chapman & MacLean, 1993; Guidetti, Cavazza, & Graziani, 2014).
Packaging Factors
Graphics and Visual Design Factors. While the main purpose of packaging may be to contain a product and maintain food safety, the package also acts as a marketing vehicle (Harris, Schwartz, & Brownell, 2010). Visual appeal of packaging has a large impact on consumer acceptance, behavior, and purchase decisions regarding a product. Many products that are targeted at
40 (Wechsler, Basch, Zybert, & Shea, 1998). Researchers in this study suggested using gender-neutral colors to increase overall proportion of children choosing low-fat milk.
A broad range of food and beverage products use promotional characters on packaging, most of which are licensed characters or brand equity characters, but also include celebrities and sportspersons (Hebden, King, Kelly, Chapman, & Innes-Hughes, 2011). The utilization of licensed media cartoon characters (such as characters from television shows or movies) for food and beverage packaging has been demonstrated to significantly increase the amount of time and number of times a child views a product (Ogle, Graham, Lucas-Thompson, & Roberto, 2017). Similarly, brand equity characters, which are characters created by a food manufacturer for the purpose of promoting a particular brand (e.g. Tony the Tiger for Kellogg’s Frosted Flakes) have also been found to be positively associated with preference for a food product (McGale, Halford, Harrold, & Boyland, 2016). The suggested explanation for this is that both licensed characters and brand equity characters create “brand-consumer relationships” (Lawrence, 2003; McGale et al., 2016). Such promotional characters are effective in increasing a child’s attention, improving children’s memory and recognition of a food product, in addition to creating brand loyalty (Mizerski, 1995; Neeley & Schumann, 2004; Garretson & Burton, 2005). Children are more likely to indicate preference for foods when they are associated with characters that they like and are familiar (Kotler, Schiffman, & Hanson, 2012).
41 of a character has had a counterintuitively negative impact on food choice in some studies (Ogle et al., 2017) and no impact on product preference or choice in others (Neeley & Schumann, 2004). This impact may vary depending on factors such as age, gender, and the specific character used (Ogle et al., 2017). Studies have found that younger children (ages 4-6 y) are more attracted to products with characters than older children (ages 8-11 y) (Letona et al., 2014; Ogle et al., 2017). This may be related to the characters used on food packaging. A study by Ogle et al. (2017) found that Dora the Explorer was less appealing to older children ages 8 to 9 y (because they viewed these characters as targeting younger children), but were more influenced by characters like SpongeBob SquarePants. For younger kids (ages 4-6 y), it may also be important to use congruent character-product combinations (e.g. rabbit used on carrot packaging) to increase effectiveness of unfamiliar characters (de Droog, Buijzen, & Valkenburg, 2012). Similar to age, the Ogle et al. (2017) study found differences in effectiveness of characters depending on the gender towards which they were targeted.
Labeling Factors. Several studies have demonstrated that nutrition claims can have a positive impact on child expected liking of a product, and that these claims influence health perceptions (Ares et al., 2016). Higher overall expected liking when sugar reduction claim was used, indicating an overall positive attitude toward sugar reduction (Yoo et al., 2017; Lima, de
42 than health driven. Additionally, children (ages 7-12 y) were more likely than adolescents (ages 13-17 y) to describe chocolate flavored milk with a sugar reduction claim as “good for my health”; however, both groups used the phrase more often when a sugar reduction claim was present on a chocolate milk label compared to when the claim was absent (Yoo et al., 2017). Front-of-package nutrition labeling tools for children, such as a traffic light or the emoticon expressions to convey health messages, have also been found to significantly influence choice and health perceptions. For instance, the use of a red traffic light decreases health perceptions, potentially discouraging the consumption of products higher in sugar (Yoo et al., 2017), whereas a green smiley face emoticon has been shown to increase the purchase of plain fat free milk and lower the purchase of chocolate milk without impacting overall milk purchase for children grades kindergarten through 6 (Siegel et al., 2015).
43 presence of branding alone may be enough to increase the actual intake of a particular food in children that are overweight (Keller et al., 2012).
Branding and the use of promotional characters are techniques that aren’t widely used in the conventional fluid milk category (Story & French, 2004; Smith, Huang, & Lin, 2009; Keller et al., 2012). In one study with adults in in Northern Ireland, consumers viewed milk as a commodity and therefore demonstrated a lack of brand loyalty (Hollywood et al., 2013);
44
Packaging. Packaging material and form has a large effect on the consumer experience as well as the flavor of fluid milk. Milk packaging protects against microbial contamination, light, oxygen, and helps to maintain milk nutritional value during storage (Zygoura et al., 2004). The most commonly used materials used in milk packaging today include high-density polyethylene (HDPE) jugs, polyethylene terephthalate (PET) and polycarbonate (PC) bottles, high-impact polystyrene (HIPS) tubs, low-density polyethylene (LDPE) pouches, coated paper containers, and multilayered composite materials (Karaman, Özer, Pascall, & Alvarez, 2015). Harwood and Drake (2018) reported that packaging type was of low importance to adult consumers, however, the packaging form/shape may create consumer expectations about the product (Ares & Deliza, 2010). For instance, focus groups with consumers in Northern Ireland found that paperboard and non-translucent containers were less appealing to consumers than packages that allowed them to visually observe and assess the quality of the milk product (Hollywood et al., 2013). This is consistent with results reported by Harwood and Drake (2018), who found that in trade-off scenarios, consumers preferred plastic jugs over cardboard cartons.
Glass is a much less frequently used material in milk packaging due to its weight, expensive manufacturing, recycling, and shipping costs, as well as its tendency to break (Karaman et al., 2015). It is, however, highly protective against oxygen and moisture
permeation. Unless it is tinted, glass is highly susceptible to light permeation. Glass is also an inert substance, and therefore does not impart off-flavors to the milk (Karaman et al., 2015).
HDPE jugs and bottles are the most popular type of package for fluid milk products (Brody, 2015). They are cost effective, durable, and consumer friendly as they can be
45 or bottles are susceptible to both oxidation of lipids (Cladman, Scheffer, Goodrich, & Griffiths, 1998) as well as light oxidation. To combat against light oxidation, multilayer bottles with pigmented with compounds such as titanium dioxide are typically employed (Karatapanis, Badeka, Riganakos, Savvaidis, & Kontominas, 2006). PET packages have the advantage of having mechanical strength while being lightweight, as well as providing a better oxygen barrier than HDPE (van Aardt, Duncan, Marcy, Long, & Hackney, 2001; Zygoura et al., 2004;
Karatapanis et al., 2006). PET bottles can also be used for extended shelf life (ESL) packaging (Brody, 2015). Karatapanis et al. (2006) found that HTST pasteurized whole milk packaged in both clear and pigmented PET bottles developed plastic and oxidized off-flavors after 5 days of storage when exposed to fluorescent light, which significantly decreased the flavor quality. Additionally, PET packages didn’t provide as much light protection as pigmented HDPE botted or paperboard cartons (Karatapanis et al., 2006). A common composite package used for fluid milk packaging in Europe and North America is the tetrahedron, which was developed by Tetra Pack. It is made from a combination of paperboard, polyethylene coating, and aluminum foil. This form is commonly used for extended shelf life packaging (Brody, 2015).
Gable top paperboard cartons are a popular form of packaging for fluid milk that is a half-gallon in size or smaller (Brody, 2015). They are produced by extruding a polyethylene layer onto paperboard (Lord, 2003). Advantages to this method of packaging include resistance to moisture, cost effectiveness, and ease of graphic application (Brody, 2015). A major problem with paperboard cartons is that they are highly susceptible to flavor migration of soluble
46 paperboard cartons are especially common in school lunch programs (Brody, 2015). This should be a concern because, as previously discussed, flavor is the main driver for milk consumption in children. In regard to ease of use, they are more difficult to open than other packaging types and are not reclosable (Brody, 2015).
Children’s Perception of Current Milk Packaging
Very little research exists on how visual design factors of packaging influence child acceptance of milk. Hollywood et al. (2013) reported that to this point, fluid milk packaging has been mostly utilitarian, homogenous, and unexciting to consumers, and that opportunities exist to improve consumer acceptance by emphasizing aesthetic and communicative packaging aspects. One study by Valajoozi and Zangi (2016) investigated the impact of packaging attributes on both children ages 7 to 14 y and their parents in Tehran. The study found that children found the form of the packaging type (e.g. Tetrapak vs bottle), background color, and illustration to be more important than their parents did, while parents found the font style to be more important than children did. In another study, Connors et al. (2001) conducted focus groups with students ages 6 to 11 y and identified that milk packaging color, graphics, and type influenced student
47 paperboard also decreased the average number of unopened discarded containers by 33%. In focus groups with adults, similar results were reported, with consumers citing increased
durability, leak protection, and resealability as advantages over paperboard cartons (Hollywood et al., 2013). While the studies discussed here provide information about which packaging
factors are noticed by children, there is a lack of information regarding the relative importance of milk packaging factors for children.
CONCLUSIONS & OBJECTIVE
Clearly the relationship between factors affecting children’s acceptance of fluid milk is complex, with flavor, environmental, and packaging factors all playing a role. The objective of this research is to investigate child drivers of liking for milk in school lunch programs,