Efficient Density Based Clustering Method for
Two Dimensional Data
Swelly Jain1, Prof. Prateek Gupta2
M. Tech Scholar, Dept. of Computer Science, Shri Ram Institute of Science and Technology, Jabalpur, India Assistant Professor, Dept. of Computer Science, Shri Ram Institute of Science and Technology, Jabalpur, India
ABSTRACT: Data clustering is an important data exploration technique with many applications in data mining. There are many different types of methods for clustering data: centroid based clustering, hierarchical clustering, density based clustering etc. In our project we will focus only on density based clustering. In density-based clustering, clusters are defined as areas of higher density than the remainder of the data set. Objects in these sparse areas - that are required to separate clusters - are usually considered to be noise and border points. The main goal of our project is to develop a simple and efficient clustering method that would allow users to run three different density-based clustering algorithms on different datasets consisting of 2D point data.
KEYWORDS: Data mining, Clustering, Density Based Clustering, Noise Removal.
I.INTRODUCTION
In this new era of information technology, numerous data is generated by many applications carrying valuable information that needs to be analyzed (e.g. using data mining techniques) to extract their meaningful patterns. Clustering and classification are amongst the most popular data mining techniques. During the last decade, many studies have focused on the different methods of clustering algorithms, because of their significant role in allowing automatic identification of unlabeled records by grouping them into clusters based on similarity measurements (Han, Kamber, & Pei, 2011). Clustering methods are widely used in many applications including network, business and medical based applications. Figure 1-1 lists the variety of applications where clustering methods play a significant role (Han et al., 2011; Schaeffer, 2007).
Fig.1 Application areas of clustering methods
clustering algorithm and application that would allow users to run on different datasets consisting of 2D point data and compare it with well known DBSCAN and SNN.
II. LITERATURE SURVEY
This study focuses on Density-Based Clustering Method, which mainly depends on the notion of density. The algorithms in the density-based clustering method define their clusters based on the high dense regions separated by regions of low density (Cassisi, Ferro, Giugno, Pigola, & Pulvirenti, 2013). The clusters continue growing until the density exceeds a certain threshold (Cassisi et al., 2013). Based on that, the density-based clustering algorithm has an advantage in creating clusters with arbitrary shapes. Like any other algorithms, there is a major similarity measure needed to construct clusters that are density and connectivity that calculates the path between each pair of vertices using the distance measures (Schaeffer, 2007). Both are used to measure the local distribution of the nearest neighbours of points within a particular distance (Berkhin, 2006; Mann & Kaur, 2013).
DBSCAN
For the DBSCAN algorithm following terms is used in consideration of Database D, Core point (q), Border point (p), Minimum no of points in cluster (Minpts) and Radius (Eps).
Definition 1: Minimum number of points. Minpts are use to determine whether a neighborhood is denser or not. Minpts specify the density threshold of the denser regions.
Definition 2: Distance of point p within given Eps Neighborhood point p within Eps value that is referred NEps (p). Here NEps (p)= {q€D | dist(p,q)>=Minpts}
Definition 3: Core point q condition Number of NEps (p) is greater than equal to Minpts i.e.| NEps (p)|>= Minpts Definition 4: Directly density reachable points. Directly density reachable points are core point q and border point p. Core point: Minimum numbers of points are needed within Eps-neighborhood. |NEps (q)| > = Minpts
Border Point: Eps-neighborhood of border point has less point than the Eps of core point. p€ NEps (q)
Definition 5: Density reachable points. Point p is referred as density reachable from another point q in order to Eps and Minpts. If there is a connected chain of point p1 to pi, p1=q, pi=p such as pn+1 is directly density reachable from pn. Definition 6: Noise Any point that is neither core point nor border point and as well as not belongs to any of the cluster is called noise point.
Advantages of DBSCAN
Clusters of arbitrary shape can be detected.
No prior knowledge about the number of clusters is required.
There is a notion of noise (objects not belonging to any cluster) .
Only two input parameters (ε – radius and MinPts – minimum number of points) and is mostly insensitive to the ordering of the points in the database
Disadvantages of DBSCAN
Proper determination of the initial values of the parameters ε and MinPts is difficult.
For n data objects, without any special structure or spatial indexing, the computational complexity is O(n2 ).
If there is variation in the density, noise points are not detected.
SNN
This allows SNN to avoid problems with high dimensional data and also to identify clusters of different densities. SNN expects 3 parameters as input. Parameter k is the neighborhood list size. If k is too small then even relatively uniform clusters will be broken up, if it is too big then smaller clusters will not be found. Parameter MinPts is core point density threshold, points that have at least MinPts similar points will be considered core points. Parameter Eps is threshold for link strength, weaker links will be removed. The steps of the SNN clustering algorithm are as follows:
1. Compute the similarity matrix.
2. Sparsify the similarity matrix by keeping only the k most similar neighbors. 3. Construct the shared nearest neighbor graph from the sparsified similarity matrix.
4. Find the SNN density of each point. For this the number of points that have SNN similarity of Eps or greater to each point has to be counted.
5. Find the core points. Core points are the ones that have density of Eps or greater.
6. Form clusters from the core points. Core points that are within Eps of eachother are placed in the same cluster. 7. Discard all noise points. All non-core points that are not within radius of Eps of some core point are considered noise.
8. Assign all non-noise, non-core points to clusters.
III. PROPOSED WORK
The proposed system is based on density based clustering of two dimensional data. It is the efficient method as compared to DBSCAN & SNN.
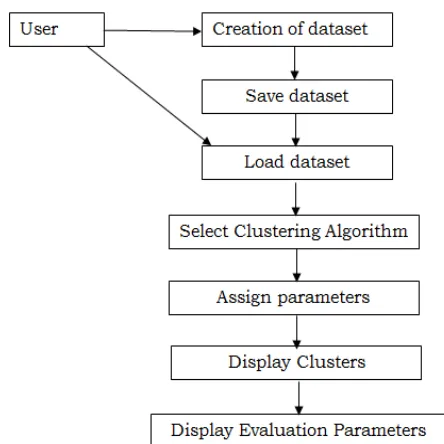
User is able to generate his own two dimensional dataset. User can save it and load any previous dataset. After this user select the algorithm for test and give corresponding parameters. Then particular algorithm will be executed on loaded dataset. Result in terms of clusters of different colors and size will be shown. System also shows noise, accuracy & time specifications.
Working of proposed system will be shown below:
Our proposed algorithm consists of two phases.:
1. It finds the k-nearest neighbors of every datapoint and removes the outliers from the data set. 2. It uses the single link algorithm with simple modification to discover the genuine clusters.
The main idea of the first phase of the algorithm is to remove the lowest density points from the data. The density of a point is computed according to the following two functions: the influence function represents the impact of point x on point y as the Euclidean distance between them:
(1)
The density function for a point x is defined as the summation of (influence functions within the k nearest neighbors) distances between the point x and the k nearest neighbors:
(2)
Since the most complex part of the algorithm is finding the k-nearest neighbors of each datapoint, a simple and efficient method is required for this. The original paper suggests a data structure called canopy to accomplish this task. In our project we decided to implement nearest neighbor queries by using a KD-tree , which is a data structure that also provides efficient nearest neighbor queries.
After we have found the k-nearest neighbors for each datapoint and, based on them, calculated the local density for each datapoint, it is possible to remove outliers based on a threshold. To detect the outliers we assign an outlying factor for each data point, this value is based on the local density. The outlying factor for a point x is given by the following equation:
(3)
The numerator represents the local density at the point x which was computed by Equation (3), the denominator represents the local density of the lowest density point in the dataset. So the outlying factor for a point x is ranging from 0 to 1, as the outlying factor becomes closer to one, the higher the probability for the point to be an outlier. The outlier threshold is the only required input parameter for DCBOR and the algorithm supports the user in determining an appropriate value for it. The algorithm divides the interval [0,1] into 20 sub-intervals, and determines the count of points in each sub-interval. By examining this information the user can determine appropriate value for the outlier threshold. All points that have an outlying factor larger than the input value are discarded as outliers. The clustering process is a middle ground between the single link algorithm and DBSCAN, since in single link two points are merged in each step, but here all points at distance from the current point that satisfy the threshold are assigned to the current cluster.
We can deduce a suitable value for the threshold from the nearest neighbors of each leftover data point after removing the outliers. We search for the maximum distance between a point and its first nearest neighbor. This distance is the ideal distance for the threshold (level of dissimilarity between clusters) according to the main idea of the single link algorithm.
The entire algorithm goes as follows:
1. For each point p return the k-nearest neighbors in ascending order according to their distance to p. 2. Calculate the local density for each point p.
3. Sort the points by their local density, highest density points first (lower numerical value). 4. Remove the outliers from the dataset according to the input parameter.
5. Determine the threshold = maximum distance to the first nearest neighbor.
8. Start a new cluster and repeat steps 6 and 7 until all points are clustered.
IV. IMPLEMENTATION
The main goal of the application is to develop an efficient diverse density clustering method for two dimensional data. We develop a system that give the user a “feel” of different density based clustering algorithms and how they work with different data distributions in identifying clusters. We chose to cluster 2-dimensional point data, because this type of data is the easiest to visualize, which in turn makes it easy to interpret the clustering results and make meaningful conclusions.
There are following modules in the system:
Enter the point data: For this the user can just input the data points using the mouse by clicking on an area provided by the application. In order to make entering different types of datasets easier the user can choose to enter either a single data point at the time or to enter a randomly distributed mesh of point with a specified parameter. This last feature is intended to make entering large datasets less tedious.
Save/Load point data: When the user has entered a dataset, he or she has the possibility of saving the layout of the data points in order to reuse them at a later time. This way it is convenient to reproduce clustering on specific datasets without the need to reenter them every single time. Application allows to use data from any csv file with integers, all points are fitted on the canvas.
Run 3 different density based clustering algorithms on input data: The user has the choice of running either DBSCAN, SNN or proposed algorithm on the input data points. For each algorithm he or she has the possibility to fine tune the parameters of the specific algorithm and see the results of the clustering process visualized by representing different clusters with different colors. An additional feature for the user is the ability to visualize only a specific cluster or points classified as noise.
Display evaluation parameters: The system will display evaluation parameters for comparative study of algorithm like execution time, accuracy and noise etc.
Get help info for different parameters: The user also has the possibility of getting a short description displayed for each of the implemented algorithms and hints about the meaning of each of their parameters.
System uses two dimensional dataset stored in CSV file. Sample dataset is as follows:
V.RESULT
Fig.4 Existing Algorithm
Fig.5 Proposed Algorithm
Data clustering is an important data exploration technique with many applications in data mining.
REFERENCES
[1] Berkhin, P. (2006). A survey of clustering data mining techniques. In Grouping multidimensional data. (pp. 25-71) . Springer Berlin Heidelberg. doi:10.1007/3-54028349-8_2
[2] Han, J., Kamber, M., & Pei, J. (2011). In Kamber M., Pei J. (Eds.), Data mining: Concepts and techniques (3rd ed.). Burlington: Morgan Kaufmann.
[3] Schaeffer, S. E. (2007). Graph clustering. Computer Science Review, 1(1), 27-64. doi:http://dx.doi.org/10.1016/j.cosrev.2007.05.001
[4] Parimala, M., Lopez, D., & Senthilkumar, N. (2011). A survey on density based clustering algorithms for mining large spatial databases. International Journal of Advanced Science and Technology, 31(1)
[5]Hencil Peter, J; Antonysamy, A. An Optimised Density Based Clustering Algorithm. International Journal of Computer Applications. Volume 6– No.9, September 2010. [6] Levent Ertöz, Michael Steinbach, Vipin Kumar. Finding Clusters of Different Sizes, Shapes, and Densities in Noisy, High Dimensional Data.
[7] Java Machine Learning Library (Java-ML). http://java-ml.sourceforge.net/
[8] A. M. Fahim, G. Saake, A. M. Salem, F. A. Torkey and M. A. Ramadan. DCBOR: A Density Clustering Based on Outlier Removal.
[9] Glory H. Shah, C. K. Bhensdadia, Amit P. Ganatra, An Empirical Evaluation of Density-Based Clustering Techniques, International Journal of Soft Computing and Engineering (IJSCE) ISSN: 2231-2307, Volume-2, Issue-1, March 2012
[10] Pooja Batra Nagpal, Comparative Study of Density based Clustering Algorithms, International Journal of Computer Applications (0975 – 8887) Volume 27– No.11, August 2011