Performance Evaluation of RC Framed
Asymmetric Edifices Using N2 Method
Gagan C N1, Avinash Gornale2, S Karthik3 and B G Naresh Kumar4
P. G. Student, Dept. of Civil Engineering, Global Academy of Technology, Bengaluru, Karnataka, India1
Assistant Professor, Dept. of Civil Engineering, Maharaja Institute of Technology, Mysore District, Karnataka, India2
Assistant Professor, Dept. of Civil Engineering, Global Academy of Technology, Bengaluru, Karnataka, India3
Professor & Principal, Dept. of Civil Engineering, Maharaja Institute of Technology, Mysore District,
Karnataka, India4
ABSTRACT: Due to change in technology and occupant needs, most of the edifices in recent times are asymmetric in nature. The behaviour of the asymmetric edifices is complicated when it is subjected to earthquake compared to symmetric edifices. Hence, for safety purpose, there is a need to study the complex behaviour of asymmetric edifices by conducting performance evaluation. In the present study the performance evaluation of four RC edifices is carried out using N2 method. An exertion is made to obtain the demand and capacity spectrum of these edifices. It was found that, just by changing ordination of column there is a huge variation in lateral load carrying capacity of the edifices and the performance of the edifices can be assessed by pushover scrutiny by studying the performance point, which is the intersection of demand and capacity spectrum.
KEYWORDS: N2 method, Pushover scrutiny, Pushover curve, Performance point, Demand spectrum, Capacity spectrum.
I. INTRODUCTION
asymmetric edifices which are subjected to lateral loads using N2 method. N2 method overcomes all the drawbacks of pushover scrutiny. The complex behaviour of asymmetric edifices is examined by studying the capacity curve and performance point.
II. RELATED WORK
BeenaKumari [2] has studied the reaction and load bearing capacity of RC frame using nonlinear finite element scrutiny under pushover loading. For the purpose of scrutiny she created model of 4 stories RC frame using software ATENA, which uses finite element analysis. She also compared scrutiny results with experimental results and the pushover curves achieved from finite element scrutiny agree in linear and nonlinear range with the experimental results. SharathIrappaKammar and Tejas D Doshi[3] studied the effect of irregularities on edifices which are subjected to earthquake forces using nonlinear static pushover scrutiny. To study the performance of edifices they considered plan irregular edifices with re-entrant corners with shear walls. They followed the procedure of pushover scrutiny as per ATC 40 & studied the irregularities as per IS 1893 – 2000. They conducted the nonlinear static pushover scrutiny using software SAP 2000.They used FEMA 356 to study the hinge properties. They came to know that as the load carrying capacity of edifices with shear wall increases, the base shear also increases and there is a reduction in displacements of the edifices with SW when compared to edifices without SW. They also saw that edifices with re-entrant corners are more liable to suffer from earthquake damages which are caused due to effect of torsion.
Peter fajfar [4] conducted a research work to study the performance edifices under earthquake forces. He formulated N2 method in acceleration-displacement pattern. He used inelastic spectra instead of using elastic spectra. He also discussed the derivation of N2 method in his work. He also compared N2 method with the methods which are given in FEMA 273 & ATC 40 and later discussed differences and likeness between them.
III.RC EDIFICES CONSIDERED FOR SCRUTINY
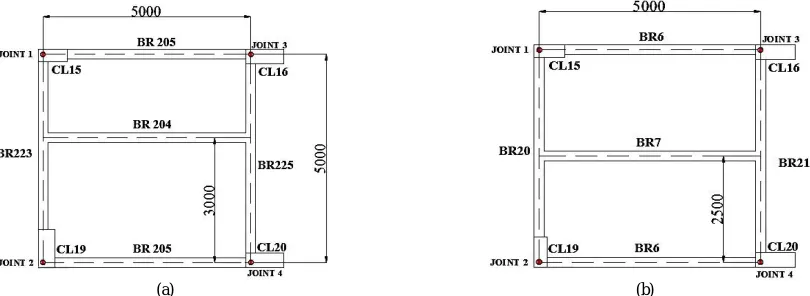
A reinforced concrete framed edifices with the height 16 m (G+3) and with dimension of plan as 5 m X 5 m located in seismic zone 4 is selected for scrutiny purpose. The grade of concrete & steel used for construction of the edifice is M20 and Fe415 respectively. The edifices are located on hard soil and the thickness of slab corresponds to 130 mm. Since the edifices are located in seismic zone 4, as per IS 1893 (part 1): 2002 the zone factor is 0.24, importance factor is 1 and response reduction factor is 3. For scrutiny purpose, we selected 4 different edifices. The above specification is same for all 4 edifices. Fig. 1 shows the floor and roof plan of edifice 1.
(a) (b)
Fig. 2shows the floor and roof plan of edifices 2. The mass of the edifices 1 and 2 remains same andthe only change is the orientation of the columns.
(a) (b)
Fig. 2. Plans of edifice 2 (a) Floor plan (b) Roof plan
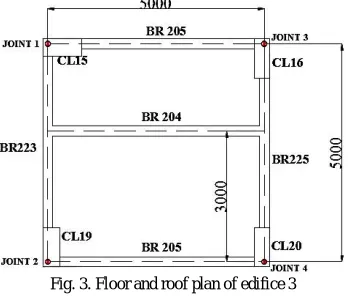
Fig. 3shows the floor and roof plan of edifices 3. The mass of the edifices 1, 2 and 3 remains same andthe only change is the orientation of the columns.
Fig. 3. Floor and roof plan of edifice 3
Fig. 4shows the floor and roof plan of edifices 4. The mass of the edifices 1, 2, 3 and 4remains same and the only change is the orientation of the columns.
(a) (b)
In order to perform N2 method, two important things required are demand and capacity spectrum. The demand spectrum is taken from IS 1893 (part 1): 2002, which will be in SDOF system. The capacity spectrum is obtained from capacity curve of pushover scrutiny. To perform pushover scrutiny, the modelling of edifices is done using a software tool called ETABS version 16.0.3. This pushover scrutiny is done with respect to the centre of mass of edifices.
IV.EXPERIMENTAL RESULTS
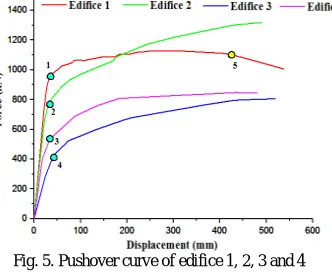
By conducting a pushover scrutiny of the edifices we will get capacity curve, which is the plot between forces and displacements. The nonlinear behaviour of the building is understood with the help of pushover curve. Fig. 5shows the capacity curves of edifices 1, 2, 3 and 4. In figure 8, the points 1, 2, 3 and 4 represent the yield points of the edifices 1, 2, 4 and 3 respectively. Up to yield point, no elements of the edifices yield. In edifice 1 we can see that till point 2 as the displacement increases force is also increasing. But beyond point 2 as the displacement increases force is decreasing. That is till point 2, no elements of edifice 1 yields completely. But beyond point 2 some of the elements of edifice 1 yield completely. In edifices 2, 3 and 4 as displacement is increasing force is also increasing. This means no elements of edifice 2, 3 and 4 yields completely.
Fig. 5. Pushover curve of edifice 1, 2, 3 and 4
Fig. 6shows the performance point of edifice 1. Usually the edifices are designed for a spectral acceleration (Sa) of 0.24
g in zone IV. This means that during earthquakes the edifices are subjected to a maximum acceleration of 0.24 g. But edifices may subject to more acceleration during earthquakes. In the present study the edifice 1is designed for spectral acceleration of 0.24 g. But after scrutiny by seeing figure 6 edifice 1 can withstand much more spectral acceleration of 0.95g than it is designed. This means no elements of edifice 1 fails till acceleration of 0.95 g.
Fig. 6. Performance point of edifice 1
Fig. 7. Performance point of edifice 2
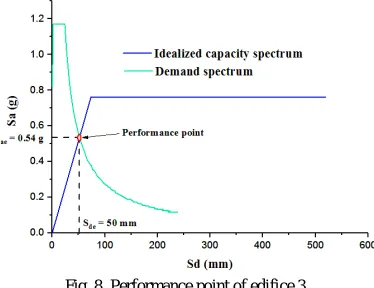
Fig. 8shows the performance point of edifice 3. In the present study the edifice 3 is designed for spectral acceleration of 0.24 g. But after scrutiny by seeing figure 8 edifice 3 can withstand much more spectral acceleration of 0.54 g than it is designed. This means no elements of edifice 3 fails till acceleration of 0.54 g.
Fig. 8. Performance point of edifice 3
Fig. 9shows the performance point of edifice 4. In the present study the edifice 4 is designed for spectral acceleration of 0.24 g. But after scrutiny by seeing figure 9 edifice 4 can withstand much more spectral acceleration of 0.8 g than it is designed. This means no elements of edifice 4 fails till acceleration of 0.8 g.
V. CONCLUSION
From the scrutiny, it was found that just by changing the orientation of the columns there is huge variation in performance of the edifices. The lateral load carrying capacity of the edifices is very much dependent on the distribution of column stiffness.
REFERENCES
[1] Giuseppe Faella, Aldo Giordano and Marco Mezzi, “Definition of suitable bilinear pushover curves in nonlinear static analyses”, 13th World Conference on Earthquake Engineering, Canada, Paper No. 1626, 2004.
[2] BeenaKumari, “Non-Linear Static Pushover Analysis of Real Life Reinforced Concrete Frame with ATENA 3-D Program”, International Journal of Engineering Trends and Technology, Volume 10,Issue No 2, 2014.
[3] SharathIrappaKammar and Tejas, D. Doshi, “Non Linear Static Analysis of Asymmetric building with and without Shear Wall”, International Research Journal of Engineering and Technology, Volume 02, Issue No 3, 2015.
[4] Peter Fajfar, “A Nonlinear Analysis Method for Performance Based Seismic Design”, Earthquake Spectra, Vol. 16, IssueNo. 3, pp. 573-592, 2000.
[5] P. Fajfar, “Structural Analysis in Earthquake Engineering A Breakthrough of Simplified Non-Linear Methods”, Elsevier Science Ltd., All rights reserved 12th European Conference on Earthquake Engineering, pp. 843, 2002.
[6] C. Bhatt and R. Bento, “Estimating torsional demands in plan irregular buildings using pushover procedures coupled with linear dynamic response spectrum analysis”, 6th European Workshop on the seismic behaviour of Irregular and Complex Structures, Haifa, Israel, pp. 12–13, 2011.
[7] Peter Fajfar, DamjanMarusic and IztokPerus, “The Extension of the N2 Method to Asymmetric Buildings”, In: Proc. of 4th forum on Implications of recent earthquakes on seismic risk,Tokyo Institute of Technology, Tokyo, pp. 291-308, 2005.
[8] Kalyanrao and Gude Ramakrishna, “Pushover Analysis of Sloping Ground RC Buildings”, International Journal of Engineering Research &Technology , Vol. 3, Issue No. 6, 2014.
[9] KlemenSinkovic, Peter Fajfar and IztokPerus, “Assessment of Seismic Performance of RC Frame Buildings by Procedures of Different Levels of Complexity”, 2nd European Conference on Earthquake Engineering and Seismology, 2014.
[10] MohdHamraj and Mohammed Moiz Khan, “Seismic Performance Evaluation of RC Buildings with Vertical Irregularities Subjected to Biaxial Excitation”, International Journal of Science, Engineering and Technology, Vol. 3, Issue No. 4, 2015.