ISSN(Online): 2319-8753
ISSN (Print): 2347-6710
I
nternational
J
ournal of
I
nnovative
R
esearch in
S
cience,
E
ngineering and
T
echnology
(A High Impact Factor, Monthly Peer Reviewed Journal)
Vol. 5, Issue 2, February 2016
Analytical Evaluation on Structural
Performance of Corroded RC Columns
Dr.M.Usha Rani
1, Martina Jenifer
2Professor, Department of Civil Engineering, RMK Engineering College, RSM Nagar, Chennai, Tamilnadu, India1 Assistant Professor, Department of Civil Engineering, RMK Engineering College, RSM Nagar, Chennai, Tamilnadu,
India2
ABSTRACT:Reinforced cement concrete is one of the most versatile materials used in the construction industry worldwide. It is expected that the reinforced concrete structures will serve for a very long period of time. But there are many instances of premature failure of R.C. structures raising doubt about its durability. Most of these failures are attributed to the corrosion of reinforcement embedded in concrete. Corrosion attack of concrete structures takes place whenever an aggressive medium is present. Axial behavior of reinforced concrete column subjected to steel corrosion was studied through the experimental programme. A total of sixty scale model columns were tested. A direct current was applied to accelerate the corrosion process. The measurement of electrochemical parameter, Chemical parameter and physical parameters was carried out to assess the quality of corroded concrete. After a target level of corrosion the column specimens were tested to axial compressive load to study the failure mode, load-strain behavior and ultimate load. The corrosion level was measured based on the weight loss measurement. This paper focuses the simple analytical equation presented to predict the strength of corroded column and the validity of the proposed analytical equations is investigated. The results from the proposed equations are validated through the existing experimental results available in the literature.
.
KEYWORDS:Corrosion, Concrete, Column, Destructive Test, Analytical Analysis
I. INTRODUCTION
Corrosion of steel embedded in concrete is a complex problem. Understanding the phenomenon is important. This understanding can only be gained by proper experimentation on concrete structural member. RC columns, the main structural member of RC structures, usually sustain axial forces of dead loads and live loads. When the structures are exposed to corrosive environment, premature failure of RC columns due to corrosion leads to ultimate collapse of the complete structure. Particularly, with the extensive use of de-icing salt in cold weather regions, key bridge components such as decks and piers are vulnerable to steel reinforcement corrosion. Design inadequacies and substandard detailing practices in the columns are often compounded by the effects of reinforcement corrosion owing to carbonation or chloride exposure in marine environment. With this background it is essential to study the influence of steel corrosion on the strength of an RC column in order to ensure its structural performance. In recent years, considerable research has been focused on the investigation on the behavior of beams, slabs in corrosive environment by using various protective coating and inhibitors by researchers. Relatively less work has been reported on RC columns subjected to steel corrosion. Hence the main objective of this research is to investigate the behavior of RC corroded columns under axial load.
II. LITERATURE REVIEW
ISSN(Online): 2319-8753
ISSN (Print): 2347-6710
I
nternational
J
ournal of
I
nnovative
R
esearch in
S
cience,
E
ngineering and
T
echnology
(A High Impact Factor, Monthly Peer Reviewed Journal)
Vol. 5, Issue 2, February 2016
behaviour of corrosion-damaged columns with sub-standard detailing of reinforcement comprising of 21 prismatic specimens. Their study concluded that the corroded columns reached lower strain at failure level and the lateral ties had undergone severe corrosion loss and were entirely ineffective in restraining elastic buckling and declines the axial load. Bae et al (2005) developed simple analytical equations for corroded column. His study concluded that the proposed equations can be effectively used for calculating load carrying capacity of corroded column.
III.EXPERIMENTAL PROGRAMME
A. Materials Used
Ordinary Portland cement of 53 grades conforming to IS 12269-1987 was used. Locally available river sand was used as fine aggregate. The properties of fine aggregate were determined by conducting tests as per IS: 2386 and it confirms to Zone II of IS 383-1970. Crushed granite jelly obtained from machine crusher was used as coarse aggregate. The aggregate that passed through 20mm sieve was used. The properties of coarse aggregate were determined by conducting tests as per IS 2389. As per IS 456-2000 recommendation, potable water free from salts was used for concrete mixing and curing. HYSD bars of grade Fe415 were used for both longitudinal bars and lateral ties. The diameter of the steel bars used for longitudinal and lateral reinforcement was 10mm and 6mm respectively. The concrete mix was proportioned to get a mean strength of 30 MPa. The procedure for proportioning of ingredients for the mix was based on IS: 10262-1982. A mix proportion was arrived at to get the above strength. To find the workability of fresh concrete, concrete samples were taken from various batches of mixed concrete and tested in slump cone apparatus. It gave satisfactory slump values ranging from 80mm to 150 mm. The design mix proportion arrived as 1:1.12: 2.687.
B. Specimen Preparation
Seventy two numbers of reinforced concrete column specimens of circular section (150 mm X300mm) were cast. R1 specimens reinforced with 4 numbers of 10mm diameter as longitudinal bar and lateral ties of 6mm diameter were adopted. To facilitate connection to the power supply and half cell measurement, a small hole of 3mm diameter was drilled in the longitudinal reinforcement. Through this hole insulated electrical wire was soldered. In order to prevent the connection from the ill effects of chloride, the soldered portion was covered thoroughly with sealing compound. The wire was held in place so that it exitedfrom the top face of the column.
C. Designation of Specimens.
The column specimens were divided into three groups: Each group confined with eighteen specimens R1subjected to three levels of corrosion. Eighteen specimens were considered as uncorroded (control) specimens. Specimens have been given descriptive names composed of three terms. The first term describes the C/D ratio namely A, B, and C. The second term refers to the arrangement of reinforcement R1. The third term refers to the levels of corrosion C1, C2 and C3. The uncorroded specimens are designated as “UC”. Concrete cubes, cylinders and prisms were cast along with the column specimens for the determination of compressive strength, split tensile strength and flexural strength. The weight of each rod and reinforcement cage was taken before concrete was poured.
D. Method of Accelerating Reinforcement Corrosion
Accelerated polarisation test essentially consists of applying a constant voltage or constant current to a system consisting of an anode and cathode. The embedded rod of the specimen was made as anode and an external stainless steel plate was set as cathode. The ratio of cathodic/anodic surface area is kept at 3.7. Sodium chloride (NaCl) of 3.5 % concentration was used as electrolyte. A constant voltage of 5.0 volts was set and the current was monitored with time. The chloride ions migrate through the concrete and induce corrosion in an accelerated manner. The time taken for chloride ions to migrate depends on the total resistance of concrete and the amount of corrosion will depend on the induced current.
E. Instrumentation and Testing Procedure
ISSN(Online): 2319-8753
ISSN (Print): 2347-6710
I
nternational
J
ournal of
I
nnovative
R
esearch in
S
cience,
E
ngineering and
T
echnology
(A High Impact Factor, Monthly Peer Reviewed Journal)
Vol. 5, Issue 2, February 2016
on the concrete surface. Pellets were fixed at mid height of the column for strain measurements in the longitudinal direction. Strains were noted down for every 100kN increment of load.
IV.RESULTS AND DISCUSSION
In the Destructive test the effect of corrosion on ultimate load, axial strain, Energy absorption capacity and weight loss of steel of all the specimens was discussed.
A.Effect of Corrosion on Axial Behaviour
(i) Overall Behaviour
The load deformation behavior of conventional column was characterized sequentially by the development of surface cracks, yielding of longitudinal steel, spalling of cover, yielding of lateral steel, fracture of ties, buckling of longitudinal bars and crushing of core concrete. The cracking and subsequent spalling of cover results in a sudden drop in load for corroded columns and gradual drop in load for conventional columns. Load carrying capacity of columns increases normally for well-confined specimens only and for corroded columns, it depends on the cover thickness, longitudinal and lateral steel. When the ties are severely corroded they could not effectively support the longitudinal reinforcement against lateral buckling. The poorly corroded column specimens showed faster rate of strength decay indicating that lateral ties were severely corroded and area of longitudinal reinforcement got reduced (example column AR1C3). However, the failure of specimens in Level 1 and Level 2 were not sudden and the rate of strength decay was comparatively slow. The load carrying capacity of columns increases with increase in cover to diameter ratio. Concrete cover gives protection against the exterior infiltration in the form of a fluid or gas, and therefore deeper concrete depth usually makes a better resistance against chloride ion and carbonation. The formation of surface cracks will be less in the case of increased cover thickness, and hence the damage caused due to corrosion in the embedded steel gets reduced.
(ii) Effect of Corrosion on Ultimate Load
The percentage decrease in load observed in each level of corrosion was compared to the respective conventional specimens. It was observed that the load carrying capacity increases with increase in C/D ratios. The percentage increase in ultimate load observed in BR1 series specimens of C1, C2 and C3 are 6 %, 13% and 13% respectively when compared to the corresponding AR1 series specimens. Similarly 13%, 11%and 11% in CR1 series were observed when compared with BR1 series specimens. Little variation was observed between BR1 and CR1 series, whereas the load carrying capacity of BR1C1 series is 1.06 times more than that of AR1C1 series specimens. The ultimate load decreases as the level of corrosion increases. An average of 10% decrease in load was noted in the second level and third level of corrosion in AR1 series and 5% decrease in load was observed in CR1 series. The percentage decrease in ultimate load in second and third level of corrosion (C2 and C3) as 14 % and 27 % with the first level (C1) of AR1 series specimens. Similarly 8 % and 22 % observed in BR1 series specimens, whereas those noted as 5% and 15 % in CR1 series specimens.
The effect of corrosion on the axial load carrying capacity, energy absorption capacity, and ductility of reinforced columns are examined and discussed in detail in the following section. All the specimens were tested under monotonic loading. The first set includes S1UC, S1C which served as control columns. Specimens S1C were subjected to first level of corrosion. The control specimen failed due to shear and this failure was indicated by inclined cracks appearing on the sides of the column. The specimen attained the peak load of 825 kN.The axial stains were measured at eighty percentage of loading and energy absorption capacity was calculated for the area under the stress-strain curve.
ISSN(Online): 2319-8753
ISSN (Print): 2347-6710
I
nternational
J
ournal of
I
nnovative
R
esearch in
S
cience,
E
ngineering and
T
echnology
(A High Impact Factor, Monthly Peer Reviewed Journal)
Vol. 5, Issue 2, February 2016
Specimen S3C sustains an ultimate strength of 623 kN, which is 11% less than the estimated virgin strength of 696 kN. The axial strain and energy absorption capacity decreases by 24% than the conventional specimen. Specimen S4C reached an ultimate load of 616 KN which is 8 % less than the S4UC. The observation of strain is about 745 µ€ (micro strain) which is 20 % less than the virgin specimens. The energy absorption capacity is reduced to 9% when compared to S4UC. The control column failed due to buckling and this failure was indicated by a lump of concrete spalling from the sides of the column at approximately mid height at the ultimate load level. The specimen attained the peak load of 672 kN.
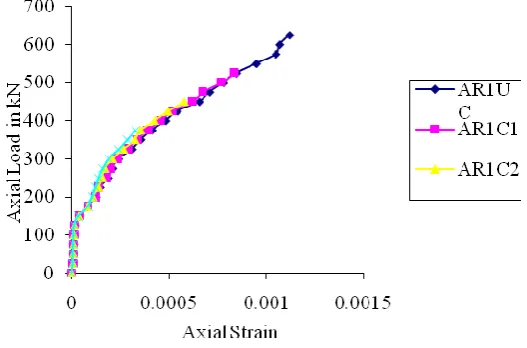
(iii) Stress-Strain Response.
Typical Stress- Strain curves for uncorroded and corroded specimens are shown in Fig. 1 Each curve is an average of the stress-strain curves for the three identical specimens with the same level of corrosion. Examination of stress –strain curve shows that the initial linear slope of the curve, decreases due to the accelerated corrosion process compared to their control column, thereby indicating a gradual reduction in the axial rigidity of the column due to the loss of bond between the rebar and concrete and therefore the stresses on the longitudinal reinforcement was not transmitted to the concrete.
(iv) Effect of Corrosion on Axial Strain
As it was not possible to measure the maximum strains, the values of axial strains that were measured at approximately eighty percentage of ultimate load were taken for comparison. The percentage decrease in axial strain observed in each level of corrosion compared to the respective conventional specimens. It is observed that the axial strain increases with increase C/D ratios. The percentage increase in axial strain observed in BR1 series specimens of C1, C2 and C3 are 2%, 26% and 49% respectively when compared to the corresponding AR1 series specimens. Similarly 2%, 7%and 31% in CR1 series were observed when compared with BR1 series specimens. The axial strain decreases as the level of corrosion increases. The percentage decrease in axial strain in second and third level of corrosion (C2 and C3) as 31 % and 61 % with the first level (C1) of AR1 series specimens. Similarly 15 % and 43 % observed in BR1 series specimens, whereas those noted as 12 % and 28 % in CR1 series specimens. The highest value of 60% variation was observed in the third level of corrosion in AR1 series specimens.
Typical Stress- Strain curves for uncorroded and corroded specimens are shown in Figs. 4.41 to 4.45. Each curve is an average of the stress-strain curves for the three identical specimens with the same level of corrosion. The axial rigidity of the column decreases due to corrosion. The above behavior can be related to the development of cracks which may affect the failure mode and ultimate strength of the specimen through the significant loss of bond between concrete and reinforcement.
(v) Effect of Corrosion on Energy Absorption Capacity
Energy absorption capacity was found out by calculating the area under axial stress - strain curve. The variations of 25%, 39% and 40 % were observed in the CR2C1, C2 and C3 specimen compared to R1 series specimens. The energy absorption capacity of the column specimen increases with increase in C/D ratios. The percentage increase in energy obsorption capacity observed in BR1 series specimens of C1, C2 and C3 are 4 %, 45 % and 83 % respectively when compared to the corresponding AR1 series specimens. Similarly 56 %, 38 %and 113 % in CR1 series were observed when compared with BR1 series specimens. The column with 20 mm cover shows higher variation than column with 30 mm cover in both R1 series specimens. The value of 45% was observed in AR1C3 when compared to BR1C3 specimen. The energy absorption capacity of the column specimen decreases as the level of corrosion increases. The percentage decrease in energy absorption capacity in second and third level of corrosion (C2 and C3) as 42 % and 72 % with the first level (C1) of AR1 series specimens. Similarly 19% and 51 % observed in BR1 series specimens, whereas those noted as 6 % and 39 % in CR1 series specimens. The highest value of 45% variation was observed in the third level of corrosion in AR1 series specimens.
B.Measurement of Weight Loss
ISSN(Online): 2319-8753
ISSN (Print): 2347-6710
I
nternational
J
ournal of
I
nnovative
R
esearch in
S
cience,
E
ngineering and
T
echnology
(A High Impact Factor, Monthly Peer Reviewed Journal)
Vol. 5, Issue 2, February 2016
it is a precise method to quantify corrosion attack in laboratory experiments. The percentage loss in weight increases as the level of corrosion increases and the increase in loss of weight decreases with increase in C/D ratios.
C.Failure Mode of Circular Column
The first sign of distress in all the control specimens were hairline crack in cover concrete at the top and bottom of the specimens. As the axial loading was increased, additional cracks form and existing cracks gets widened. On further loading, numerous X-shaped bond cracks occurred, which eventually led to bond splitting failure. On the other hand, in the specimen with level 1 and level 2 corrosion, the corrosion cracks continued to grow as loading was implemented. On further increase in load, numerous X-shaped bond cracks occurred at lower load level and their concrete cover fell off completely. Shearing failure was observed in Level 3 corroded specimen where the failure of the lateral ties was immediately followed by the buckling of longitudinal reinforcement.
V. ANALYTICAL MODEL
A. Evaluation of Equivalent Area of Concrete (AEqv)
Fig.1 presents the axial load vs. axial strain curves of the test columns. It can be seen that the initial axial rigidity (AE), which can be defined as the initial linear slope of the curve, decreases due to the accelerated corrosion process as compared to their control columns. If there is a change in the initial behaviour, it would be due to the change in either concrete or steel reinforcement. It was, therefore, assumed that the decrease was caused by cracking and spalling of cover concrete and loss of steel reinforcement, which eventually results in the decrease of the effective cross sectional area. It should be noted that this assumption was on the basis that the elastic modulus of concrete is not affected by the corrosion process. In order to quantify the degradation of concrete due to the cracking and the loss in weight of steel, a concept of equivalent area was evaluated.
Fig. 1 Axial Load Vs Axial Strain for AR1 Series Specimens
The equivalent area Aequcan be defined as,
A eqv = Фcorr 2 ( Ag - (Ast)corr ) = Фcorr 2 ( Ag - Фcorr 1 Ast) (1)
Where,
A eqv = equivalent area,
Ag = gross area,
Ast = area of steel reinforcement
ISSN(Online): 2319-8753
ISSN (Print): 2347-6710
I
nternational
J
ournal of
I
nnovative
R
esearch in
S
cience,
E
ngineering and
T
echnology
(A High Impact Factor, Monthly Peer Reviewed Journal)
Vol. 5, Issue 2, February 2016
Фcorr1 = is an area reduction factor to account for the steel loss due to
corrosion
Фcorr1, is actually the ratio of the reduced area of steel reinforcement after corrosion process to the original area. Thus, it
was determined using the reduction in weight of steel obtained from experimental results. Astcorr
Фcorr1 = --- (2)
Ast
Фcorr2 is an area reduction factor to account for the degradation of concrete due to cracking caused by corrosion of steel
reinforcement.
The area reduction factor, Фcorr2 was calculated based on the results of small – scale tests using the following
equations. (Pu -fyAst)Corr
Фcorr2 = --- (3)
(Pu -fyAst) Control
Where,
Pu = ultimate load,
fy = stress of longitudinal reinforcement,
Ast = area of longitudinal reinforcement
fcy = Cylinder compressive strength.
B. Regression Analysis
A simple regression analysis was carried out to obtain the relationship between the area reduction factors Фcorr1 and Фcorr2 and is shown in Fig. 2
Fig.2 Relationship between Фcorr 1 and Фcorr 2 of Specimens
C. Proposed Design Guidelines
Axial compressive capacity of RC columns under corrosive environment can be determined as follows. Pu = (fcy Aeqv + fy (Ast) corr) (4)
Where,
fcy = Cylinder compressive strength,
A eqv = equivalent area,
fy = stress of longitudinal reinforcement,
ISSN(Online): 2319-8753
ISSN (Print): 2347-6710
I
nternational
J
ournal of
I
nnovative
R
esearch in
S
cience,
E
ngineering and
T
echnology
(A High Impact Factor, Monthly Peer Reviewed Journal)
Vol. 5, Issue 2, February 2016
The performance of the proposed design guidelines were validated through comparison with the results of mid – scale RC columns.
D. Comparison of Ultimate Load
The ultimate load carrying capacity of corroded concrete column having circular and square cross- sections predicted from the Eq. (4) were compared with the experimental results. It was found that a good correlation was obtained between the experimental results and those obtained from Eq. (4).
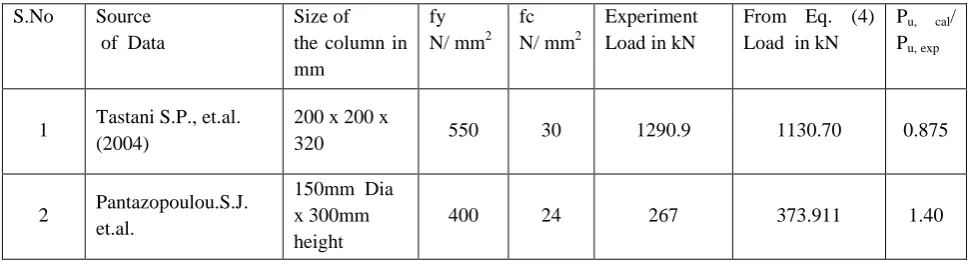
E. Validation of Proposed Equation with Existing Experimental Database in Literature
Limited numbers of tests have been reported in the literature on the ultimate load carrying capacity of reinforced concrete corroded column. A database containing test results, built for survey of existing studies (Tastani S.P., et.al. 2004, Pantazopoulou.S.J., et.al. 2001) is presented in Table 2. The experimental results of axial load carrying capacity reported in the existing database found in the literature were compared with those of the ultimate load computed from Eq. (4). The comparison is shown in Table 1 to be favorable. Hence, Eq. (4) can be satisfactorily applied to determine the axial compressive strength of the column in corrosive environment.
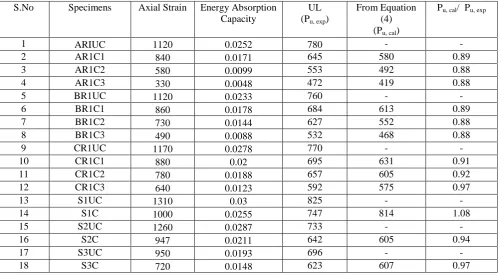
Table 1: Comparison of Experimental and Analytical Results
S.No Specimens Axial Strain Energy Absorption Capacity
UL (Pu, exp)
From Equation (4) (Pu, cal)
Pu, cal/ Pu, exp
1 ARIUC 1120 0.0252 780 - - 2 AR1C1 840 0.0171 645 580 0.89 3 AR1C2 580 0.0099 553 492 0.88 4 AR1C3 330 0.0048 472 419 0.88 5 BR1UC 1120 0.0233 760 - - 6 BR1C1 860 0.0178 684 613 0.89 7 BR1C2 730 0.0144 627 552 0.88 8 BR1C3 490 0.0088 532 468 0.88 9 CR1UC 1170 0.0278 770 - - 10 CR1C1 880 0.02 695 631 0.91 11 CR1C2 780 0.0188 657 605 0.92 12 CR1C3 640 0.0123 592 575 0.97
13 S1UC 1310 0.03 825 - -
ISSN(Online): 2319-8753
ISSN (Print): 2347-6710
I
nternational
J
ournal of
I
nnovative
R
esearch in
S
cience,
E
ngineering and
T
echnology
(A High Impact Factor, Monthly Peer Reviewed Journal)
Vol. 5, Issue 2, February 2016
Table 2: Validation of Proposed Equations using Existing Experimental Database
S.No Source of Data
Size of the column in mm
fy N/ mm2
fc N/ mm2
Experiment Load in kN
From Eq. (4) Load in kN
Pu, cal/
Pu, exp
1 Tastani S.P., et.al. (2004)
200 x 200 x
320 550 30 1290.9 1130.70 0.875
2 Pantazopoulou.S.J. et.al.
150mm Dia x 300mm height
400 24 267 373.911 1.40
VI.CONCLUSION
The percentage decrease in load carrying capacity, ductility and energy absorption capacity of the corroded columns gets increased with the decrease in C/D ratio (cover / Diameter), increases with levels of corrosion
The percentage loss of weight of steel increases with decrease in C/D ratio, increases as the increase in level of corrosion and gets decreased with the increase in percentage of reinforcement.
When 5mm cover is reduced the loss in weight of steel decreases by 2.259% and the ultimate load carrying capacity is reduced to 11% . When 10mm cover is reduced, the loss in weight of steel decreases by 4.699% and the ultimate load carrying capacity reduces to 20%.
As the cover thickness increases the corrosion resistance of rebars becomes high.
The load carrying capacity, ductility and energy absorption capacity of the conventional column increases with
the increase in the cross section of the column (S1UC and S2UC).
The load carrying capacity, ductility and energy absorption capacity of the conventional short (S1UC) column
increases with respect to long column (S4UC) of same cross section.
The percentage decrease in load carrying capacity, ductility and energy absorption capacity of the corroded
column decreases with the increase in the cover concrete (S1C and S2C).
The percentage decrease in load carrying capacity, ductility and energy absorption capacity of the corroded
short column increases when compared to the percentage decrease in long column of the same cover (S1C and S4C).
The percentage loss of weight in steel increases with decrease in cover and the percentage decrease in load
ISSN(Online): 2319-8753
ISSN (Print): 2347-6710
I
nternational
J
ournal of
I
nnovative
R
esearch in
S
cience,
E
ngineering and
T
echnology
(A High Impact Factor, Monthly Peer Reviewed Journal)
Vol. 5, Issue 2, February 2016
REFERENCES
[1] ASTM G1-67 (1971), “Recommended Practice for Preparing Cleaning and Evaluating Corrosion Test Specimens”, American Society for Testing and Materials, Pennsylvania.
[2] Ballim Y., Reid J.C. and Kemp A.R. (2001), “Deflection of RC Beams under Simultaneous Load and Steel Corrosion”, Magazine of Concrete Research, Vol.53, No.3, pp.171-181.
[3] IS: 383-1970, “Specifications for Coarse and Fine Aggregates from Natural Sources for Concrete”, Bureau of Indian Standards, New Delhi. [4] IS: 2386-1963, Part III, “Indian Standard Methods of Test for Aggregates for Concrete”, Bureau of Indian Standards, New Delhi.
[5] IS: 456-2000, “Plain and Reinforced Concrete -Code of Practice”, Bureau of Indian Standards, NewDelhi. [6] IS: 516-1959, “Methods of Tests for Strength of Concrete”, Bureau of Indian Standards, New Delhi.
[7] IS: 10262-1982, “Recommended Guideline for Concrete Mix Design”, Bureau of Indian Standards, New Delhi. [8] IS: 12269-1987, “Specifications for 53 Grade Ordinary Portland Cement”, Bureau of Indian Standards, New Delhi.
[9] Morris W., Vico A. and Vazquez M., (2004), “Chloride Induced Corrosion of Reinforcing Steel Evaluated by Concrete Resistivity Measurements”, ElectrochimicaActa, Vol.49, No.25, pp. 4447-4453.
[10] Pantazopoulou S.J., Bonacci J.F., Sheikh S., Thomas M.D.A. and Hearn N., (2001), “Repair of Corrosion - Damaged Columns with FRP Wraps”, Journal of Composites for Construction”, Vol.5, No.1, pp.3 -11.