Applicability of Dynamic Loads Acting on Pile
Foundations as Static Loads
Burak Görgün1
Res Asst., Department of Civil Engineering, Bilecik Seyh Edebali University, Bilecik, Türkiye1
ABSTRACT: In the case of considering dynamic effects without using sub-programs, dynamic forces can be considered in terms of static loads to design of the pile foundation in saturated soils. In this study, the applicability of the dynamic loads acting on floating pile foundation constructed in the saturated homogeneous clay, homogeneous loose sand and stratified soils (saturated loose sand above saturated clay and saturated clay above loose saturated sand) as static loads is investigated. Three different magnitude of earthquake was applied to soils and deformations were determined. 2-D Plaxis program was used to determine the deformations of pile foundations. Equivalent static loads are found by applying these deformations to the pile foundations. Equivalent static loads, which give the same deformations, were calculated by back calculation method from the results. Equivalent static loads on pile can be determined by increasing certain percentages, ranging from 4 % to 90 %, of actual static loads.
KEYWORDS: Pile Foundation, Earthquake Load, Plaxis Software, Saturated Clay, Loose Sand, Stratified Soil.
I. INTRODUCTION
Foundations are divided into two main groups such as shallow foundations and deep foundations. Soil bearing capacity, settlement and liquefaction potential are main factors affecting selection of foundation type. Deep foundations are chosen when excessive upper structure loads and weak soil conditions. In addition, dynamic behavior of soils, liquefaction and possible earthquake effects must be considered to safe foundation design. Pile foundations are the most chosen type of deep foundations. Piles are structural members and can be classified by material type (steel, concrete, wooden or composite piles), application type (driven, bored or jacked piles) or load transfer mechanisms (point bearing, friction, compaction or tension piles) [1].
Earthquake generates wave movements and can cause damages. Common earthquake effects are surface rupture, regional subsidence, liquefaction, slope movement, tsunami and seiche [2]. Especially, liquefaction induced settlement and bearing capacity failures can cause huge damages. Tilting or settlement can occur and buildings can suffer. Concerning the damages; liquefied fills, poorly compacted loose soils, structural design faults and wrong construction steps are concluded as main factors by earthquake reports. And also these damages could be seen at buildings on deep foundations consisting of piles or piers [2].
Earthquake can cause damages to pile foundations which have axial loads such as own weight, upper structure load and lateral loads such as earthquake load, wind load, wave load and seismic loads. Kaynia and Kausel (1982); Sen et al. (1985) were developed analytical methods considering linear behavior of soil [3,4]. Nogami et al. (1986) were investigated dynamic behavior of pile groups by Winkler theory [5]. They considered non-linear soil behavior and supposed independent soil-blok, spring and damping. Naggar and Novak (1996) were studied non-linear time behavior of pile groups by using Winkler theory [6]. In all these studies, it can be seen that non-linear soil behavior affects the dynamic behavior of pile groups. In practice, laterally loaded piles are considered as a beam. Soil around the pile are considered as non-linear load transform function known as “p-y curves”. Huang, J. W. (2011) developed p-y curves to determine the behavior of laterally loaded single piles [7].
II. RELATEDWORK
Behavior of pile foundation estimation during earthquake loading requires large investigations. Dynamic loading should be determined and superimposed on the working loads already acting on the pile. On the other hand, to determine reel performance of the pile, site effects on the earthquake loads should be defined. Case history studies about performance of the piles during the earthquakes have been given by lots of researchers such as 1964 Niigata Earthquake [8], Edgecumbe Earthquake [9], 1995 Kobe Earthquake [10,11], 2001 Bhuj Earthquake [12]. Also Bhattcharya et al. (2004) presented an approach to determine behaviour of piles in liquefiable soils during earthquakes [13]. Lin et al. (2005) analysed bending and buckling modes of piles on the case histories [14]. Sharahi (2012) explained performance of piles by using finite difference model [15]. After developments on the computer technology, numerical solutions have been popular by using finite element or finite difference methods, etc. Despite the continuation of studies, the problem requires complex solutions. Researchers are working to simplify the problem.
On the other hand, the other popular approach called performance-based design has been chosen by many engineers and they have estimated displacements under various load combinations [16]. Some seismic design codes such as PIANC (2001) and ISO 23469 (2005) give estimation of pile performance under different earthquake motion levels [17,18]. Selection of displacement limits and designing with considering performance levels are much different from the conventional load/stress based on factor of safety method [16].
III.METHODOLOGY
A. Pile foundation design
Three different pile diameters such as 0.60 m, 0.80 m and 1.00 m are selected. These piles are constructed in homogeneous saturated clay layer, homogeneous loose sand layer and stratified soils such as saturated loose sand above saturated clay and saturated clay above loose sand. 15 m length of pile foundations constructed in the 30 m thick of homogeneous saturated clay layer and homogeneous loose sand layer are shown in Figure 1 and Figure 2, respectively.
B. Materials
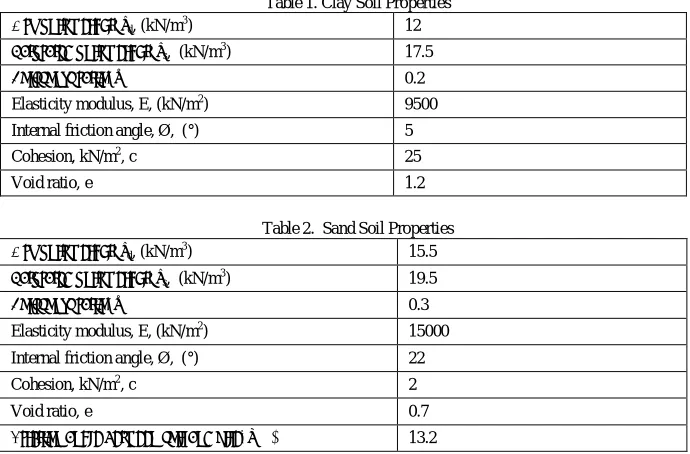
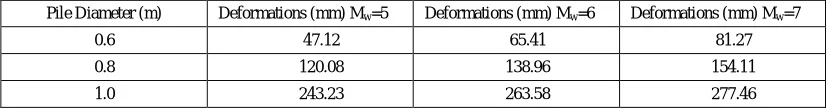
Properties of clay soil and sand are given in Tables 1 and 2, respectively. Ground water level is located at the -0,50 m from ground surface for all models.
Table 1. Clay Soil Properties
Dry unit weight, γd, (kN/m3) 12
Saturated unit weight, γs, (kN/m3) 17.5
Poisson’s ratio, υ 0.2
Elasticity modulus, E, (kN/m2) 9500
Internal friction angle, Ø, (°) 5
Cohesion, kN/m2, c 25
Void ratio, e 1.2
Table 2. Sand Soil Properties
Dry unit weight, γd, (kN/m3) 15.5
Saturated unit weight, γs, (kN/m3) 19.5
Poisson’s ratio, υ 0.3
Elasticity modulus, E, (kN/m2) 15000
Internal friction angle, Ø, (°) 22
Cohesion, kN/m2, c 2
Void ratio, e 0.7
Friction angle between soil and pile, δ (°) 13.2
Properties of piles used in this study are given in Table 3. Earthquake acceleration reports used in this study are given in Table 4. USGS strong motion (smc) data are used for earthquake accelerations. Dynamic moduli of Plaxis 2-D program is widely used to determine the deformations of piles under the earthquake loads in Turkey.
Table 3. Properties of Pile Foundation
Diameter, D, (m) 0.6 0.8 1.0
Material behavior Elastic Elastic Elastic
Length of pile, L (m) 15 15 15
EA (kN/m) 1.08x10⁷ 1.92x10⁷ 3x10⁷
EI (kN/m2/m) 3.24x10⁵ 1.02x10⁶ 2.50x10⁶
Poisson’s ratio, υ 0.2 0.2 0.2
Table 4. Earthquake Properties
Magnitude (Mw) 5 6 7
Epicenter distance (km) 31.8 23.6 20
Date of Earthquake 08.2013 02. 2010 10. 2011
Location of Earthquake Volcano (Hawaii, USA)
Petrolia (California, USA)
Van (Turkey)
C. Bearing capacities and deformations of single pile
Bearing capacities of piles are found by using different methods. Among them, Meyerhof’s method and α method
Bearing capacities are applied to piles in terms of static loads. Deformations of piles are calculated by empirical methods and Plaxis program under static loads. These deformations for sand and clay layers are given in Tables 5 and 6, respectively.
Table 5. Deformations for sand layer Vertical load (kN) / Pile
Diameter (m) Deformations (mm) Empirical
Deformations (mm) Plaxis Software
332 / (0.6) 28.53 29.01
560 / (0.8) 37.90 39.08
850 / (1.0) 47.30 53.25
Table 6. Deformations of Clay Layer Vertical load (kN) / Pile Diameter
(m) Deformations (mm) Empirical
Deformations (mm) Plaxis Software
282 / (0.6) 33.26 30.60
396 / (0.8) 42.10 43.92
520 / (1.0) 51.96 59.38
Deformations for clay layer above sand layer and sand layer above clay layer are given in Tables 7 and 8, respectively.
Table 7. Deformations of 22,5m Clay Layer above 7,5m Sand Layer
Vertical load (kN) / Pile Diameter (m) Deformations (mm) Empirical Deformations (mm) Plaxis Software
193 / (0.6) 28.52 22.31
278 / (0.8) 40.49 35.27
375 / (1.0) 50.12 47.62
Table 8. Deformations of 22,5m Sand Layer above 7,5m Clay Layer
Vertical load (kN) / Pile Diameter (m) Deformations (mm) Empirical Deformations (mm) Plaxis Software
362 / (0.6) 28.27 24.98
580 / (0.8) 38.53 35.05
847 / (1.0) 49.22 47.31
IV.EXPERIMENTALRESULTS
A. Earthquake analysis of pile groups by using plaxis program
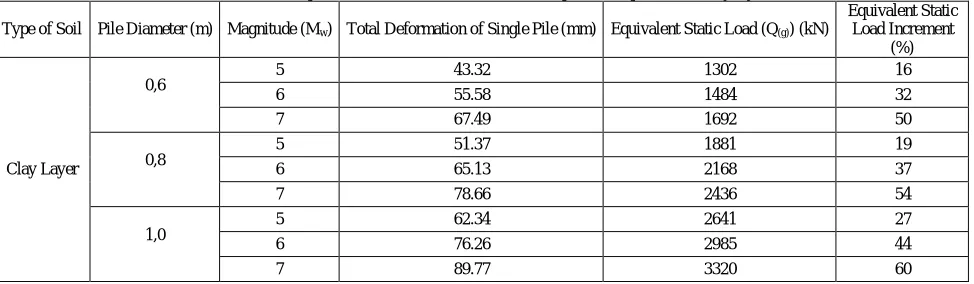
Calculated bearing capacities are applied to 4 by 4 pile groups as a vertical load. Deformations of pile groups are found by Plaxis program under the earthquake loads. Equivalent static loads, which gives the same deformations, was calculated by back calculation method from the results. Deformations occurred in the sand and clay layers under the earthquake loads are given in Tables 9 and 10, respectively.
Table 9. Deformations occurred in the Sand Layer under the Earthquake Loads
Pile Diameter (m) Deformations (mm) Mw=5 Deformations (mm) Mw=6 Deformations (mm) Mw=7
0.6 47.12 65.41 81.27
0.8 120.08 138.96 154.11
Table 10. Deformations occurred in the Clay Layer under the Earthquake Loads
Pile Diameter (m) Deformations (mm) Mw=5 Deformations (mm) Mw=6 Deformations (mm) Mw=7
0.6 59.70 76.60 93.01
0.8 85.71 108.66 131.23
1.0 122.19 149.47 175.95
B. Determination of equivalent vertical static loads by back calculation method from the vertical deformations obtained by using plaxis program in clay and sand layers
While group efficiency factor (E) are changing for each pile, group efficiency factor is chosen minimum 0.70 due to the 4 piles in the group. Equivalent vertical static loads, which gives the same deformations, was calculated by back calculation method from the results Table 11 and 12).
Converse – Laberre equation:
E = 1−tan ( ) ( ) , E = 0.70 (1)
Equivalent static loads and equivalent static load increments for 15 m length of single pile constructed in the 30 m thick clay layer are given as an example. Deformations of single pile (D=0.80 m) are determined by using back calculation from deformations of pile group composed of 4 piles under the earthquake load, Mw=6 [19].
End Bearing Capacity Calculation (Meyerhof’s method is used):
Qp = Ap x qp = Ap x (c x Nc*+ qp' x Nq*) (2)
Skin Friction Capacity Calculation for Clay (α’s method is used):
Qs = ∑ α x p x cux ΔL (3)
Skin Friction Capacity Calculation for Sand:
Qs = P x L' x fav (4)
Total elastic settlement of pile Calculation S= S1+S2+S3 (under static load):
Settlement of pile shaft, S1
S1 = (Qp+ ξ Qs) (L) / (Ap x Ep) (5)
Settlement of pile caused by the load at the pile point, S2
S2 = (Qp x D) (1-μs2) Iwp / (Ap x Es) (6)
Settlement of pile caused by the load transmitted along the pile shaft, S3
S3 = (Qs)/(pxL) (D/Es) (1-μs2) Iws (7)
Elastic settlement of pile group is calculated by using Skempton’s formula:
Sg(e) = S (4D+3/D+4)2 (8)
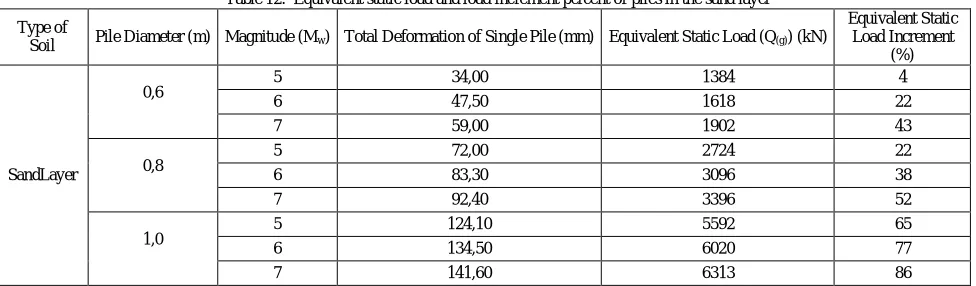
Table 11. Equivalent static load and load increment percent of piles in the clay layer
Type of Soil Pile Diameter (m) Magnitude (Mw) Total Deformation of Single Pile (mm) Equivalent Static Load (Q(g)) (kN)
Equivalent Static Load Increment
(%)
Clay Layer
0,6 5 43.32 1302 16
6 55.58 1484 32
7 67.49 1692 50
0,8 5 51.37 1881 19
6 65.13 2168 37
7 78.66 2436 54
1,0
5 62.34 2641 27
6 76.26 2985 44
Table 12. Equivalent static load and load increment percent of piles in the sand layer
Type of
Soil Pile Diameter (m) Magnitude (Mw) Total Deformation of Single Pile (mm) Equivalent Static Load (Q(g)) (kN)
Equivalent Static Load Increment
(%)
SandLayer
0,6
5 34,00 1384 4
6 47,50 1618 22
7 59,00 1902 43
0,8
5 72,00 2724 22
6 83,30 3096 38
7 92,40 3396 52
1,0
5 124,10 5592 65
6 134,50 6020 77
7 141,60 6313 86
C. Determination of equivalent vertical static loads by back calculation method from the vertical deformations obtained by using plaxis program in the 22.5 m clay above sand layer and 22.5 m sand layer above clay layer
Calculated bearing capacities are applied to 4 by 4 pile groups as a vertical load. Deformations of pile groups are found by Plaxis program under the earthquake loads. Equivalent static loads, which give the same deformations, was calculated by back calculation method from the results. Deformations occurred in the 22,5 m clay layer above 7,5m sand layer and 22,5 m sand layer above 7,5m clay layer under the earthquake loads are given in Tables 13 and 14, respectively.
Table 13. Deformations of Single Pile and Group Piles Under the Earthquake Loads Constructed 22,5 m Clay Layer above 7,5 m Sand Layer
Table 14. Deformations of Single Pile and Group Piles Under the Earthquake Loads Constructed 22,5 m Sand Layer above 7,5 m Clay Layer
Type of Soil Pile Diameter (D) m Magnitude (Mw) Deformation of Pile Groups (mm) Deformation of Single Pile (mm)
22,5 m Clay Layer + 7,5 m Sand Layer
0,6
5 41,73 30,27
6 56,75 41,18
7 68,21 49,50
0,8
5 61,86 37,08
6 79,57 47,69
7 96,31 57,73
1,0
5 94,73 48,83
6 112,22 57,26
7 128,62 65,62
Type of Soil Pile Diameter (D) m Magnitude (Mw) Deformation of Pile Groups (mm) Deformation of Single Pile (mm)
22,5 m Sand Layer + 7,5 m Clay Layer
0,6
5 51,91 37,67
6 69,78 50,64
7 86,04 62,44
0,8
5 124,81 74,81
6 142,77 85,57
7 158,97 95,28
1,0
5 242,59 123,77
6 260,88 133,10
Equivalent static loads and equivalent static load increments for 15 m length of single pile constructed in the 7.5 m thick clay layer and 22.5 m sand layer are given as an example. Deformations of single pile (D=0.80 m) are determined by using back calculation from deformations of pile group composed of 4 piles under the earthquake load, Mw=6
[19].Equivalent static load and percent of load increments are given in Tables 15 and 16.
Table 15. Equivalent static load and load increment percent of piles in the 22.5 m Clay Layer and 7.5 m Sand Layer
Pile Diameter (D) m Magnitude (Mw)
Equivalent Static Load (kN)
Equivalent Static Load Increment (%)
0,6
5 852 11
6 1014 32
7 1138 48
0,8
5 1271 14
6 1481 33
7 1679 51
1,0 5 1867 25
6 2088 39
7 2294 53
Table 16. Equivalent static load and load increment percent of piles in the 22.5 m Sand Layer and 7.5 Clay Layer
Pile Diameter (D) m Magnitude (Mw)
Equivalent Static Load (kN)
Equivalent Static LoadIncrement (%)
0,6 5 6 1531 1752 21 6
7 2043 41
0,8 5 6 2999 3353 29 44
7 3673 58
1,0 5 6 5765 6150 70 82
7 6482 91
V. CONCLUSION
In this study, pile foundations having different diameters under the total vertical static loads, constructed in the 30 m thick saturated clay layer, sand layer, 22,5 m clay layer above 7,5 m sand layer and 22,5 m sand layer above 7,5 m clay layer are designed under the static and dynamic loads. Deformations of piles and pile groups under the dynamic loads are found by using empirical methods and plaxis program. Equivalent static loads, which give the same deformations to piles and pile groups, are determined.
Following results can be drawn from this study;
In the case of assuming constant total load and the effect of earthquake loads on pile group and satisfying the minimum distance between the piles (2.5 D), deformations of piles and pile groups increase with increasing the pile diameter under the static and dynamic loads. Therefore, equivalent static load also increases. Because, piles are assumed to be floating or friction piles.
The magnitudes of the earthquake are measured by using Richter scale which is a logarithm. When the magnitude of earthquake increases one unit, wave amplitude and the stress energy increase 10 times and 30 times, respectively. Therefore, deformations and equivalent static loads increase with increasing magnitudes of earthquake.
High deformations is observed in the case of loose sand layer due to the decreasing of stability of soil. When the magnitude of earthquake is Mw=5.0 and the diameter of pile is 0.60 m, the static load can be increased 4 %. However, in the case of pile having 1.00 m in diameter, static load can be increased 65 % [20].
Equivalent static load increments are about 48 %, 51 % and 53 % for piles having diameters of 0.60 m, 0.80 m and 1.00 m constructed in the saturated 22.5 m clay layer above 7.5 m sand layer under the earthquake loads of Mw=5.0, Mw=6.0 and Mw=7.0, respectively.
In the case of saturated 22.5 m sand layer above 7.5 m clay layer, the soil can loose its strength and stability under the earthquake loads. Therefore, equivalent static load increment is about 91 %.
This study is performed for specific soil properties and pile diameters.
REFERENCES
[1] M.J. Das,“Principles of Soil Dynamics.” PWS-Kent Pub., USA, 1993.
[2] R.W. Day, “Geotechnical Earthquake Engineering Handbook.” McGraw Hill. USA, 2002.
[3] A. M.Kaynia, E.Kausel, “Dynamic behavior of pile groups”, Proc. 2nd International Conference on Numerical Methods in Offshore Piling, Austin, Texas, pp. 509–532, 1982.
[4] R.Sen, T. G.Davis, P. K.Banerjee, “Dynamic analysis of piles and pile groups embedded in homogenous soils”, Earthquake Engineering and Structural Dynamics, Vol.13, No.1, pp. 53–65, 1985.
[5] T.Nogami, K.Konagai, “Time domain axial response of dynamically loaded single piles”, Journal of Engineering Mechanics, ASCE, Vol. 112, No. 11, pp. 1241–1252, 1986.
[6] M. H. El Naggar, M.Novak, “Nonlinear analysis for dynamic lateral pile response soil”, Soil Dynamics and Earthquake Engineering, Vol. 15, No. 4, pp. 233-244, 1996.
[7] J. W. Huang, “Development of modified py curves for Winkler Analysis to characterize the lateral load behavior of a single pile embedded in improved soft clay”, Graduate Theses and Dissertations, Paper 12114. Iowa State University, 2011.
[8] M. Hamada, “Case studies of liquefaction and lifeline performance during past earthquakes.” Japanese Case Studies, Technical Report, NCEER-92-0001, 1992.
[9] J.P.Berrill, S.A.Christensen, R.P.Keenan, W. Okada, J.R. Pettinga,“Case studies of lateral spreading forces on a piled foundation.” Geotechnique, Vol. 51, No. 6, pp. 501-517, 2001.
[10] K.Tokimatsu,H.Mizuno, M. Kakurai, “Building damaged associated with geotechnical problems.”, Soils and Foundations Special Issue, pp. 219-234, 1996.
[11] K. Soga, “Geotechnical aspects of Kobe earthquake in EEFIT report on the Kobe earthquake”, Institution of Structural Engineers, 1997. [12] S.P.G.Madabhushi, D.Patel, S.K.Haigh, “Geotechnical aspects of the Bhuj earthquake”, Institution of Structural Engineers, 2005.
[13] S.Bhattacharya, S.P.G.Madabhushi, M.D. Bolton,“An alternative mechanism of pile failure in liquefiable deposits during earthquakes.” Geotechnique, vol. 54, No. 3, pp. 203-213, 2004.
[14] S.S. Lin, Y.J.Tseng, C.C. Chiang, C.L. Hung,“Damage of piles caused by lateral spreading back study of three cases”, Seismic performance and simulation of pile foundations in liquefied and laterally spreading ground, GSP No:145, ASCE, pp. 121-133, 2005.
[15] J.M.Sharahi,“Performance of piles in liquefiable soils using numerical analysis.”, Proc. 3rd International Conference on New Developments in Soil mechanics and Geotechnical Engineering, pp. 271-277, 2012.
[16] G.Madabhushi, J.Knappett, S.Haigh, “Design of Pile Foundations in Liquefıable Soils”, Imperial College Press. London, 2010.
[17] Permanent International Association for Navigation Association (PIANC). “Seismic design guidelines for port structures”, Balkema, Roterdam, 2001.
[18] ISO 23469,“Bases for design of structures-seismic actions for designing geotechnical works.”, 2005. [19] M.J. Das, “Principles of Foundation Engineering.” Brooks, Cole Engineering Division. USA, 1984.