Predictive Study of CAP1400 Core Barrel Flow-induced Vibration-Part1:
Turbulence induced Forcing Function
Zhang Wei 1, Li Yuan 2, Zhang Ming3, Yu Qing 4
1
Engineer, Shanghai Nuclear Engineering Research and Design Institute, China 2
Engineer, Shanghai Nuclear Engineering Research and Design Institute, China 3
Principal Engineer, Shanghai Nuclear Engineering Research and Design Institute, China 4
Consultant Engineer, Shanghai Nuclear Engineering Research and Design Institute, China
ABSTRACT
CAP1400 is a 1400 MWe pressurized water reactor developed by SNERDI to be the next series of nuclear power plants in China. As a part of the feasibility study, a 1/6 scale model test of the pressure vessel and its internals was conducted to study the flow induced vibration (FIV) characteristics.
This paper describes the predictive study in calculating the core barrel vibration magnitudes and its successful comparison to the test measurements. It is noted that this is the first part, which describes the forcing function development and its successful comparison with the pressure pulsations measured from the scale model test, of a two-part series.
The structural aspects, i.e., the core barrel vibration predictive study and their comparison with the test results, will be described in the second part of this series.
1.0 Introduction
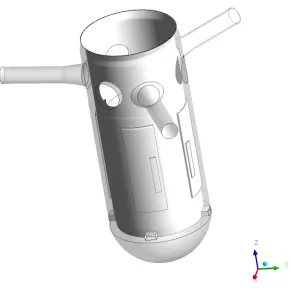
A core barrel, as its name implied, in a pressurized water reactor is a cylindrical barrel, containing the fuel assemblies inside, hanging from the vessel ledge. The impingement from the inlet flow and the ensuring turbulence generated by the flow turning and expanding at the bottom of the core barrel are the two major sources of core barrel vibration. Since core barrel is the major component of the reactor internals, the vibration of the core barrel has always been the number one concern for all reactor internal components.
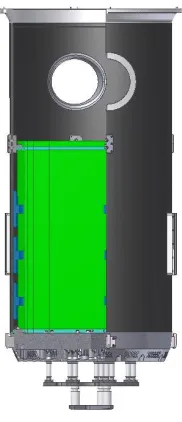
Figure 1-1 Illustration of CAP1400 Core Barrel
As a part of the CAP1400 feasibility study, a 1/6 scale model of the pressure vessel and internals was constructed and a FIV test was conducted in Chengdu, China, to study the flow induced vibration characteristics. Prior to the test, predictive studies were carried out on the various parts of the reactor internals. The overall objective of this paper, divided into Part 1 and Part 2, is to describe the methodologies used in predictive study of the core barrel vibration and the comparison with the test measurements. Part 1 is to describe the forcing function development and its successful comparison with the pressure pulsations measured from the scale model test. Part 2 will be on the prediction of the structural response of the core barrel vibration.
2.0 Overview
The entire project can be described in the following major parts
1) Benchmarking of the core barrel FIV response prediction methodology 2) Calculation of the CAP1400 scale model response
3) Comparison with the scale model test measurement The overall flow chart is shown in Figure 1-2.
Figure 2-1 Overview of Prediction Study
Part 1 of this paper is shaded in gray and is more emphasized on the turbulence forcing function aspect of the subject. Part 2, while overlapping with Part 1 in the benchmarking process, is more focused on the structural aspect of the project.
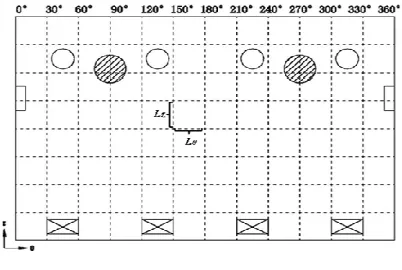
Because the coolant flow in the downcomer region is largely parallel to the axial direction, turbulence model of parallel flow over a large flat plate is deemed appropriate in this application. However, pressure pulsation over the entire core barrel outer surface is uneven; it is largely affected by the inlet and outlet nozzles in the circumferential direction and by the local structural disturbances in the axial direction. Therefore, for simplicity, the entire core barrel surface was evenly divided into 12 and 8 divisions in the circumferential and axial, respectively, directions, as shown in Figure 2-1. In other words, the entire core barrel surface is divided into 96 regions.
Figure 2-2 Division of Core Barrel Surface
Based on the divisions above, the turbulence forcing function, which is a function of both z and θ, on any given region can be expressed as [1],
(
)
(
2)
2(
*)
, ,
, p
G x f = ρU δ U φ f U k (2-1)
Where
Gp(x,f) ——Pressure PSD,Pa2/Hz;
x ——Any given division,function of z and ; f ——Frequency,Hz;
ρ ——Density of coolant,kg/m3;
U ——Average flow velocity of a given region,m/s; δ ——Downcomer width,m;
k ——kinetic energy,m2/s2
f * ——Reduced frequency = f
δ
/U (2-2)(
*)
, ,
f U k
φ
is a dimensionless parameter related to the turbulence levelTherefore, the pulsating pressure can be calculated based on Equation 2-1 . However, the correlation length in the downcomer region is in the order of the downcomer width which is substantially smaller than the dimensions of our divisions. Consequently, an equivalent pressure, which takes the correlation effect into consideration and will be assumed to be constant over a given region, can be derived based on the following expression, [1]:
(
,)
(
, ,)
(
,)
(
,)
f p p
G x f =
∫∫
γ x x′ ′′ f G x f G′ x′′ f dA dA′ ′′Where is the coherence function and x’ and x’’ are any two points within a division. For a cylindrical surface, dA’ and dA’’ can be expressed as:
(
)
(
)
dA dA′ ′′=dz Rd′ θ′ dz′′ Rdθ′′
(2-4)
Where R is the outside radius of the core barrel.
Based on [1], the coherence function, γ (x′,x′′, f ) , can be decoupled in the circumferential and axial directions. In other words,
(
x x f, ,)
z(
z z, ,f) (
θ , ,f)
γ ′ ′′ =γ ′ ′′ γ θ θ′ ′′
(2-5)
(
, ,)
zz z
z z z f e
λ γ ′−′′ − ′ ′′ = (2-6)
(
, ,)
Rf e θ
θ θ λ θ γ θ θ ′− ′′ − ′ ′′ = (2-7)
Where, λz and λθ represent the correlation length, a function of frequency, in the axial and circumferential
directions, respectively. From the experimental data of [2] and [3]:
Theoretically, the pressure on the surface could be different from one point to another. However, over the large surfaces of the core barrel, the variation in flow velocity, which is directly related to the fluctuating pressure, is relatively small. For this reason, we assume that within a given region, the amplitude of pressure is uniform. In other words, Gp(x, f ) = GP( f ). Consequently,
(
,)
(
,)
( )
p p p
G x f G′ x f′′ =G f
(2-8)
Substituting Equations (2-5), (2-6), (2-7) and (2-8) into Equation (2-3), we get:
( )
( )
( ) (
)
(
)
20 0 0 0
, ,
z z z
R z z
L L L L
f p
p z z z
G f G f e dz dz R e d d
G f L L
θ θ θ θ θ λ λ θ θ θ θ θ λ λ ′ ′′ ′− ′′ − − − ′ ′′ ′ ′′ = × = Γ Γ
∫ ∫
∫ ∫
(2-9) Where:(
,)
2 1 1z
z L
z
z z z z z
z
L L e
L λ λ λ λ − Γ = − −
(2-10)
( , ) 2 1 1
L
L L e
L θ θ λ θ θ θ θ θ θ θ λ λ λ − Γ = − −
(2-11)
( )
(
2)
2(
)
(
*)
(
) (
)
, ,
,
,
f z z z z z z
G
f
=
ρ
U
δ
U
φ
f U k
Γ
λ
L
Γ
λ
L
(2-12)
Therefore, with the input of the local average flow velocity, U, and the kinetic energy, k, the PSD level at any given region can be calculated from Equation (2-12).
2.2 Benchmarking
The 1/6 scale model turbulence forcing function was generated first by benchmarking against the Doel 4 test data, [2]. The following steps were taken:
1.Build a Doel 4 core barrel-downcomer CFD model
2.Calculate Doel 4 PSD forcing function based on methodology used in [1]
3.Build a Doel 4 core barrel structural model, including the hydrodynamic mass effects and check against the Doel 4 core barrel frequency obtained from the hot functional test.
4.Perform a PSD analysis on the core barrel structural model using forcing functions derived in step 2) 5.Check against Doel 4 core barrel vibration magnitude and adjust parameters used in the forcing function, if necessary.
6.Build a 1/6 scale CAP1400 core barrel-downcomer CFD model
7.Using the parameters developed from the benchmarking process to generate the corresponding scale model forcing functions. It is noted that the scale model test was done in room temperature.
2.3 Doel 4 CFD Model
Doel 4 is a Westinghouse designed 3xL plant and is also the reference design for the Westinghouse AP1000 series of reactor internals. The hot functional test, which was focused on the lower internal vibration, was conducted in 1985. It is noted that Doel 4 is a neutron panel plant.
Figure 2-3 Doel4 CFD model
Table 2-1 Comparison of Doel4 and Scale Model CFD Parameters [2]
Parameter Unit Doel 4 1/6 Scale
Coolant Temperature ℃ 297 25
Coolant Density kg/m3 733 998
Dynamic Viscosity kg/(m·s) 8.9E-5 8.9E-4
System Pressure MPa 15.5 1.2
Inlet Velocity m/s 21.4 22.8
Inlet Nozzle ID mm 698 108
The realizable κ−ε option of the ANSYS Fluent Code was used for the CFD analysis. The results are shown in Figure 2-4 thru 2-5.
Figure 2-4 Doel 4 Downcomer Flow Velocity
Figure 2-6 Doel 4 Pressure PSD on Core Barrel Outer Surfaces at Several Elevations
The pressure PSD was subsequently applied to a Doel 4 core barrel model and the amplitude of the core barrel was calculated. The calculated amplitude was within 4% of the actual measurement. This part of the study will be presented in more details in Part 2 of this series.
2.4 Scale Model CFD Model
The 1/6 scale model to be is a scaled replica of the CAP1400 design except
a) The upper head and the upper head internals, i.e., the upper guide tube and the IGA were not modeled b) The various gaps between the internal components are not scaled.
c) The fuel assemblies were represented by a simplified structure having the same dead weight d) The core shroud structure was somewhat simplified to allow the installation of transducer wirings.
Figure 2-7 Scale Model Test Configuration
The 1/6 scale lower internal CFD model was constructed with the same methodology except a) All contour of the secondary support assemblies were modeled
b) All flow holes in the lower core support plate were explicitly modeled and
Since the CAP1400 core barrel is largely a symmetrical structure, only 1/4 model is needed.
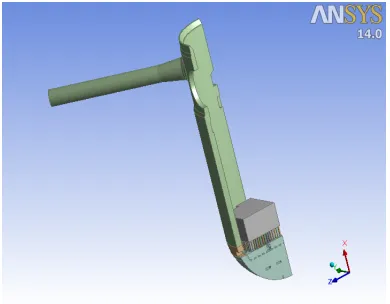
Figure 2-8 CAP1400 1/6 Scale CFD Model
The corresponding CFD results are shown in the following figures
Figure 2-9 Scale Model Flow Velocity Distribution
Figure 2-10 Scale Model Kinetic Energy Distribution
3.0 Scale Model FIV Test
pressure transducers were installed, on various angles and elevations, measured from the top of the core barrel flange, on the core barrel outer surfaces.
Figure 3-1 Scale Model Pressure Gage Arrangement
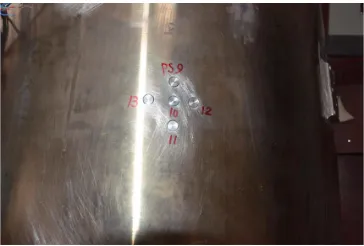
Figure 3-2 Pressure Transducers #9 thru #13
Outside the pressure gages, there were a total of 6 strain gages installed on both the inside and the outside surfaces of the core barrel under the core barrel flange. In addition, there were two accelerometers and two relative displacement transducers (LVDT) installed at the bottom of the core barrel. The test was conducted in room temperature and pressure.
3.1 Scale Model Test Results
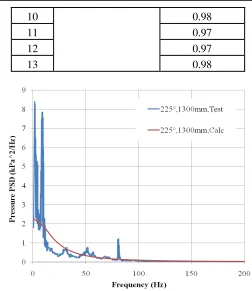
Of the 13 pages, gages #2 and #3 malfunctioned. The rms pressure measured from the rest of the gages are compared with the calculated values as follows:
Table 3-1 Comparison of Calculated and Measured (rms) Pressure (kPa) # Transducer Locations Test/ Calculated
10 0.98
11 0.97
12 0.97
13 0.98
Figure 3-3 Comparison of Measured and Calculated Pressure Spectra
It is seen that other than the around 10 Hz content, most likely a system acoustic mode, and the around 83 Hz spike, which is the pump frequency, the rest of the measured pressure spectra matches pretty good with the calculated spectra. Along with the good match in the core barrel vibratory amplitudes, which will be presented in Phase 2 of this paper, we conclude that the proposed turbulence forcing function has successfully accomplished the prediction work.
4.0 CONCLUSION
This paper combined the CAP1400 scale model CFD results along with the empirical forcing functions and the correlation effect, synthesized by Westinghouse, to postulate a set of forcing functions acting on the core barrel outer surfaces. The results, in terms of fluctuating pressures, are compared fairly well with the measured pressures from the scale model test and, thus, demonstrating the validity of the proposed methodology.
5.0 REFERENCES
[1] M.K. Au-Yang, “Flow-Induced Vibration of Power and Process Plant Components,” ASME Press (2001): Pg. 230-235.
[2] M.K. Au-Yang and K.B. Jordan, Dynamic Pressure Inside a PWR – A Study Based on Field and Laboratory Test Data, Nuclear Engineering and Design Vol. 58 (1980): Pg. 113-125.

![Table 2-1 Comparison of Doel4 and Scale Model CFD Parameters [2]](https://thumb-us.123doks.com/thumbv2/123dok_us/1650420.1206649/6.612.221.390.441.559/table-comparison-doel-scale-model-cfd-parameters.webp)